The Signal Said LOW. The Chart Said Reverse.
This Pocket Option session runs on PipGems live signals delivered by the Signal Companion browser extension. Every alert opens a Signal Checks card that grades it against that signal’s own recent history. In this video, almost every alert came back LOW, at 26% to 54% after slippage.
The trader still took them, with one condition: the chart had to show a stretched move to fade. A PUT alert was traded only after price had shot up, and a CALL alert only after a hard drop. That is the subject of this post. We look at what the Signal Checks card actually shows, how the reversal read was applied on each trade, and the one click on the wrong chart that turned a single alert into two losses.
The session is on a Pocket Option real account (QT Real), with 1-minute expiries, a flat $100 per trade and real currency pairs only, no OTC. There were 14 trades: 10 wins, 2 losses and 2 draws. We read every row of the closed-trades list off the frames and checked the total against the balance.
Setting Up the Signal Companion
The first three minutes are the setup, in this order:
- Install the extension. Find the PipGems Signal Companion in the browser’s extension store, click Get, then Add extension.
- Log in on Pocket Option. Open the extension on the broker tab and sign in with your PipGems account. The video says that signal alerts need an active Pro subscription.
- Choose the on-chart windows. In the extension settings, each window and each kind of alert has its own switch: signal alerts, notification sound, voice announcements, and the AI Chart Scanner, Pair Filter, Live Gauge, Signal Check and Log a Trade windows. The alert pace is set to 1m.
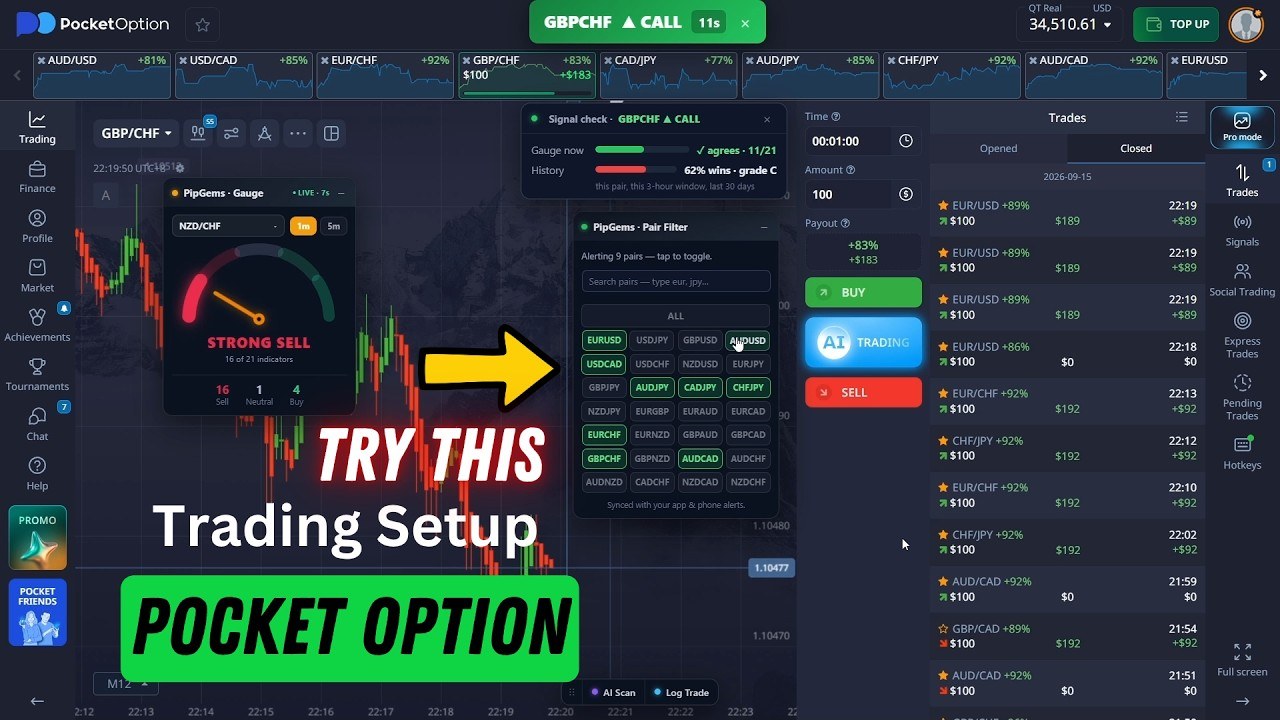
- Build the pair filter. Type a pair name and tap it to add it. Only real currency pairs go in.
- Switch Signal Checks to Advanced. The basic view gives only the verdict. Advanced adds the 1-hour and 3-hour history and the gauge reading for every timeframe.
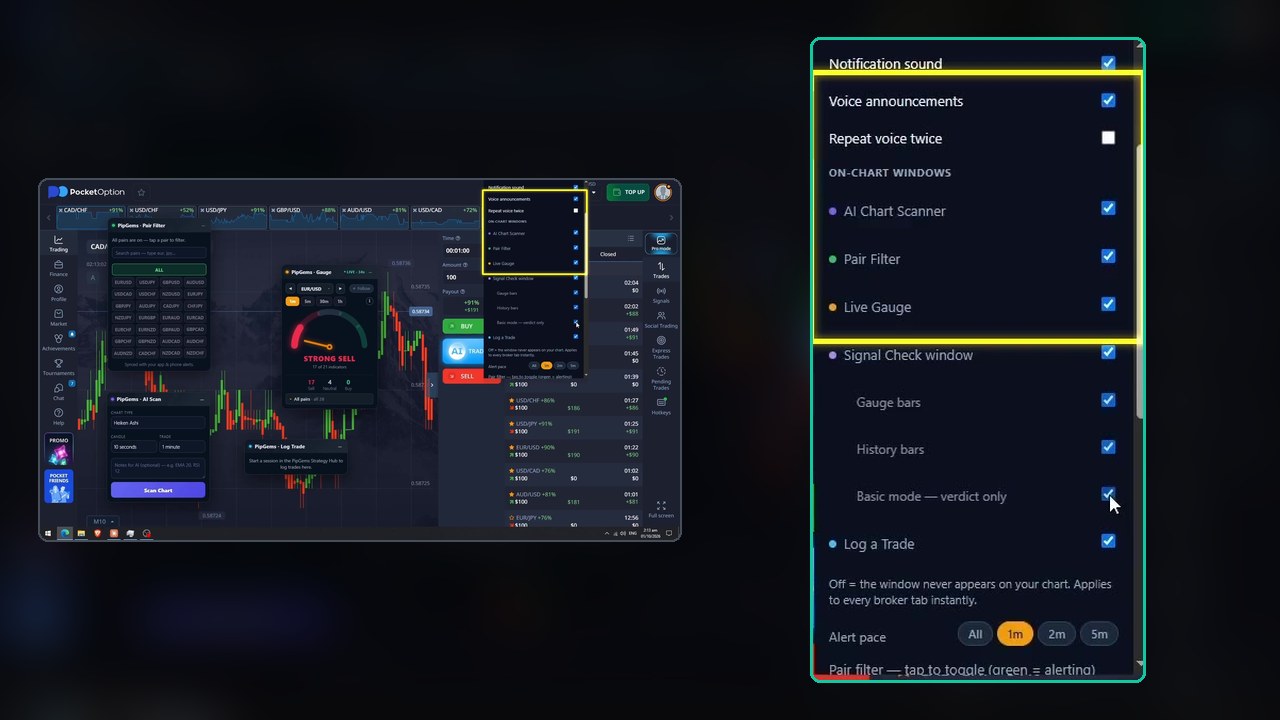
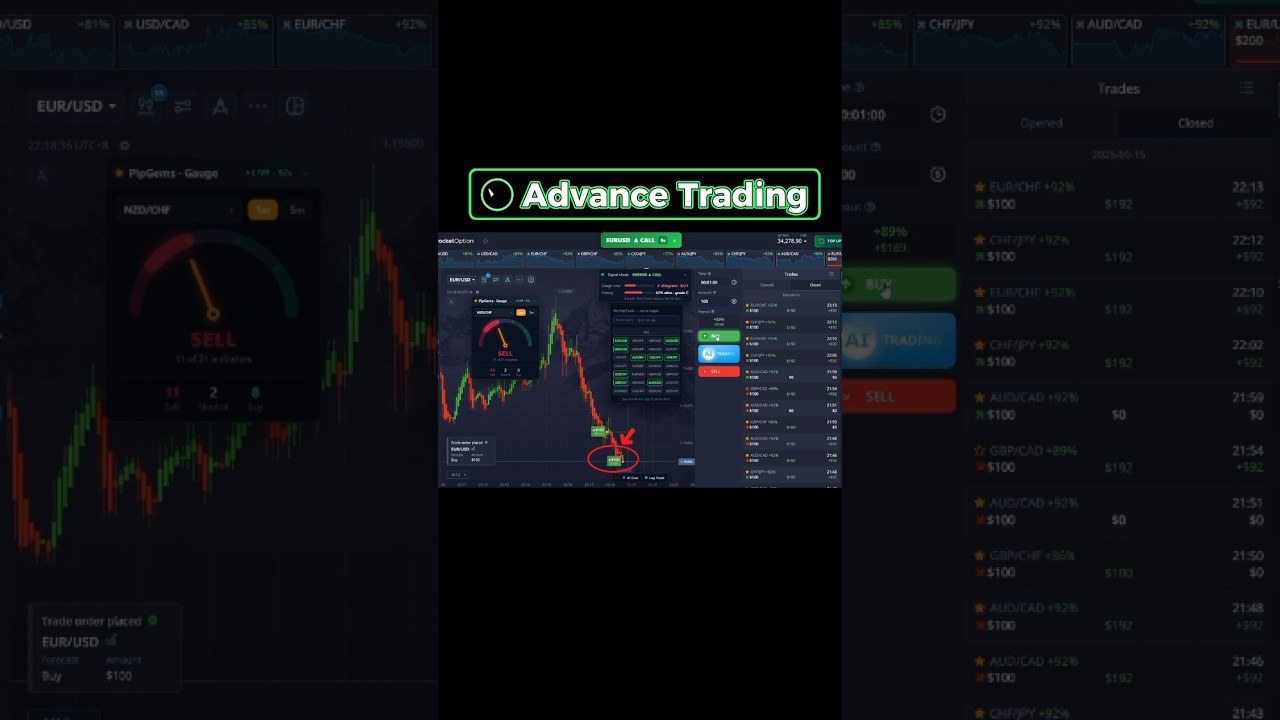
The gauge counts how many of 21 indicators point the same way right now. In the opening frames it reads STRONG SELL, 17 of 21. That is a count of indicators that agree at this moment. It is not a win rate, and the panel says so in its own small print.
Real Pairs Only: the Pair Filter
The filter in this session alerts on eight pairs: EUR/USD, USD/JPY, GBP/USD, AUD/USD, USD/CAD, GBP/CHF, AUD/CHF and CAD/CHF. Everything else stays grey and silent. Together with the All alerts switch, it decides which alerts actually ring.
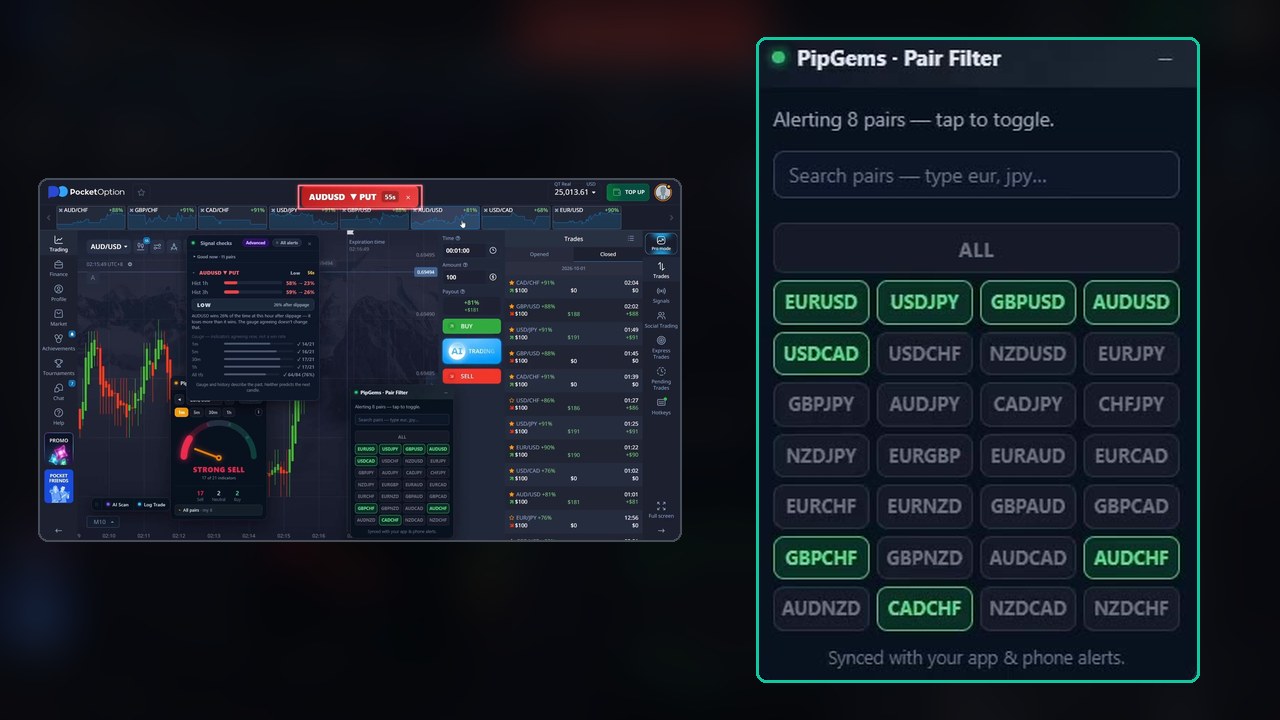
Why no OTC? PipGems reads the real forex market. OTC pairs run on the broker’s own price feed when the real market is closed, so a signal built on real prices does not describe them. The trader points at the OTC pairs in the asset list and says these are the ones to skip. The same limit applies to MT4/MT5 indicators, which cannot read a broker’s OTC prices either.
Reading the Signal Checks Card
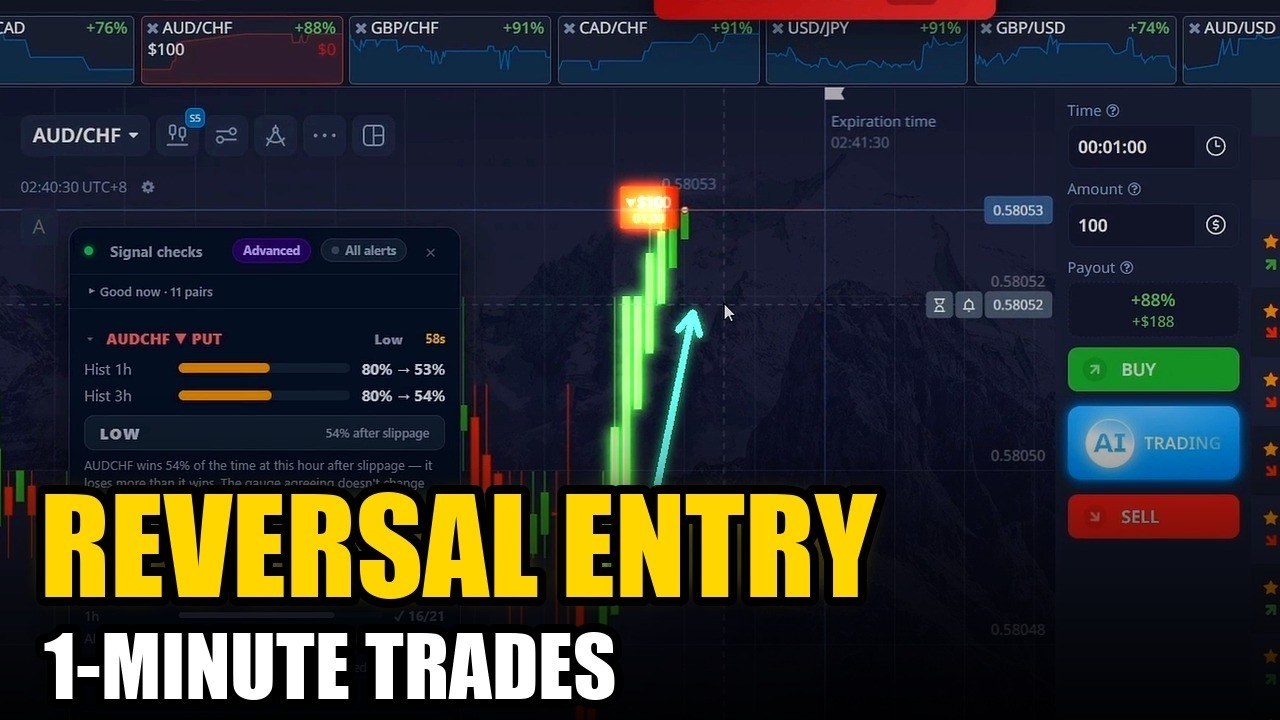
Here is the first alert of the session, an AUD/USD PUT, as the Advanced card shows it:
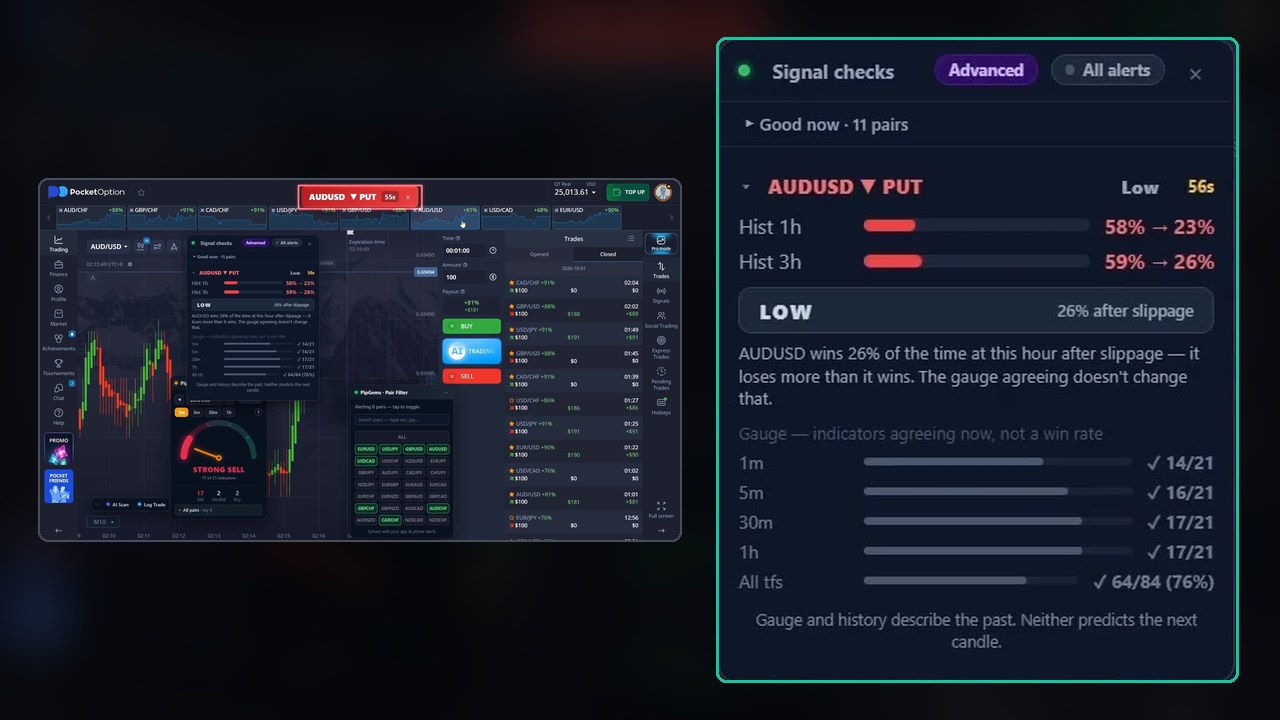
- Hist 1h / Hist 3h show two numbers each: the raw history, then the figure after slippage. Here 58% became 23% and 59% became 26%.
- The verdict uses the after-slippage number. At 26% it is LOW, and the card spells it out: AUD/USD “loses more than it wins” at this hour, and “the gauge agreeing doesn’t change that.”
- The gauge bars show how many of 21 indicators agree on each timeframe (14, 16, 17 and 17 here, 64 of 84 overall). The label above them reads “indicators agreeing now, not a win rate.”
- The footer says: “Gauge and history describe the past. Neither predicts the next candle.”
Every alert in the session read LOW except one AUD/CHF put that the card labelled FAIR at 54%. If you traded the verdict alone, you would have skipped nearly all of them.
The Reversal Read: History Is Context, the Chart Decides
The narration repeats one rule on every trade: “The signal gives us the timing. The chart gives us the reason.” In practice it worked like this:
- An alert rings for a pair in the filter.
- Check the direction against the last few candles. A PUT was taken when price had just shot up (a strong run, a sharp spike, stretched at the top). A CALL was taken when price had just dropped hard.
- Enter for 1 minute with the same stake, and leave the trade alone until it closes.
So the low history did not stop the trade. It was treated as background, and the stretched candles were the actual reason to enter. In all 14 trades the alert direction and the reversal read pointed the same way. The video does not show what the trader does when they disagree.
All 14 Trades, Checked
The table below is built from the Pocket Option closed-trades list (the times are close times on the broker clock) and the history reading the trader quotes for each alert. Payouts are the ones shown on each row.
| # | Closed | Pair | Alert | History* | What the chart showed | Trade | Payout | Result |
|---|---|---|---|---|---|---|---|---|
| 1 | 02:16 | AUD/USD | PUT | 26% | Price shot straight up | PUT | 81% | +$81 |
| 2 | 02:17 | CAD/CHF | CALL | 30% | Hard drop | CALL | 91% | Draw $0 |
| 3 | 02:21 | USD/JPY | CALL | 43% | Falling for a while | CALL | 91% | +$91 |
| 4 | 02:26 | GBP/USD | PUT | 40% | Candles pushed up (basic view) | PUT | 88% | +$88 |
| 5 | 02:27 | GBP/USD | — | — | Wrong chart: meant for the AUD/CHF alert | CALL | 86% | −$100 |
| 6 | 02:28 | AUD/CHF | CALL | 54% | The intended trade, on the right chart | CALL | 88% | −$100 |
| 7 | 02:28 | AUD/USD | CALL | 26% | Price dropped, bounce wanted | CALL | 81% | +$81 |
| 8 | 02:32 | USD/JPY | PUT | 43% | Price climbed straight up | PUT | 91% | +$91 |
| 9 | 02:34 | GBP/CHF | PUT | 54% | Strong run up | PUT | 80% | +$80 |
| 10 | 02:37 | AUD/CHF | PUT | 54% (FAIR) | Stretched at the top | PUT | 88% | +$88 |
| 11 | 02:39 | GBP/USD | PUT | 40% | Sharp spike up | PUT | 85% | +$85 |
| 12 | 02:40 | CAD/CHF | CALL | 30% | Price fell hard | CALL | 91% | +$91 |
| 13 | 02:41 | AUD/CHF | PUT | 54% | Ran up fast | PUT | 88% | +$88 |
| 14 | 02:43 | GBP/USD | CALL | 40% | Price dropped | CALL | 74% | Draw $0 |
* 1-hour or 3-hour history after slippage, as read out on each alert. Trade 4 was read in the basic view.
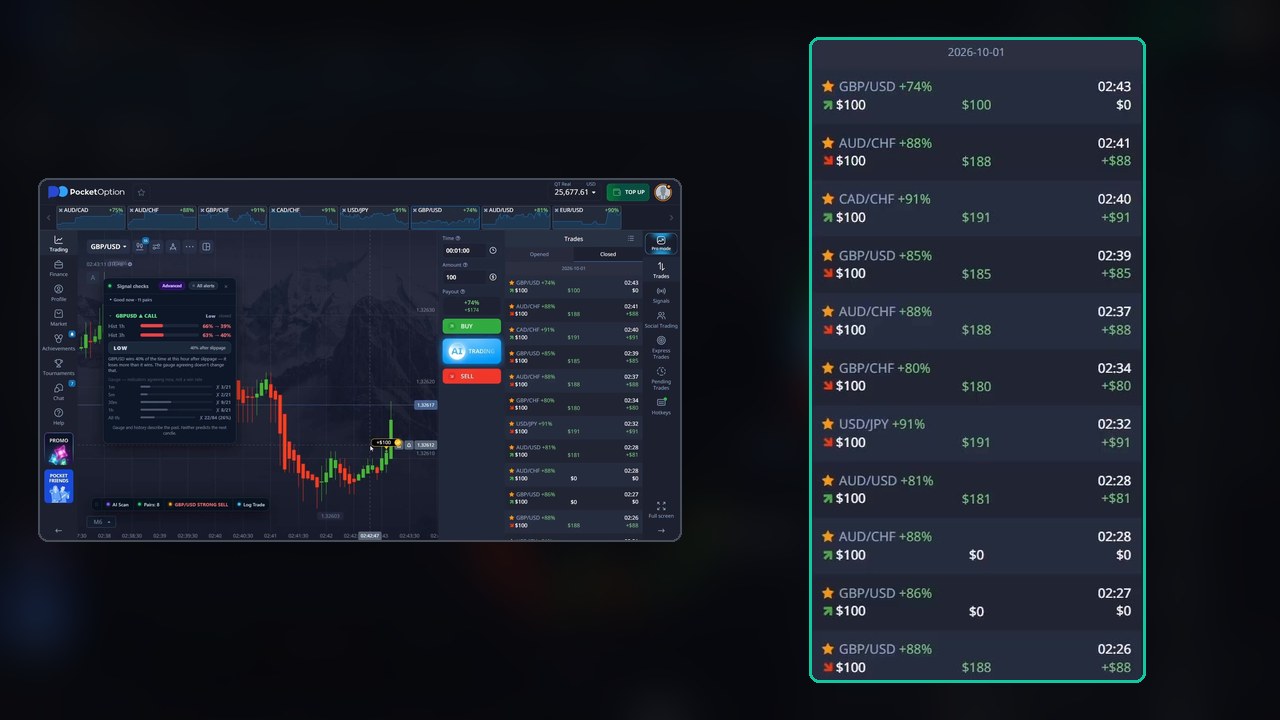
The balance checks out. Before the first trade the account shows $25,013.61. At the end it shows $25,677.61, a gain of $664. The 14 rows add up to exactly that: ten wins worth +$864, two losses of −$100 each, and two draws that returned the stake. The mid-session balance also matches. After trade 4, with the $100 GBP/USD trade open, it reads $25,173.61.
Two notes on the record. The video skips ahead between some alerts (“we fast forward until the next alert”), so the waiting time is cut. The closed list also shows earlier trades from the same day, before 02:16, that are not part of this session and are not counted here.
The Wrong-Chart Mistake
At 02:26 an AUD/CHF CALL alert pops up, rated 54% after slippage, one of the better readings of the day. The chart on screen, though, is still GBP/USD from the previous trade, and the first click opens a $100 call on GBP/USD. The trader notices, switches to AUD/CHF and takes the call there too.
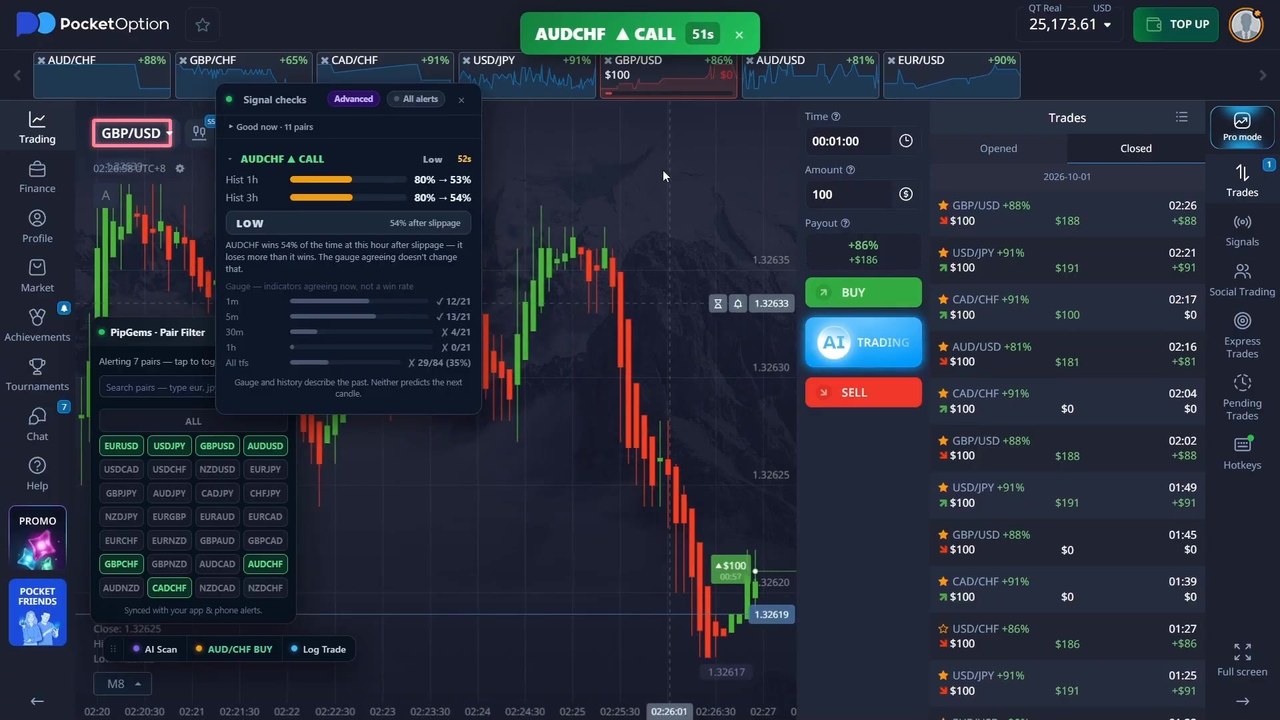
Both trades closed red: −$200 on one alert. These are the session’s only two losses. The GBP/USD call was never a signal at all. It was the right direction on the wrong pair, and that is a different trade entirely.
The fix is simple and it is the line the video repeats most: check the pair on your chart before every click. If the alert names a different pair from the one on screen, switch first and confirm the symbol, then decide. Do not open a second trade to “fix” the first one. That only doubles the stake on one idea.
Video Chapters
- 0:00 Live PipGems signal trades: the results
- 0:13 PipGems Live Signals page (wins and losses)
- 0:30 How to install the PipGems Signal Companion extension
- 0:47 Log in and open the PipGems windows
- 1:05 Gauge, extension settings and Signal checks
- 1:47 Pair Filter: real currency pairs only (no OTC)
- 2:06 Advanced view, All alerts and the 1-minute setup
- 2:59 Live trades 1–4: AUD/USD, CAD/CHF, USD/JPY, GBP/USD
- 6:05 The wrong-chart mistake (trades 5–7)
- 7:34 Live trades 8–14: reversal entries
- 12:17 Results: 10 wins, 2 losses, 2 draws
Watch the Video
Twelve and a half minutes, covering the full setup and every trade:
Limits to Keep in Mind
- 14 trades is a demonstration, not a record. Payouts here ran from 74% to 91%. At around 85% you need to win roughly 54% of decided trades just to break even, and 14 trades cannot show whether the method clears that over time.
- The panel’s own verdict was LOW. This session went well while trading against that verdict. The history numbers exist to warn you, and one good run does not prove they can be ignored.
- Fading a move can fail in a trend. “Price shot up, so we go down” works until a strong trend keeps going. The rule has no trend filter.
- Payouts change. GBP/USD paid 88% early on and 74% by the last trade. A lower payout raises the win rate you need, so check it before you click.
- Draws are not wins. Two trades closed exactly at the entry price and simply returned the stake.
Risk Management
- Keep the stake flat. Every trade here is $100, with no doubling after a loss.
- Set a daily target and a stop-loss before you start, and stop when you reach either one. Do not chase losses.
- Check the pair before every click. One wrong-chart click cost $200 in this session.
- Practise on the Pocket Option demo account first, and log your own trades before you risk real money.
- Binary options are restricted or banned for retail traders in some countries, so check the rules where you live, and only trade money you can afford to lose.
Frequently Asked Questions
What does “after slippage” mean in the PipGems Signal Checks panel?
For each alert the panel shows two history figures for the last 1 hour and 3 hours: the raw rate and a lower rate after slippage. The verdict (LOW, FAIR and so on) uses the after-slippage number. On the first AUD/USD put, 58% and 59% raw became 23% and 26% after slippage, so the panel rated it LOW.
Why were LOW signals traded at all?
The trader used the history as context and traded the live chart. A put was taken only after price had shot up, and a call only after a hard drop. The panel itself says history and gauge describe the past and do not predict the next candle, so 14 trades are not proof that LOW alerts are worth taking.
Which pairs were used, and why no OTC?
Only real currency pairs added in the pair filter: EUR/USD, USD/JPY, GBP/USD, AUD/USD, USD/CAD, GBP/CHF, AUD/CHF and CAD/CHF. PipGems follows the real forex market, so OTC pairs (which run on the broker's own price feed) are skipped.
What was the wrong-chart mistake?
An AUD/CHF call alert came in while the GBP/USD chart was still open, and the first click opened a $100 call on GBP/USD. The trader then switched to AUD/CHF and took the call there as well. Both trades lost, so the mistake doubled the exposure on one alert.
What was the result of the session?
14 one-minute trades at a flat $100: 10 wins, 2 losses and 2 draws. The balance went from $25,013.61 to $25,677.61, a gain of $664, which matches the sum of the 14 results in the closed-trades list exactly.
Do the PipGems signal alerts cost anything?
Yes. The video states that signal alerts need an active PipGems Pro subscription. The Signal Companion extension itself installs from the browser store, and you log in with your PipGems account.
The Verdict
4 out of 5. The setup is clear and complete, the pair filter keeps the session on real pairs, and every one of the 14 results checks out against the closed-trades list and the balance, to the cent. The video is also honest about its own mistake. It loses a point because the sample is small and the trading went against the panel’s LOW verdict almost every time. That worked here, but no one should assume it will keep working.
The useful lesson is how to use the Signal Checks card. Let the alert give you the timing, and let a stretched move on the chart give you the reason. Treat the history number as a warning, not a promise, and confirm the pair before you click.
#PipGems #PocketOption #TradingSignals #1MinuteStrategy #ReversalTrading #BinaryOptions
This content is for educational purposes only and is not financial advice. Trading involves substantial risk; you can lose some or all of your capital. No result is guaranteed and past results do not indicate future outcomes. Always practise responsible money management, limit your daily trades, and trade only what you can afford to lose.
Related reading: the pair filter, gauge and history check session uses the older 30-day history view, and the payout filter post explains why the payout percentage decides whether a pair is worth trading. For a longer record, see the 12-minute session with every entry logged. For more, browse the Pocket Option hub or the full strategy library. For the opposite approach, where low-rated alerts are skipped on mobile, see skip the low-rated PipGems signals.