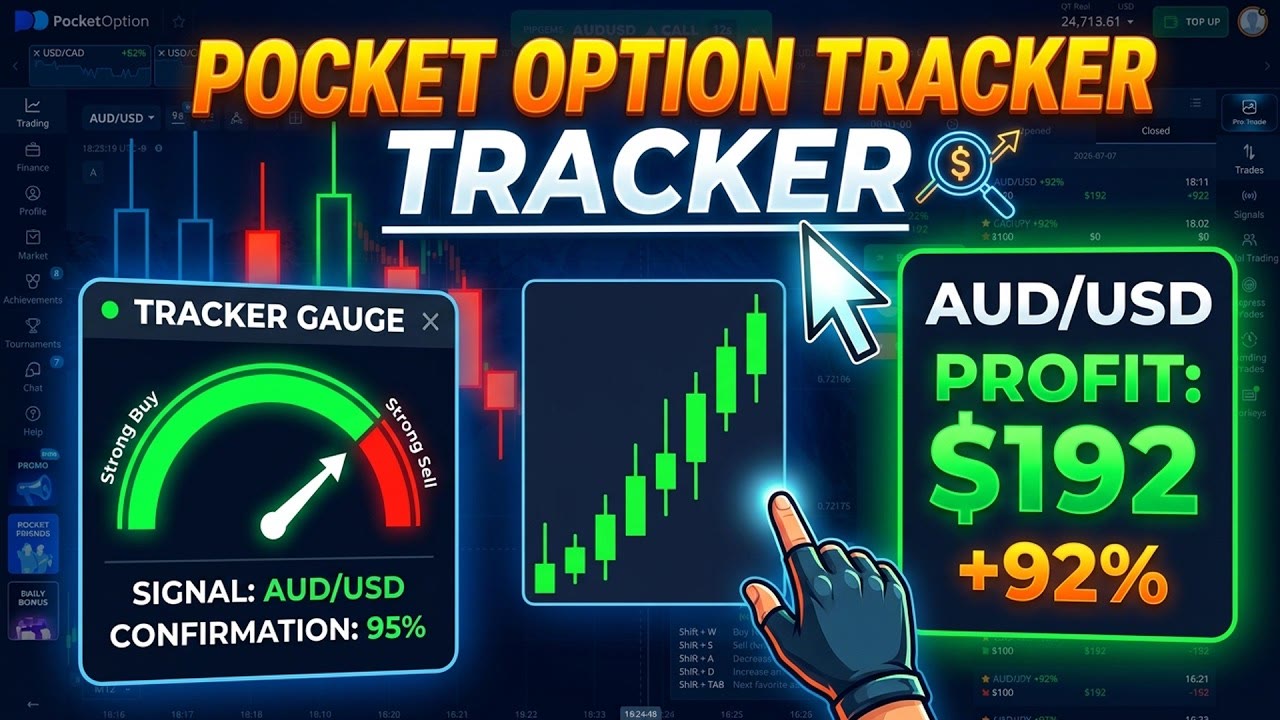
A put alert arrives for GBP/USD. The chart looks fine, the signal looks fine, and taking it would still be a mistake — because that particular GBP/USD was paying 57%, and the one sitting directly above it in the same list was paying 92%.
That is the whole lesson of this session, and it is a better one than most strategy videos deliver. The setup does not change. The pair does not change. What changes is the price the broker is quoting, and it moves the bar for success further than any indicator setting will.
The two GBP/USDs
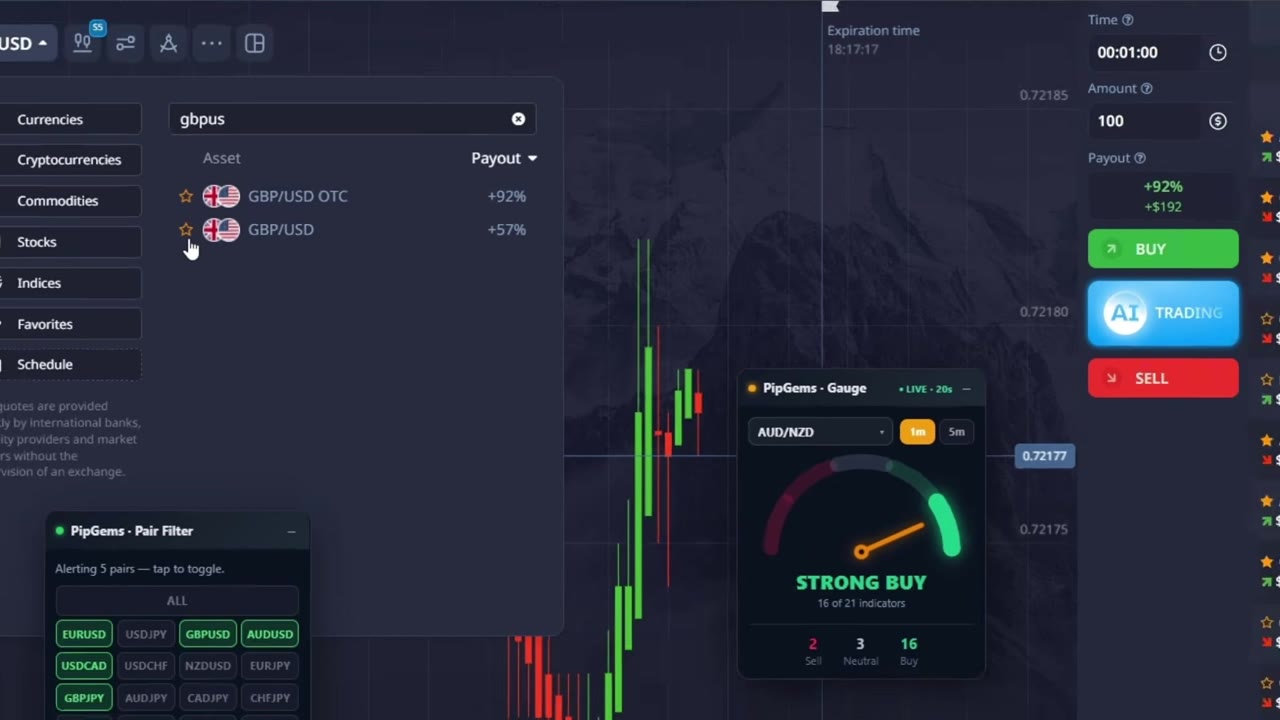
Search gbpus in the Pocket Option asset list and two rows come back. Same three letters, same three letters again, and a payout column that reads +92% on one and +57% on the other.
Most traders read that column as a detail. It is closer to the main event. Here is why.
What a payout actually costs you
A binary trade pays you the payout percentage when you are right and takes the whole stake when you are wrong. So the accuracy you need just to finish level is not a matter of opinion — it falls straight out of the number in that column:
| Payout on the pair | Win rate needed to break even | Seen in this session on |
|---|---|---|
| 92% | 52.1% | GBP/USD OTC, AUD/USD, CAD/JPY, GBP/AUD |
| 91% | 52.4% | USD/JPY |
| 88% | 53.2% | CAD/JPY (later in the session) |
| 75% | 57.1% | USD/CAD |
| 57% | 63.7% | GBP/USD (non-OTC) |
| 35% | 74.1% | CAD/CHF |
Read the two ends of that table against each other. On the 92% pair you can be wrong nearly half the time and still be level. On the 35% pair you have to be right three times in four. No indicator setting, no timeframe change and no signal app closes a gap that size. Choosing the pair does.
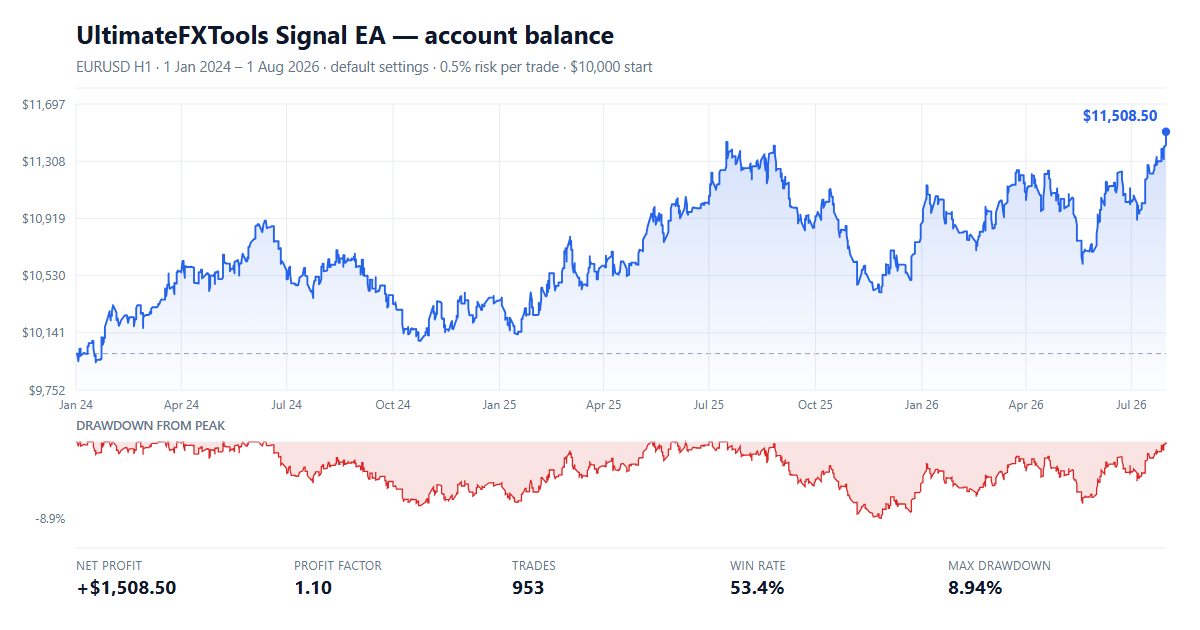
This is the same arithmetic we worked through in the ADX trend filter backtest, where seven strategies were run twice over 953 trades and the losing months were published next to the winning ones.
Building the filter
The fix in the video takes about thirty seconds. Clear the chart, reset the pair filter, then add pairs back by payout rather than by name — the Payout column in the asset search sorts, so the good ones come to the top on their own.
One detail worth catching: Pocket Option refreshes its available pairs roughly every five minutes. A list you built at the start of a session is a list that has already aged. The pair paying 92% an hour ago is not guaranteed to be paying it now, which makes the filter something you re-check rather than set once.
The gauge, and the number that matters
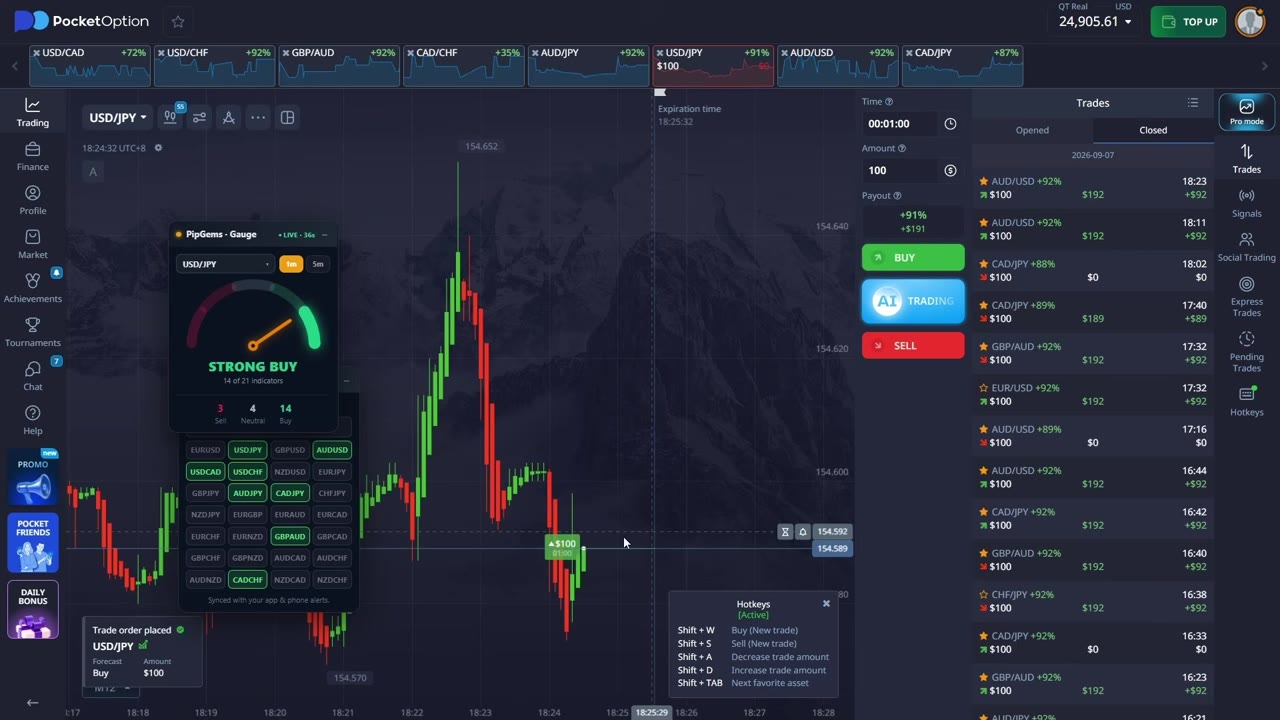
Alongside the signals, the session runs the PipGems gauge, which reduces 21 indicator readings to one dial. The threshold stated on camera is the useful part:
- Act on a STRONG reading, not a plain buy or sell.
- Or, at minimum, 18 of the 21 indicators agreeing.
- 17 is described as a bit short — and that honesty is worth more than the rule itself.
One caution we would add. Agreement is a headcount, not a probability. Eighteen indicators pointing the same way mostly tells you that eighteen indicators are reading the same recent price action, because that is what indicators are built from. It is a useful filter for avoiding genuinely unclear moments. It is not a forecast, and we would not treat the count as one.
What the trade history actually shows
The Pocket Option Closed panel sits on the right of the screen for most of the recording, which means the results are not a claim — they are visible. Among the settled trades on screen, three came back at $0: CAD/JPY at 88%, AUD/USD at 89%, and CAD/JPY at 92%. The rest returned around $92 on a $100 stake.
The account balance moves in both directions across the session too. It reads 24,813 at one point, 24,905 a few minutes later, and 24,896 later still.
We are pointing this out rather than skipping past it, because a session with visible losses in it is more useful than one edited to hide them. Losses at these payouts are not a malfunction. At a 92% payout you are expected to lose roughly half of the time and still come out ahead — that is precisely what the break-even table above describes.
The one thing we would not copy
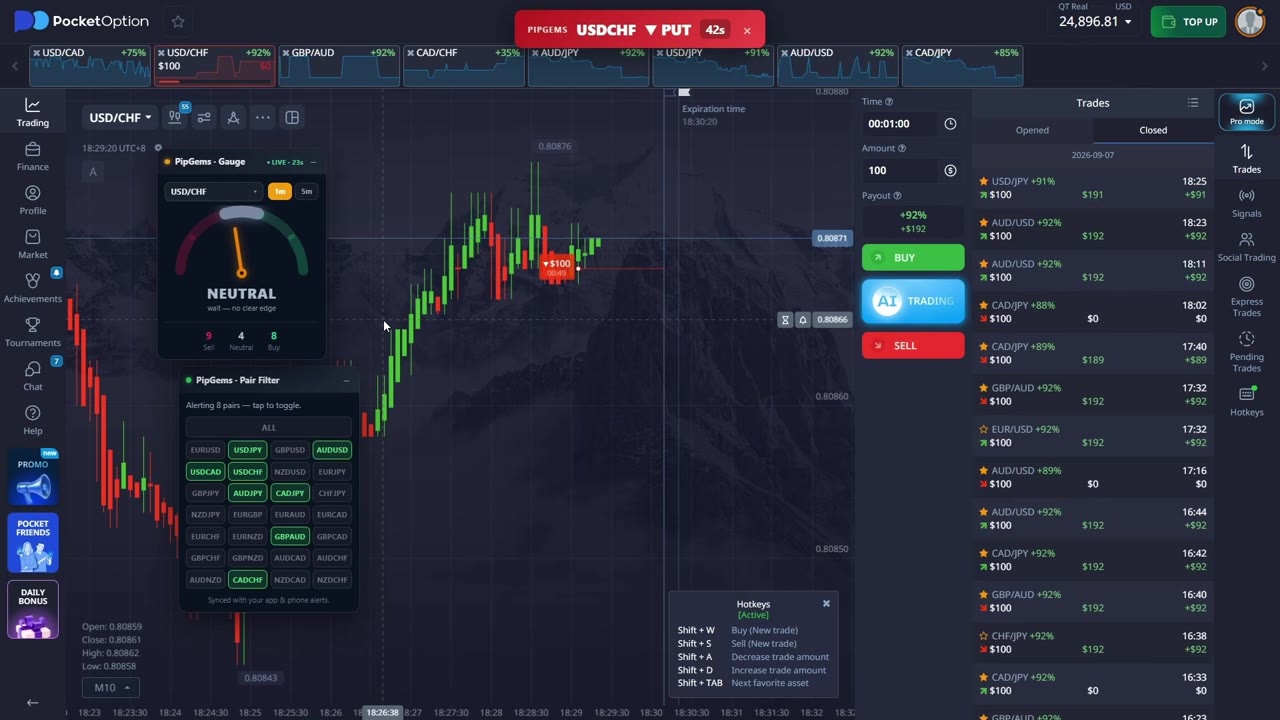
Late in the session a USD/CHF put alert arrives. The gauge reads NEUTRAL, with the caption wait — no clear edge printed underneath it. The trade is taken anyway, on the stated basis of trusting the signals.
That is the moment to pause on. If you have added a confirmation tool to your screen, the occasions it disagrees with you are the only occasions it is doing any work. A filter you honour when it agrees and override when it does not has been switched off without being removed.
There is a defensible version of this: decide in advance that the gauge governs one class of trades and not another, and write the rule down. What is not defensible is deciding per-trade, in the moment, based on how much you want the trade.
How we would run this
- Set a payout floor and hold it. A single number — say 85% — below which the signal simply does not get taken, no matter how good the chart looks.
- Rebuild the pair list every few minutes. The payouts move. A stale list quietly reintroduces the pairs you filtered out.
- Pick one expiry and keep it. The session uses a fixed 1 minute so that trades resolve before the next batch of alerts lands, rather than leaving several open at once on pairs that move together.
- Write the gauge rule down before the session, not during it. Strong-only, or 18 of 21 — then honour it on the trades you dislike as well as the ones you like.
- Demo it first. Long enough to see a losing run, because that is the part that tells you whether you can actually run the plan.
Why 4 and not 5
The payout lesson is genuinely valuable and it is demonstrated rather than asserted — two rows in a list, two numbers, one obvious decision. The gauge threshold is stated with a real figure instead of a vague "wait for confirmation", and the trade history is left on screen with the losses in it. That is more transparency than this category usually offers.
What holds it back from a 5 is the neutral-gauge override described above, and that the session is a demonstration rather than a tested method — a run of trades on one afternoon, with no record of how the same filter behaves across a week of different conditions. Take the payout discipline. Test the rest yourself.
The session
PipGems is our own signal app, so treat this as what it is: our tool, in our video. The payout arithmetic above is broker maths and holds regardless of which signals you use. Trading carries substantial risk and you can lose your capital; nothing here guarantees a result and past performance does not predict future performance. Test on a demo account first.