The problem it solves
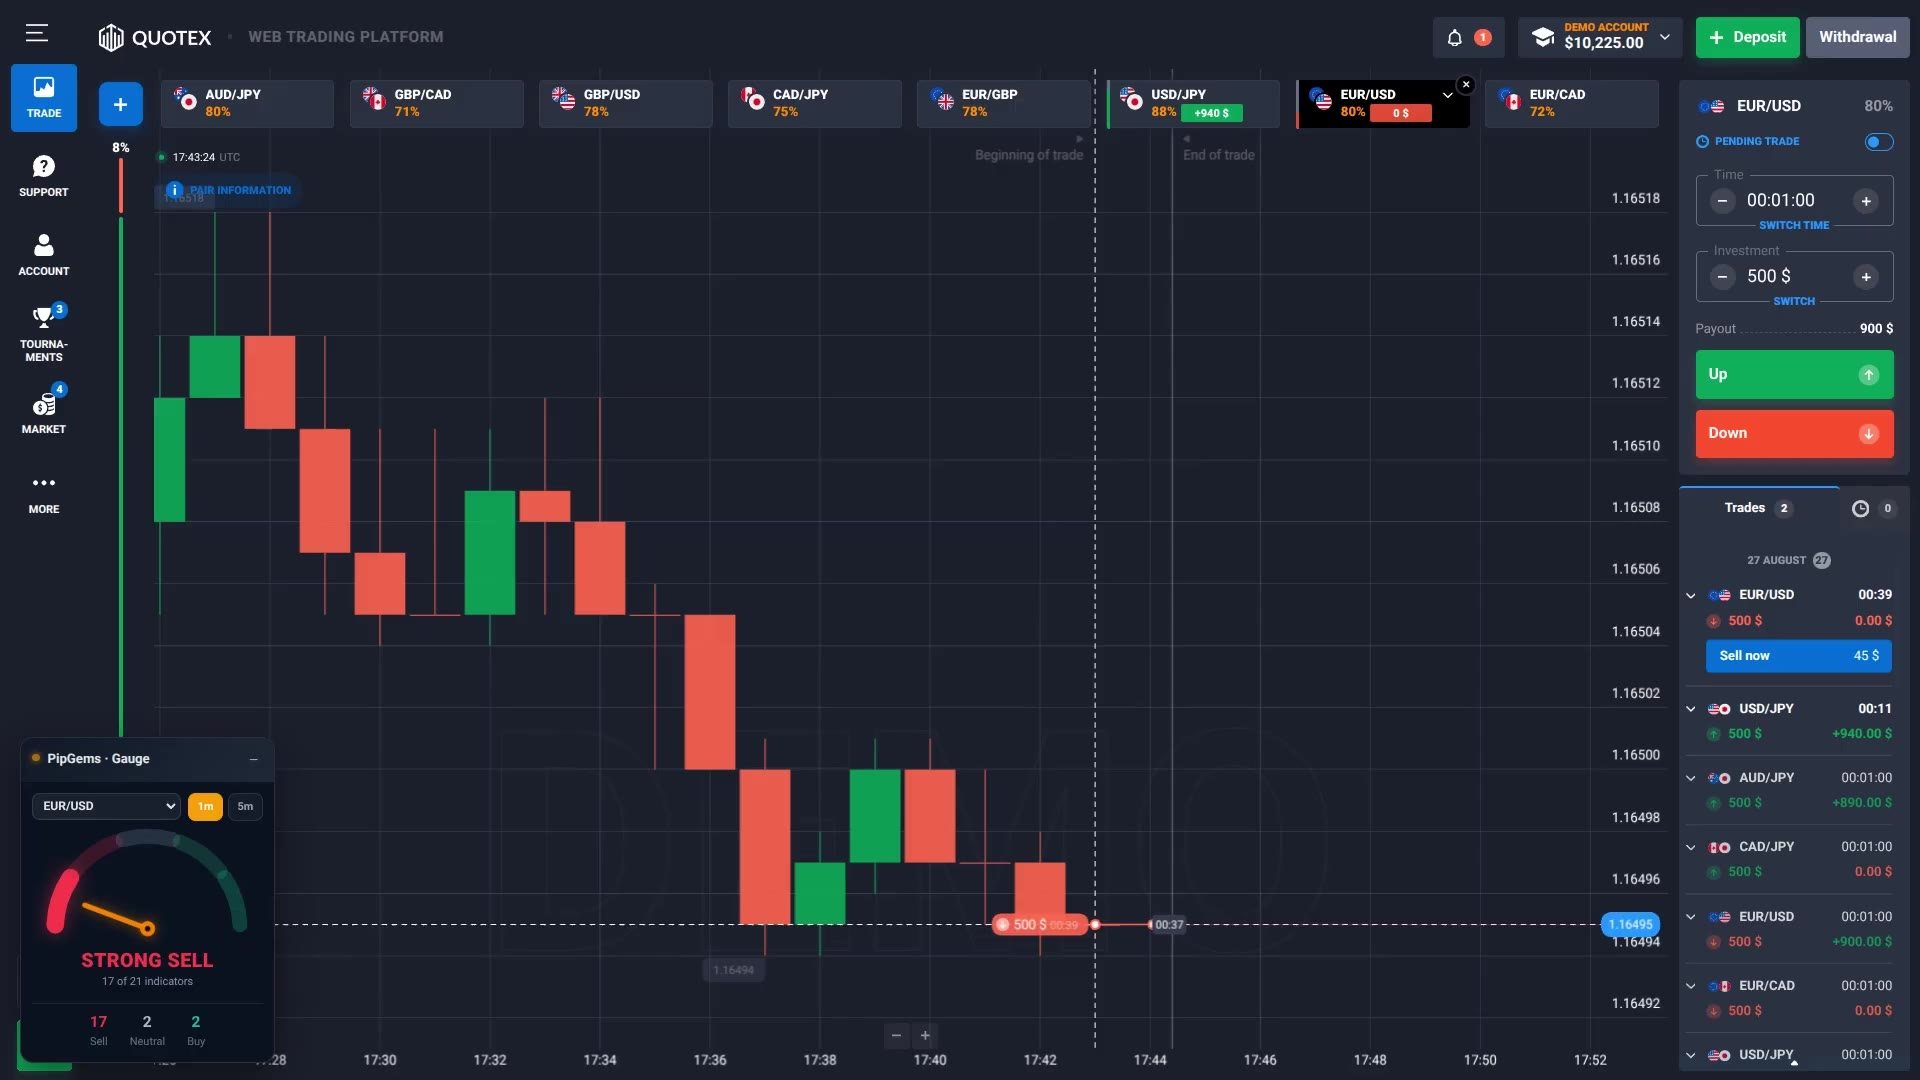
On a 1-minute expiry you have seconds to decide. Nobody opens twenty-one indicator windows in that time, so in practice most traders check two or three and hope those were the right ones. The Gauge inverts that: it reads all twenty-one continuously and shows you the result of the count, in a panel that floats over the Quotex page so you never leave the chart.
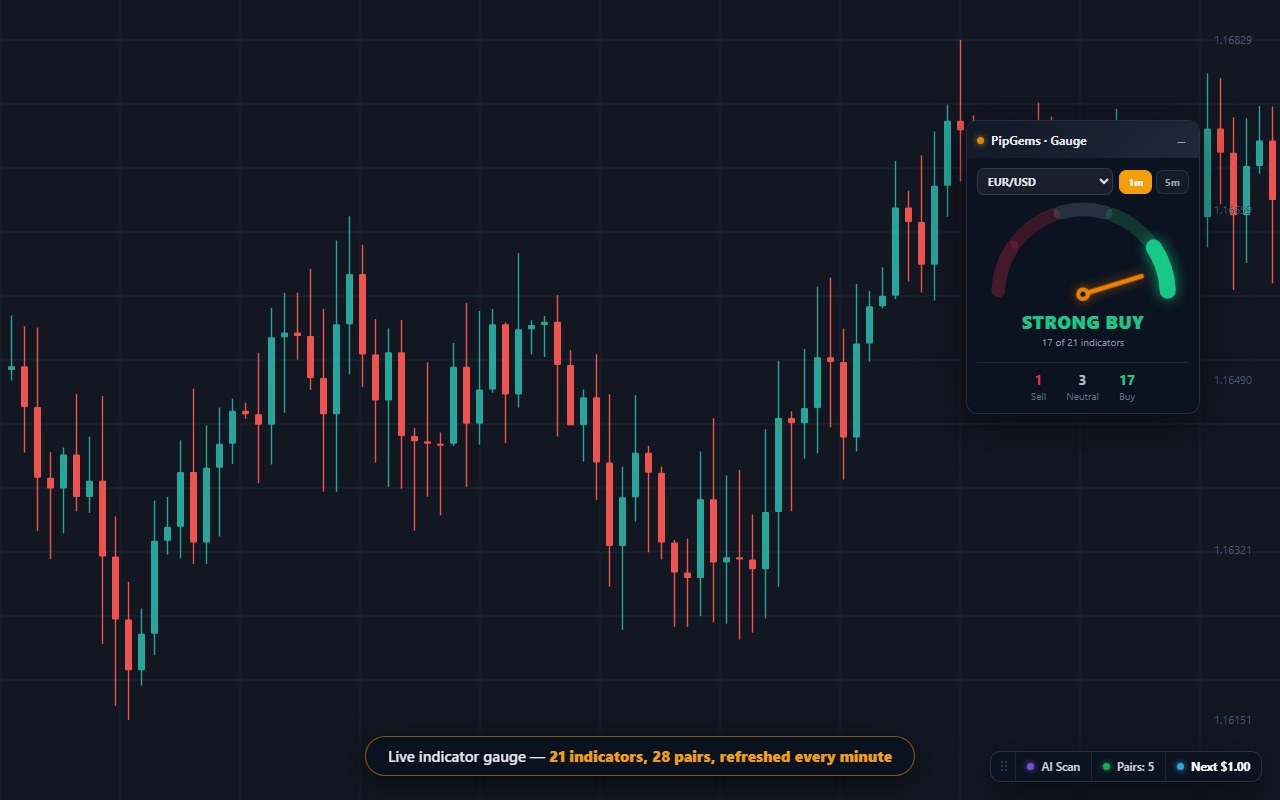
Everything on it is one glance: the pair selector, a 1m / 5m switch, the needle, the verdict, and — the part that actually matters — the three columns underneath: Sell, Neutral, Buy. It covers 28 currency pairs and refreshes the reading every minute, so switching pairs in the dropdown is faster than switching charts.
How to read the gauge properly
The verdict word is the least useful thing on the panel. The three counts are the information, because they tell you what kind of agreement you are looking at:
| 17 / 3 / 1 | Strongly one-sided. Almost everything agrees and very little is undecided — the reading in the video's buy setups. |
|---|---|
| 17 Sell / 2 / 2 | The same strength in the other direction. The gauge is symmetric; a strong sell is not a weaker signal than a strong buy. |
| High Neutral count | The market is not split — it is asleep. Most indicators have no opinion, which usually means no movement worth a 1-minute trade. |
| Roughly even Buy and Sell | Genuine disagreement. This is the one to stand aside for; a coin-flip entry still pays the payout gap. |
A count is not a probability. “17 of 21” means seventeen indicators currently read bullish. It does not mean 17 of the last 21 trades won, and it is not an 81% chance of anything. Read it as how one-sided the market is right now — which is genuinely useful, and is all it claims.
The honest limit of any consensus number
Twenty-one indicators are not twenty-one independent opinions. Several of them are built on the same underlying maths — moving-average tools with different names agree with each other by construction, not by confirmation. So a big count can be one idea repeated rather than twenty-one voices.
This is not a criticism unique to PipGems; it is true of every consensus meter on every platform. We ran the same test on our own indicator library and found that seven of thirty products were the identical calculation under a different name — which is why the scanner in our Signals app collapses duplicates and reports 24 independent readings rather than 31 indicators. The practical takeaway for the Gauge is the same: treat a jump from 12 to 17 as meaningful, and treat the absolute number as a mood, not a measurement.
The 1m and 5m switch is the underused feature
The toggle re-reads the same twenty-one indicators on a different candle interval. The 1-minute read reacts fast and flips often; the 5-minute read is slower and steadier. They disagree regularly, and that disagreement is the most actionable thing on the panel:
- Both agree — the market is one-sided across two horizons. This is the reading worth acting on.
- They conflict — the fast move is running against the slower context. Usually a reason to wait rather than to pick a side.
- 5m strong, 1m neutral — a trend is in place but currently pausing. Fine for a pullback entry, awkward for a 1-minute expiry.
What the session actually did
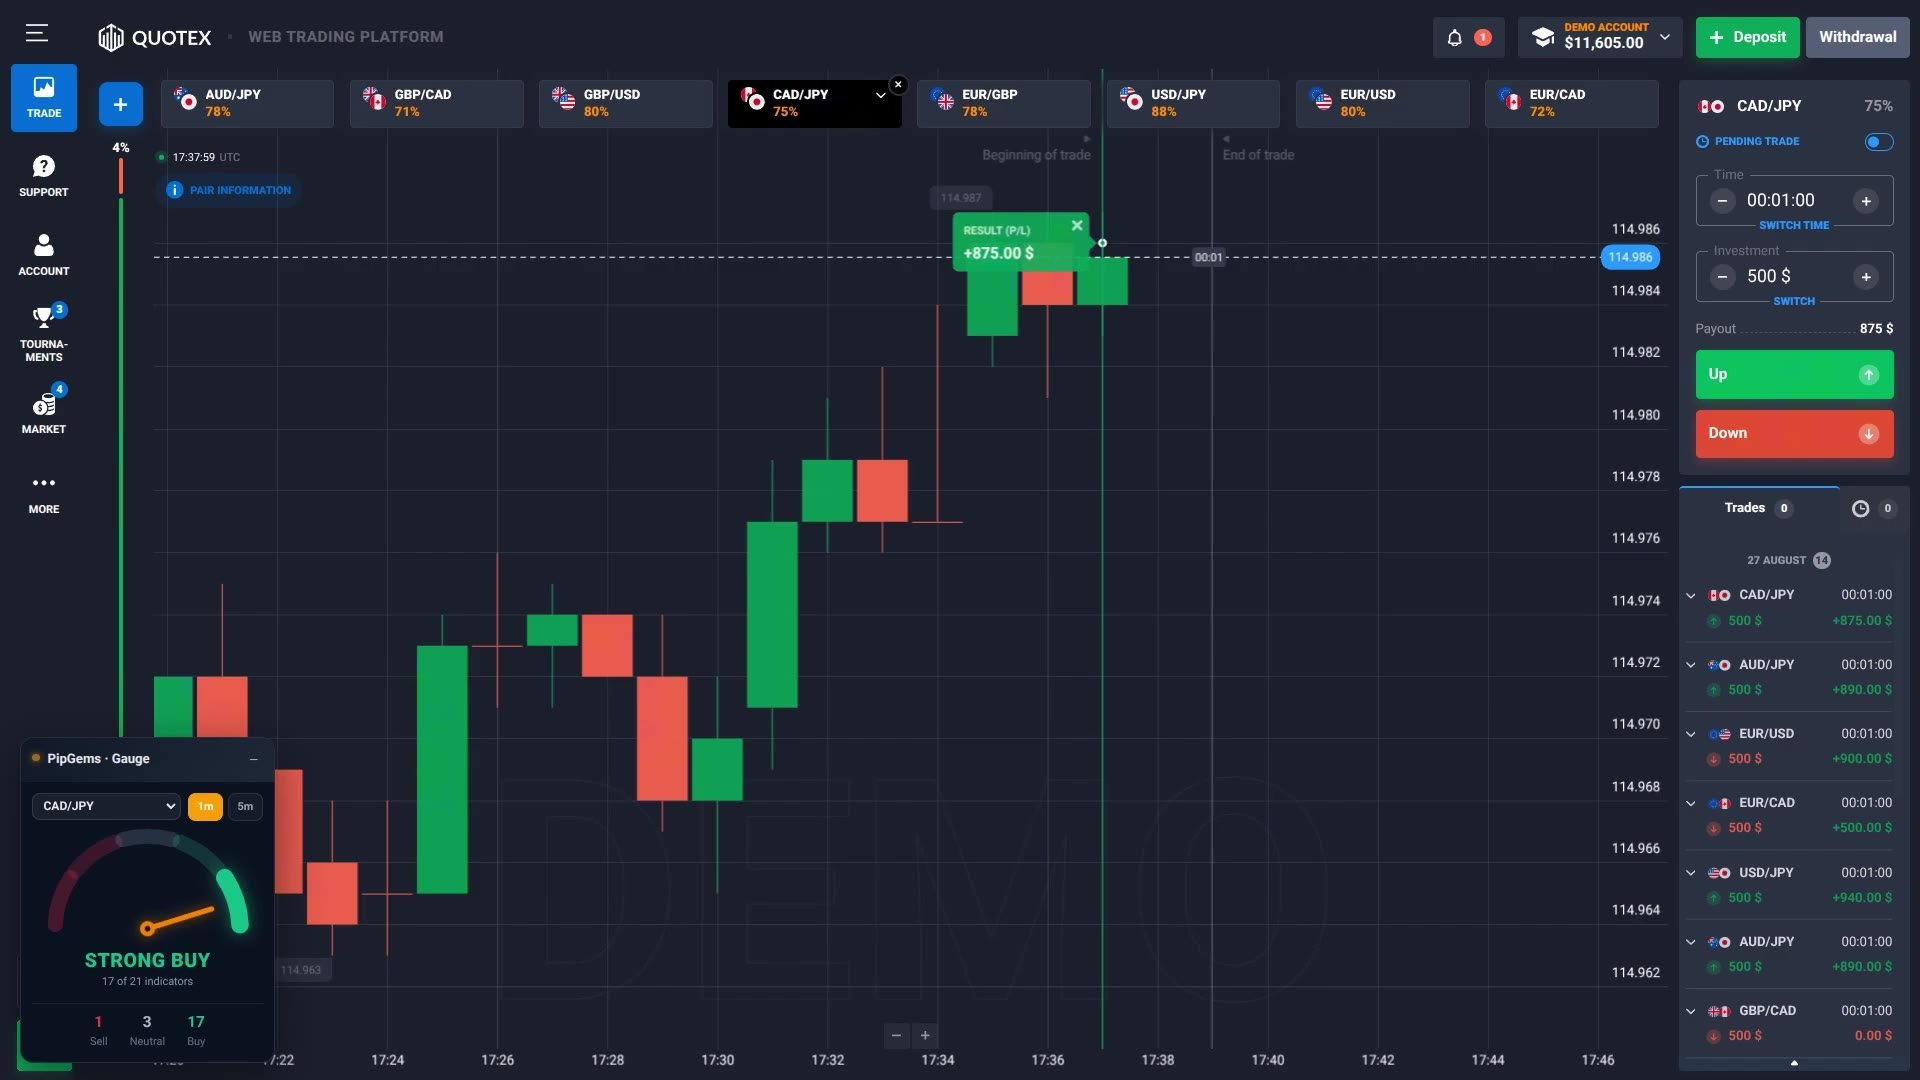
Demo account, flat $500 stakes, 1-minute expiries, payouts between 71% and 88% depending on the pair. Reading the balance across the recording:
| Start | $7,500 |
|---|---|
| Peak before the dip | $10,495 |
| Dip | $9,435 — a drawdown of over $1,000 mid-session |
| End of recording | $11,165 |
So it finishes up, but not in a straight line, and the trade panel shows the reason: several 0.00 entries — full losses of the $500 stake — sitting between the +890 and +940 wins. That is what a real session looks like, and it is the part worth studying. Note also that this is a demo account: no slippage, no withdrawal, and no emotional cost to a losing streak.
The payout maths nobody mentions
Break-even is 1 ÷ (1 + payout), and the pairs in this session ranged from 71% to 88%:
| Payout | Break-even win rate | Pairs in the session |
|---|---|---|
| 88% | 53.2% | USD/JPY |
| 80% | 55.6% | GBP/USD, EUR/USD |
| 78% | 56.2% | AUD/JPY, EUR/GBP |
| 75% | 57.1% | CAD/JPY |
| 71% | 58.5% | GBP/CAD |
Taking the same gauge reading on GBP/CAD instead of USD/JPY adds more than five percentage points to the win rate you need. The gauge does not know that — pair selection stays your job, and on a strong reading it is free edge to take the trade on the better-paying pair.
It ships with the Signal Companion
The Gauge is not a separate install. It is one of the panels inside the PipGems Signal Companion browser extension, alongside the live signal feed, the AI chart scanner, a pair filter synced with your phone alerts, and a one-tap trade logger — all floating over the broker chart, each panel collapsible and movable on its own.
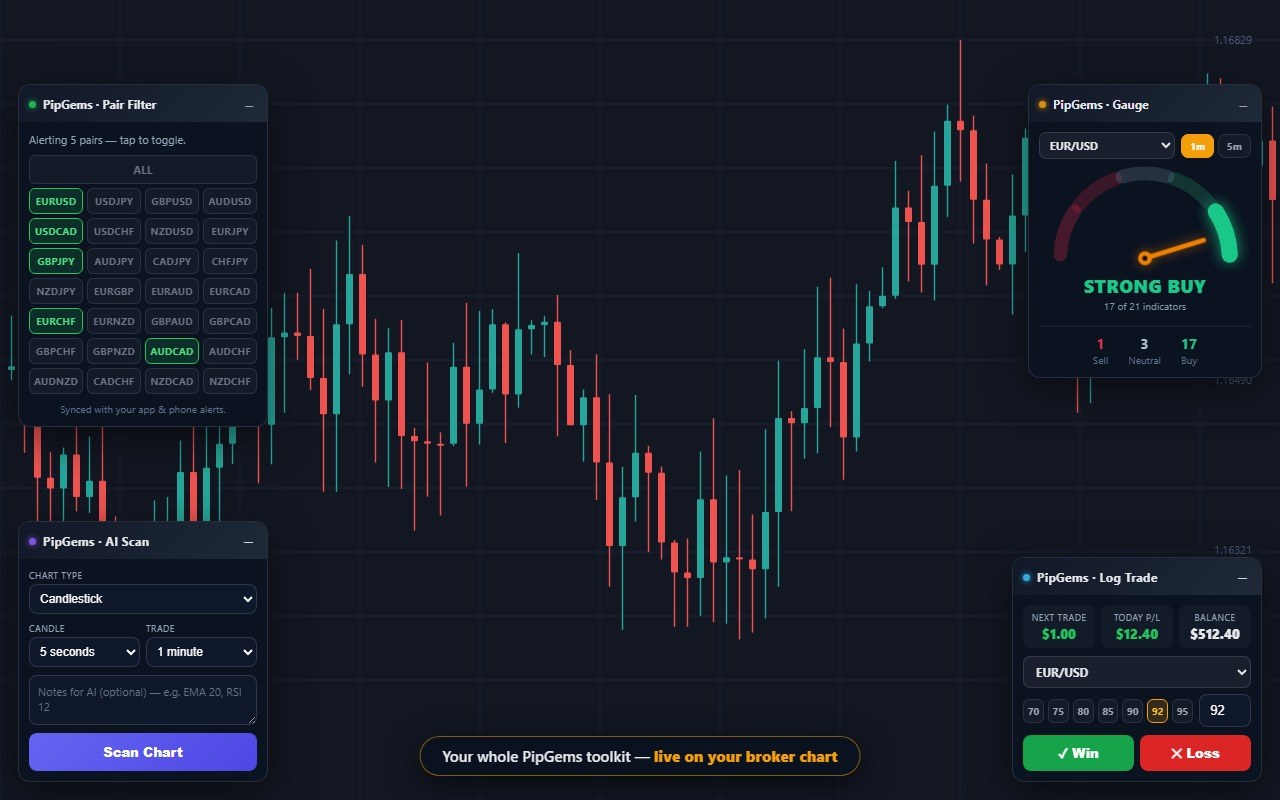
That matters for how you use the Gauge: the reading tells you how one-sided the market is, the AI scan gives a second opinion on the specific chart in front of you, and the logger keeps the honest record of what you actually did with both.
Our rating: 4 out of 5
4 out of 5. What earns it: it solves a real problem — no one checks twenty-one indicators in the seconds before a 1-minute entry — and it shows the tally rather than only a verdict, which lets you tell a one-sided market from a sleeping one. The 1m/5m switch adds a second horizon for free, and the panel never makes you leave the chart.
What holds it back from 5: the indicators are not independent, so the headline number overstates how much confirmation there really is; there is no published record of how readings have performed; and nothing on the panel accounts for the payout, which on this platform moves the break-even by five points between pairs. Use it as a fast read of market agreement, not as a signal to follow blindly.
Frequently asked questions
What does 17 of 21 indicators actually mean?
It is a headcount, not a probability. The gauge polls 21 technical indicators on the selected pair and timeframe, asks each whether it currently reads bullish, bearish or neutral, and prints the tally — for example 17 Buy, 3 Neutral, 1 Sell. A high count means most of the indicators agree right now. It does not mean 17 of the last 21 trades won, and it is not a forecast.
Is a 21-indicator consensus better than one indicator?
Sometimes, but not simply because 21 is bigger than one. Indicators are not independent — several tools built on the same maths agree with each other by construction, so a large count can be one idea repeated rather than twenty-one separate opinions. The count is most useful as a fast way to see whether a market is one-sided or genuinely split, which is exactly what the Neutral column tells you.
What is the difference between the 1m and 5m gauge readings?
The toggle re-reads the same 21 indicators on a different candle interval. A 1-minute reading reacts fast and flips often; a 5-minute reading is slower and steadier. They frequently disagree, and that disagreement is information: when both point the same way the market is one-sided across two horizons, and when they conflict it is usually a sign to wait rather than to pick one.
Did the session in the video only win?
No. The demo balance runs from $7,500 to $11,165 across the recording, but not in a straight line — it reaches $10,495 and then falls to $9,435, a drawdown of over $1,000, before recovering. The trade panel also shows several 0.00 results, which are full losses of the $500 stake, sitting alongside the +890 and +940 wins. It is a demo account and a single short session.
What win rate does a 1-minute Quotex trade need to break even?
It depends entirely on the payout, which varied between 71% and 88% across the pairs here. Break-even is 1 divided by 1 plus the payout: about 53.2% at 88%, 56.2% at 78%, and 58.5% at 71%. That last figure is the one worth remembering — taking the same reading on a 71% pair instead of an 88% pair adds more than five percentage points to the win rate you need.
Where to go next
The Gauge is part of PipGems, which also carries the AI chart scanner and the signal companion overlay. If you would rather see the same consensus idea with its duplicates removed and its record published, the UltimateFXTools Signals app runs a scanner across every market at once and shows a server-scored bot leaderboard — including when those bots are losing.
Risk note. This content is for educational purposes only. Trading involves risk. Past results do not guarantee future outcomes. Always practice responsible money management — limit the number of trades you take in a day, keep stakes small relative to your balance, and never trade money you cannot afford to lose. The session shown ran on a demo account over a few minutes and is not a projection of future results.