“Trade with the trend” is the most repeated advice in trading. Almost nobody tests it.
Every course says it. Filter your entries by trend, stay out of the chop, only trade in the direction of the bigger move. It sounds so obviously right that it is almost never checked — and when it is, you are usually shown one strategy, with the filter already on, and no idea what the same strategy did without it.
That is a one-variable experiment, and it is easy to run properly. So we ran it seven times: the same Expert Advisor, seven different indicator engines driving its entries, each one tested twice — once taking every arrow, once allowed to take an arrow only while ADX said the market was trending.
Everything else was held still. Same pair, same 2.5 years, same 0.5% risk, same stops, same spread. The only thing that changes between two columns of the table below is whether the filter was allowed to veto the trade.
How the test was set up
The EA used is our own, and that matters for one boring but important reason: it can swap its signal source without changing anything else. Seven engines, one code path, one risk model, one order handler. If the results differ, the difference is the signal or the filter — not two different programs written by two different people.
- Market and timeframe: EUR/USD, H1
- Period: 1 January 2024 → 1 August 2026 (about 2.5 years)
- Tester model: MT5 Strategy Tester, 1-minute OHLC
- Risk: 0.5% of balance per trade, position size derived from the stop distance
- Exits: ATR stop, ATR target, ATR trailing stop
- Starting balance: $10,000
- The filter: ADX(14). “Trending only” means an entry is simply refused while ADX sits below its trend level. Nothing else about the trade changes.
- Account guards off: the daily-loss stop and the max-drawdown halt were disabled for this comparison. There is a whole section below on why that was not optional.
Why this test is even possible. Most “signal EAs” you can buy are bridges — the strategy lives on the seller's server and the EA just fills the orders it is sent. There is nothing local for the Strategy Tester to replay, so the seller's screenshots are the only evidence that exists. An EA that carries its logic locally can be re-run by anyone on their own broker, history and spread. That is the difference between a result and a claim.
The seven engines, with the filter off and on
Net profit in account currency on a $10,000 start, profit factor, and the largest balance drawdown reached during the run. Green is net positive, red is net negative. Nothing has been left out — every engine the EA can run is in this table.
| Signal engine | No filter — net | PF | Max DD | Trending only — net | PF | Max DD | Verdict |
|---|---|---|---|---|---|---|---|
| Stochastic + ADX | +332.66 | 1.02 | 15.9% | +1,508.50 | 1.10 | 8.94% | Filter helped a lot |
| RSI + Bollinger | −338.84 | 0.98 | 14.9% | +208.46 | 1.02 | 14.7% | Flipped positive |
| ROC + Parabolic SAR | −1,351.54 | 0.89 | 18.2% | +240.28 | 1.04 | 7.40% | Flipped positive |
| Keltner × SuperTrend | −1,314.36 | 0.86 | 20.4% | −1,153.48 | 0.82 | 14.9% | Still losing |
| EMA + MACD | −1,545.40 | 0.82 | 19.8% | −1,281.04 | 0.72 | 15.1% | Still losing |
| CCI + EMA | −2,313.77 | 0.86 | 26.0% | −1,540.46 | 0.83 | 17.9% | Still losing |
| Heikin Ashi + EMA | −1,804.24 | 0.89 | 18.3% | −2,344.12 | 0.76 | 24.1% | Filter made it worse |
What the filter is actually doing
A trend filter does not make a strategy smarter. It removes trades. Whether that helps depends entirely on where the losses were sitting.
For Stochastic + ADX, ROC + SAR and RSI + Bollinger, the losses were concentrated in flat conditions — oscillator crossings fire constantly in a range and most of those crossings go nowhere. Cut the ranging trades out and you cut most of the damage. That is why ROC + SAR moved 1,591 points of net result and why its drawdown fell from 18.2% to 7.40%.
For the others, the losses were not concentrated anywhere in particular. Filtering them just produced a smaller version of the same loss: Keltner × SuperTrend improved by 161 and stayed firmly negative. And Heikin Ashi + EMA got worse — it lost 540 more with the filter than without it, and its drawdown rose from 18.3% to 24.1%. For that engine, ADX was removing the trades that were paying for the others.
The useful conclusion is not “use an ADX filter.” It is that a filter is a hypothesis about where your losses live, and it has to be tested against your own strategy rather than assumed. On this data it was the difference between a losing system and a modest one for three engines, and actively harmful for a fourth.
The one configuration worth keeping
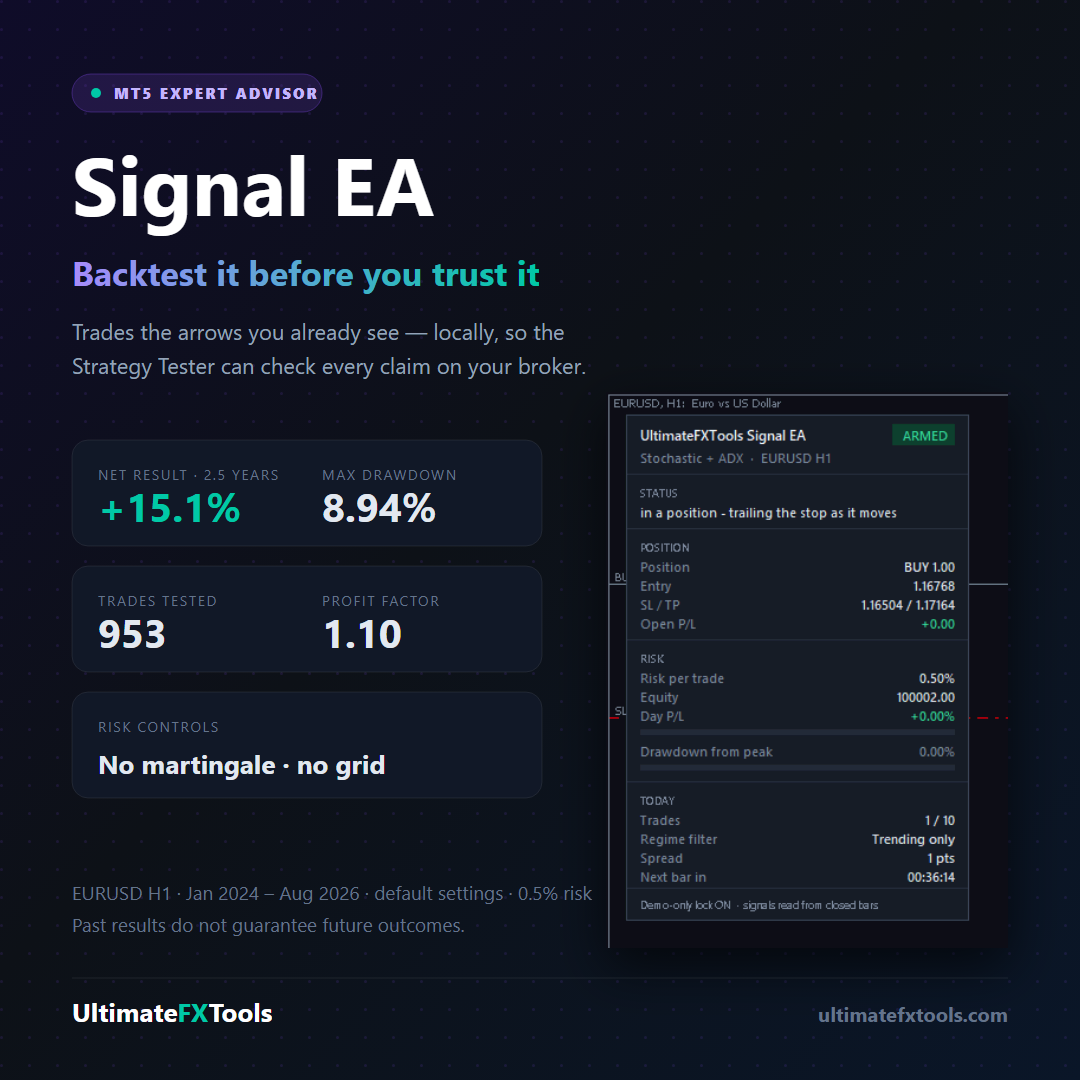
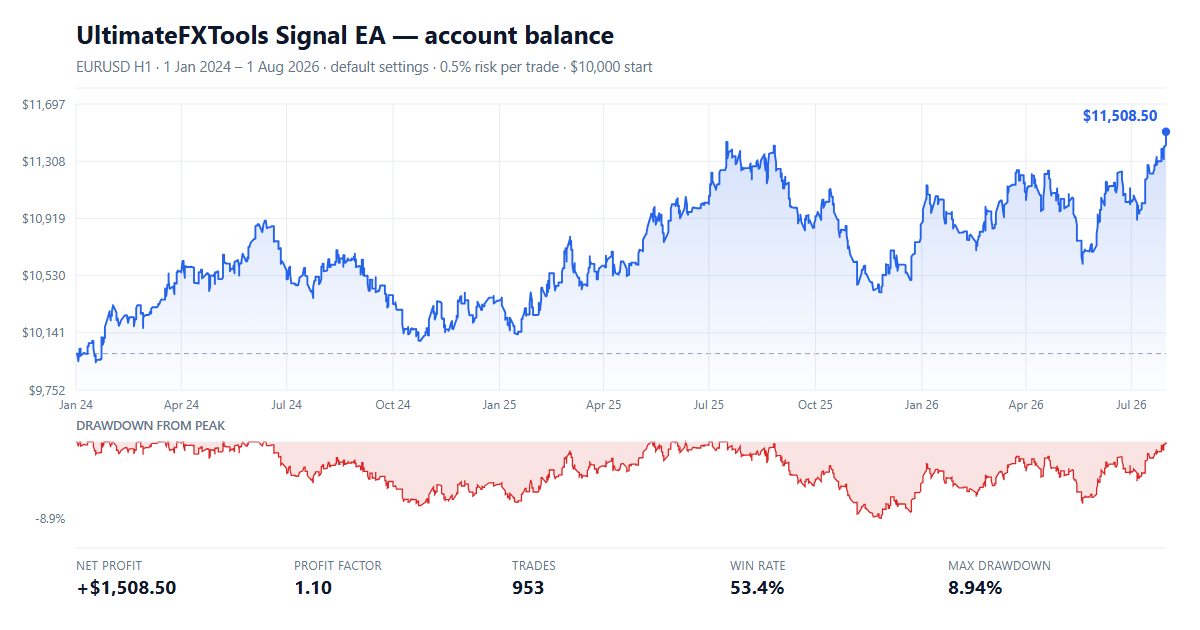
Stochastic + ADX with the trending-only filter was the best result in the table, and it is what the EA ships with as its default. Here is the whole run, with nothing rounded in its favour:
| Net result | +1,508.50 on a $10,000 start — about +15.1% across 2.5 years |
|---|---|
| Profit factor | 1.10 |
| Trades | 953 |
| Win rate | 53.4% |
| Max balance drawdown | 8.94% |
| Sharpe ratio | 0.96 |
| Recovery factor | 1.39 |
| Expected payoff | 1.58 per trade |
| Worst losing streak | 8 trades in a row, −295.70 |
+15.1% over two and a half years is roughly 5.7% a year in a tester, before slippage, before commission on a real account, and before the trader does anything human to it. That is a modest number and we are not going to dress it up. A profit factor of 1.10 means that for every 1.00 lost, 1.10 was won — a thin margin that a wider spread or a worse fill can eat.
What makes it worth publishing is not the size. It is that the drawdown stayed under 9% across 953 trades, that no guard had to fire to keep it there, and that anyone can re-run it and get the same numbers.
Nearly half the months were losers
This is the part that equity curves hide. Broken down month by month, 15 of the 31 months finished negative. The curve above is not a staircase — it is a long grind with a visible slide through late 2025 and another through early 2026.
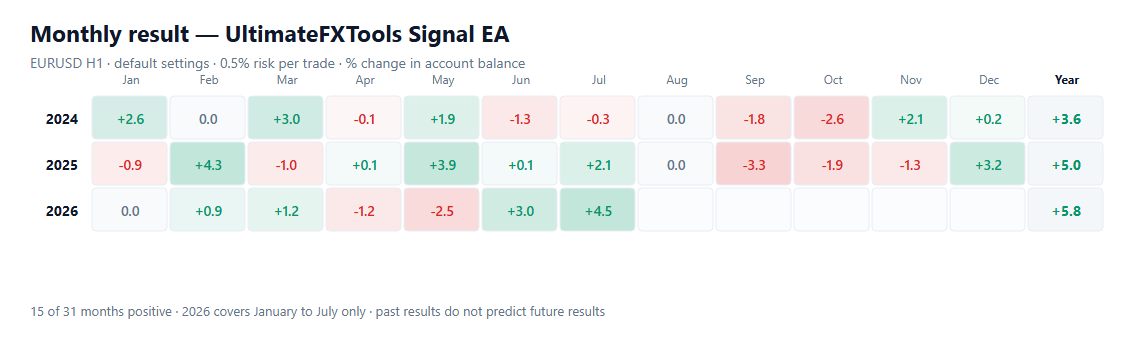
Combine that with the worst losing streak — eight trades in a row for −295.70 — and you have the real risk of running any mechanical system: not that the maths stops working, but that a human switches it off in the middle of a normal losing run and never sees the recovery. If a red month would make you change the settings, the settings are not the problem.
The trailing stop was doing more work than expected
One extra test worth reporting, because the result was not what we assumed. Turning the ATR trailing stop off on the same engine, filter open, took the run from +332.66 to −36.00 — and the win rate fell from about 51% to 40%.
That is a large effect for a component people often treat as optional polish. On this strategy the trailing stop is not protecting profit at the end of a move; it is closing trades that would otherwise have run back through the entry. It stays on.
Two tester traps that nearly invalidated the whole thing
Both of these produced confident, completely wrong results before they were caught. If you run your own tests in MT5, they are worth more than the table above.
1. A max-drawdown halt measured from peak equity kills long backtests
The EA has a guard that stops trading permanently past a set drawdown, and it was shipping at 10%. Drawdown is measured from peak equity, and the peak ratchets upward — so a perfectly normal pullback after a good run trips it. In the first sweep, all seven engines halted permanently during 2024. Even the profitable one stopped on 23 December 2024, about a year into a 2.5-year test, and everything after that was a flat line.
The results looked plausible. They were measuring the guard, not the strategy. Set the drawdown halt to zero for any backtest you intend to read, and re-enable it afterwards for live use.
2. The Strategy Tester silently overrides your recompiled defaults
After changing three defaults in the source and recompiling cleanly, a verification run reported the old input values and reproduced the old result byte for byte — while the log confirmed the new compiled file had been loaded.
The cause is MQL5\Profiles\Tester\<Expert>.set. The tester caches the last input set you used and applies it over the compiled defaults; a [TesterInputs] block in an ini file only overrides the keys you actually list, and everything else comes from that cached file. Delete or rename the .set file before any run meant to prove what the compiled defaults do — and then confirm it by reading the Inp...= lines the tester prints at the start of each pass instead of trusting that it worked.
Reproduce it yourself
None of this is meant to be taken on trust. The EA runs locally, so the test is repeatable on your own terminal:
- Attach the EA in the MT5 Strategy Tester on EURUSD, H1, 1-minute OHLC model, 1 Jan 2024 → 1 Aug 2026, $10,000 start.
- Set the max-drawdown guard and the daily-loss stop to 0 so the full period actually runs.
- Run once with the regime filter set to any, then again set to trending only. Change nothing else.
- Repeat for each signal engine to rebuild the table.
- Your numbers will not match ours exactly — your broker's spread and history are not ours. The direction of the effect is what should reproduce.
What this does not prove
Stating the limits is not modesty, it is the difference between a test and an advert:
- One pair, one timeframe, one window. EUR/USD H1 across a particular 2.5 years. Another pair, another period, or another broker's spread can move all of these numbers.
- The filter was never tuned. ADX(14) at its default trend level. Tuning that level on the same data used to judge it is exactly how a backtest starts flattering itself, so it was left alone.
- Defaults everywhere else too. Stop and target multipliers, session hours and the ADX level are all untested levers. A better configuration almost certainly exists; so do many worse ones.
- The MT4 build is a separate question. The same strategy ported to MT4 has so far only been run over roughly three months of history — 96 trades, +91.78, profit factor 1.05. That proves the port executes correctly. It is nowhere near enough to sit beside 953 trades, and the two are deliberately not mixed.
- A backtest is a record of the past on one data set. It is not a forecast and not an expected return.
Our rating: 4.5 out of 5
4.5 out of 5 — and the rating is for the method, not for the size of the result. What earns it: only one variable moves between the two columns; every engine is published, including the four that lost; the guard that would have distorted the run was found and disabled rather than left to flatter the numbers; the losing months and the worst losing streak are shown next to the equity curve; and the whole thing is reproducible on your own terminal instead of being a screenshot.
What holds it back from 5: it is a single pair on a single timeframe over a single window, with no out-of-sample period held back. Until the same comparison runs on other pairs and other periods, the honest description of this result is “consistent on the data we tested” — not “proven.”
Frequently asked questions
Does an ADX trend filter improve every strategy?
No. Across the seven strategies here it turned three from losing to positive and halved the drawdown of the best one, but it barely helped Keltner × SuperTrend and it made Heikin Ashi + EMA clearly worse — from −1,804 to −2,344. A filter does not add skill, it removes trades. That only helps if the losses it removes were concentrated in the conditions being filtered out.
What ADX level counts as trending?
This test used ADX with a period of 14 at its default trend level, and an entry was simply refused while ADX sat below it. The level itself was never tuned, on purpose — tuning the filter on the same data used to judge it is how a backtest starts flattering itself. Read the result as what the untuned default produced, not as the best obtainable setting.
Why did most of the seven strategies lose money?
Because they were traded completely mechanically on default settings, on one pair and one timeframe, with a real spread and a fixed risk model, and with nobody deciding to sit a session out. Six of seven were unprofitable with the filter off; four were still unprofitable with it on. That is the normal outcome for indicator arrows traded blind, and publishing it is the point — a study that only shows its winner is not a study.
Can a signal-service EA be backtested?
Usually not. Most are bridges: the strategy lives on the vendor's server and the EA only fills the orders it receives, so the Strategy Tester has nothing to replay and the vendor's own screenshots become the only evidence available. An EA that carries its logic locally can be run on your broker, your history and your spread — which is what makes a table like the one above possible at all.
Do these results apply to the MT4 version?
No, and they should not be reused that way. These 2.5-year figures came from the MT5 Strategy Tester. The MT4 build of the same strategy has so far only been run across roughly three months of history — 96 trades, +91.78, profit factor 1.05 — which proves the port executes correctly but is far too short to compare with 953 trades. The two sets of numbers are kept apart deliberately.
Where to go next
The EA that produced every number on this page is documented in full on its own page, including the settings it ships with and the same limitations listed above: the MT5 & MT4 Signal EA. It is part of the $39 lifetime library rather than a separate purchase.
If you would rather look at the same indicators without installing MetaTrader at all, the Signals web app (a month of it is included with the $39 package) runs them in the browser and includes a scanner that reads every indicator across every market at once — along with a server-scored leaderboard whose bots are currently below break-even, published for the same reason the four losing engines are in the table above.
Risk note. This content is for educational purposes only. Trading involves risk. Past results do not guarantee future outcomes. Always practice responsible money management — limit the number of trades you take in a day, keep the risk per trade small, and never trade money you cannot afford to lose. Every figure on this page is what one backtest produced on one data set, not a projection of what any account will do.