This post is sponsored by Perfect Indicators — the market seasonality dashboard whose data and backtest results are shown throughout. We were paid to feature it. Every figure below was pulled from its published methodology and is reproducible on the site; the unflattering numbers are quoted alongside the good ones, because a study that only reports its winners is not a study.
The Question Nobody Answers With Numbers
“Trade the London session.” “Avoid Fridays.” “The overlap is where the money is.” Trading is full of claims about when to trade, and almost none of them arrive with a sample size attached. So this study asked the blunt version instead: take every hour of the week as a mechanical rule — buy at the open of this hour, sell at its close, every time that hour occurs, for 23 years — charge it a realistic spread, and see what is left.
5,086 rules went in. Here is what came out.
hour & weekday×hour, 19 markets
after the spread was deducted
on held-back, unseen data
214 out of 5,086 is 4.2%. Put the other way: 95.8% of simple time-of-day rules do not survive a realistic spread and an honest out-of-sample test. That number is the single most useful thing in this article, and it is the number a leaderboard showing only its winners would quietly leave out.
Watch the Full Walkthrough (4 minutes)
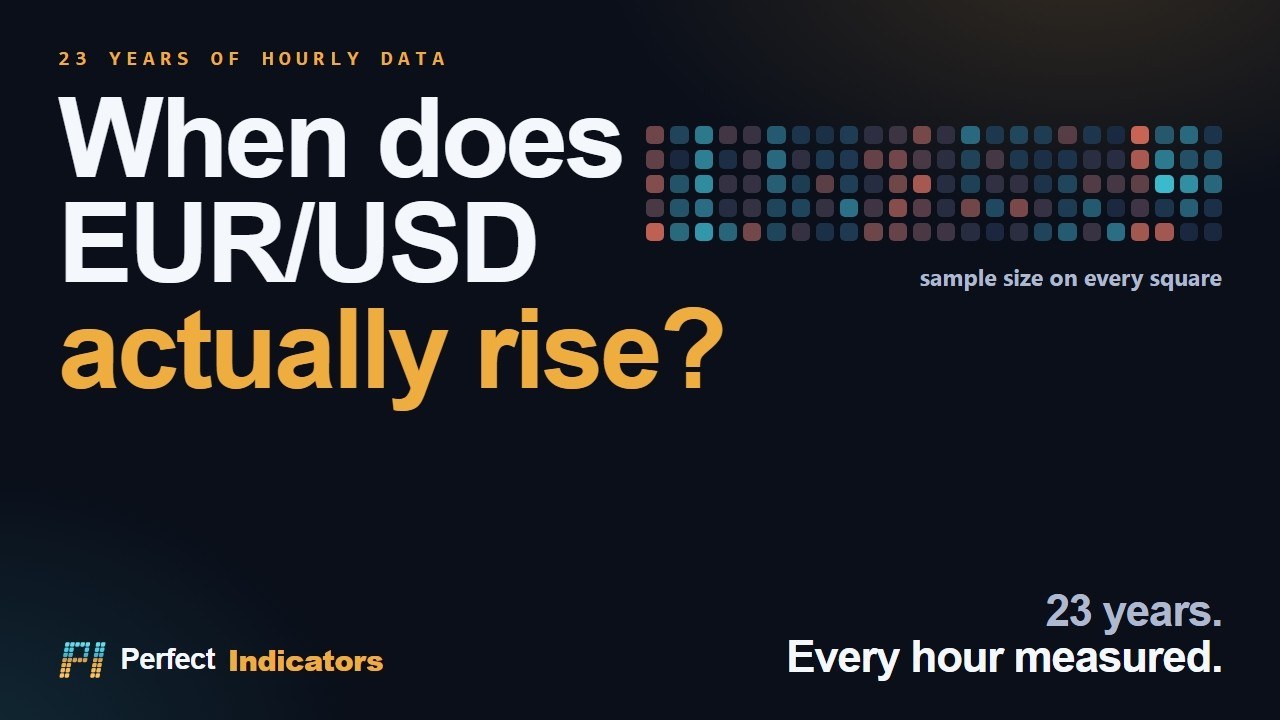
The dashboard, the heatmap, how a cell is read, and the strategy board where those 5,086 rules become 214 — the whole thing end to end:
- 0:00 The market keeps a schedule
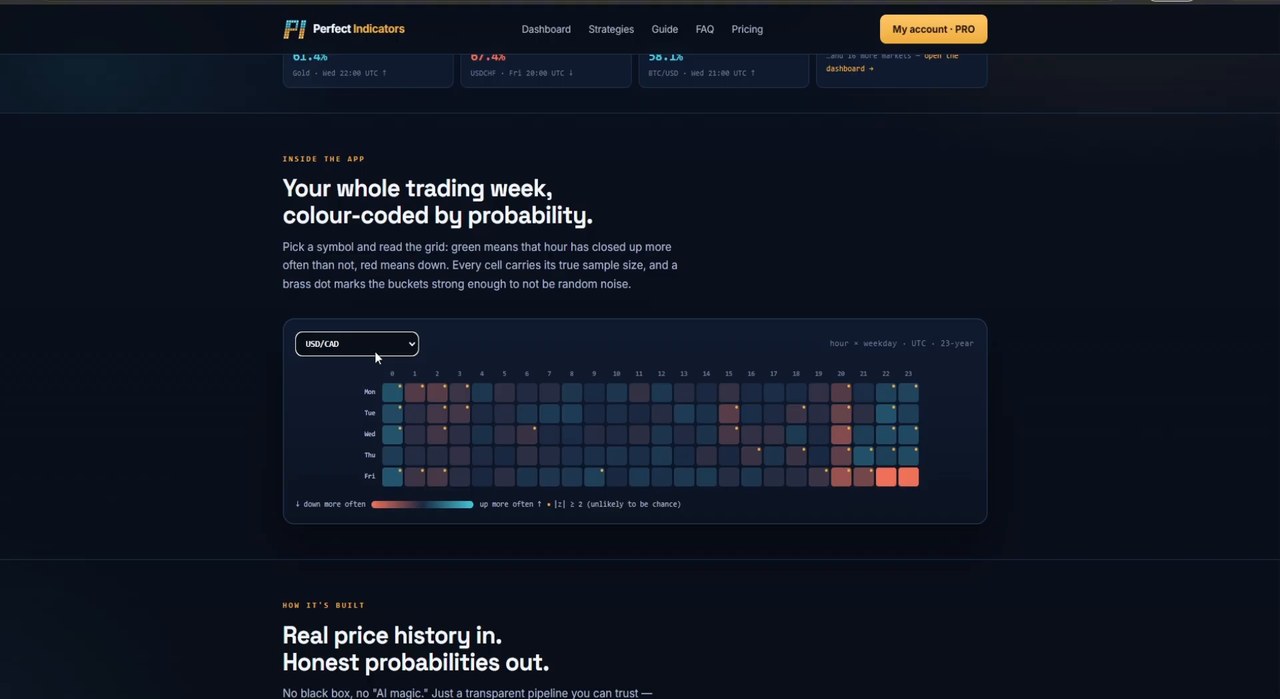
- 0:24 Your whole trading week, colour-coded by probability
- 1:00 Where the data comes from
- 1:14 The dashboard — this hour's odds, strongest hours, quietest sessions
- 2:22 How to read a cell without fooling yourself
- 3:16 We backtested every rule — most of them lose
- 3:38 Free embeddable widgets
- 4:00 Where to start
How Every Rule Was Tested
A backtest is only as honest as the assumptions printed next to it, so here they are in full — this is the methodology published on the strategy board itself:
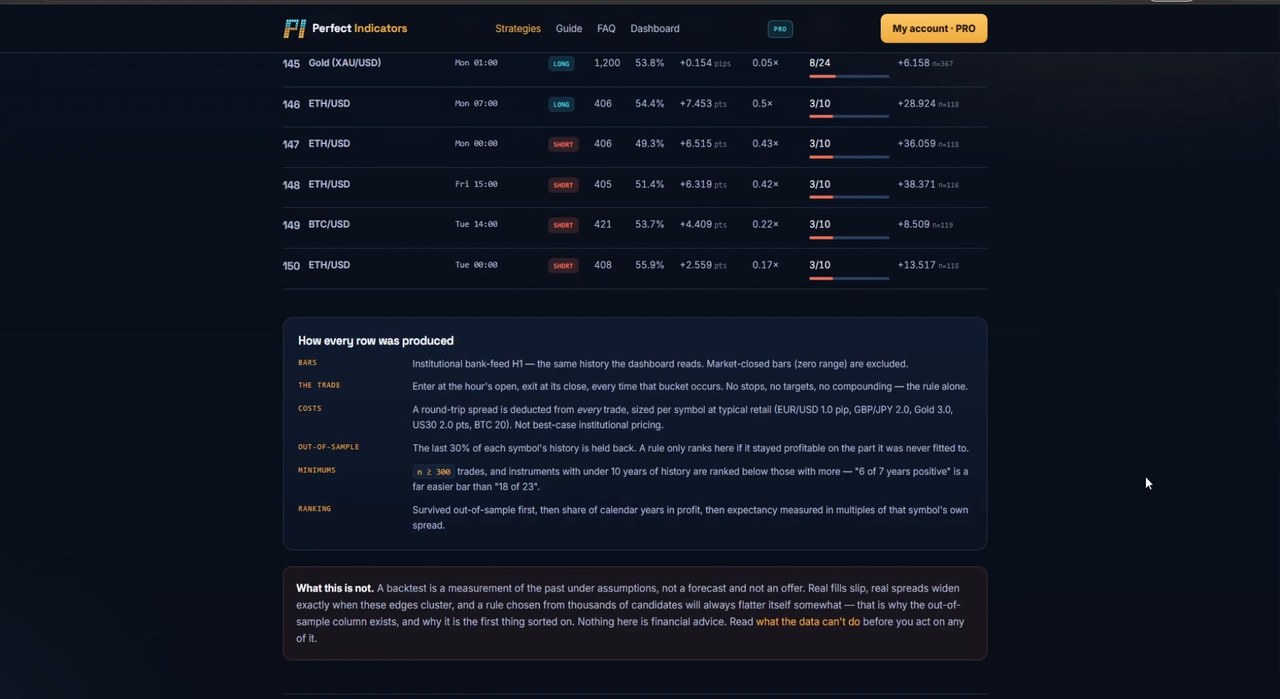
- Bars: institutional bank-feed H1 — the same history the dashboard reads. Market-closed bars (zero range) are excluded.
- The trade: enter at the hour's open, exit at its close, every time that bucket occurs. No stops, no targets, no compounding — the rule alone, with nowhere to hide.
- Costs: a round-trip spread is deducted from every trade, sized per symbol at typical retail — EUR/USD 1.0 pip, GBP/JPY 2.0, gold 3.0, US30 2.0 pts, BTC 20. Not best-case institutional pricing.
- Out-of-sample: the last 30% of each symbol's history is held back. A rule only ranks if it stayed profitable on the part it was never fitted to.
- Minimums: n ≥ 300 trades, and instruments with under 10 years of history rank below those with more — “6 of 7 years positive” is a far easier bar than “18 of 23”.
- Ranking: survived out-of-sample first, then share of calendar years in profit, then expectancy measured in multiples of that symbol's own spread.
Notice what that last line does. Ranking by expectancy in multiples of the spread rather than raw pips means a gold rule and a EUR/USD rule are compared on the only scale that matters to a retail account: how much bigger is the edge than the toll you pay to take it?
Why 96% Failed: the Number Nobody Looks At
The kill mechanism is not exotic. It is the spread, and this one statistic explains almost the entire failure rate:
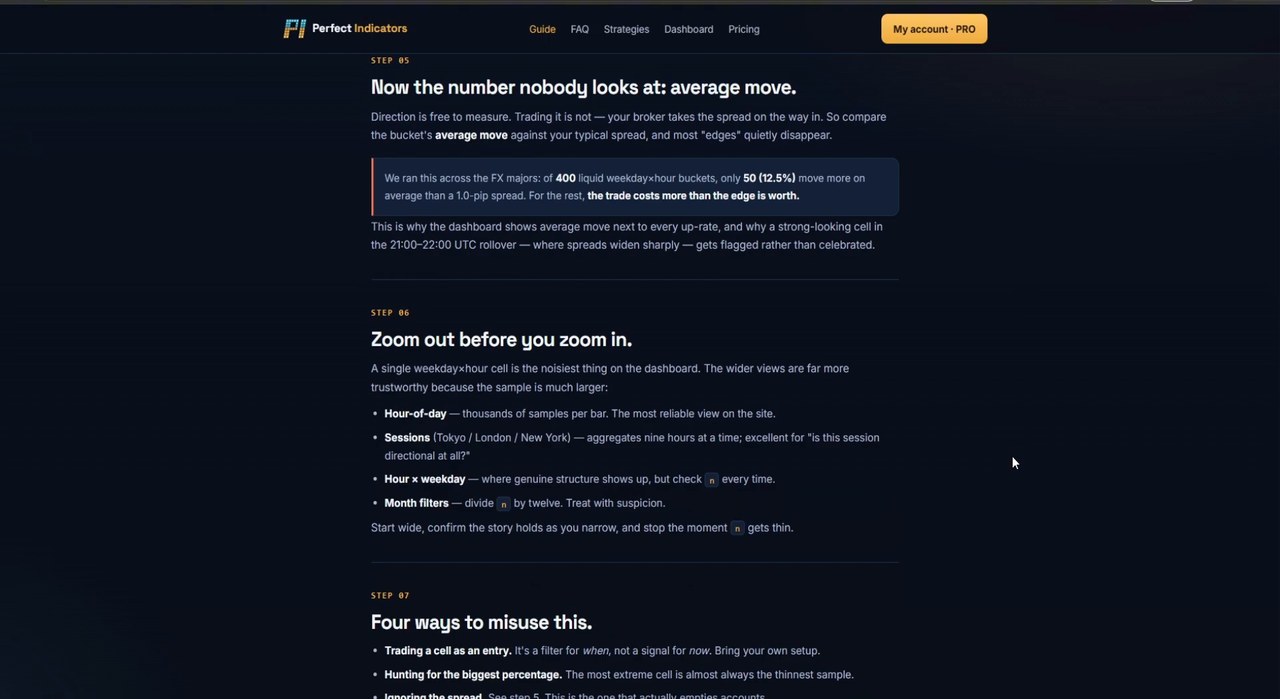
Across the FX majors, of 400 liquid weekday×hour buckets, only 50 — 12.5% — move more on average than a 1.0-pip spread. For the other 87.5%, the trade costs more than the edge is worth.
Read that next to a typical “this hour is 56% up!” claim and the trap becomes obvious. Direction is free to measure. Trading it is not. An hour can lean the right way with genuine statistical significance and still be a losing trade, because the average distance it travels is smaller than the toll charged at the door. This is also why the strongest-looking cells — the 21:00–22:00 UTC rollover, where spreads widen sharply — get flagged rather than celebrated.
The Survivors
Here is the top of the board — the free preview rows, every one of them still profitable on the held-out data. Net and OOS figures are expectancy in multiples of that symbol's own spread, per trade:
| Market | Bucket (UTC) | Side | Win rate | Trades | Net | Out-of-sample |
|---|---|---|---|---|---|---|
| USD/CHF | Friday 20:00 | SHORT | 66.8% | 642 | +1.498× | +1.484× |
| AUD/USD | Friday 21:00 | SHORT | 68.5% | 384 | +1.564× | +2.089× rollover |
| EUR/GBP | 20:00 Mon–Fri | SHORT | 66.4% | 2,425 | +0.131× | +0.246× |
| US30 (Dow) | Monday 13:00 | LONG | 53.7% | 574 | +6.506× | +9.407× |
| US30 (Dow) | Thursday 14:00 | LONG | 53.6% | 584 | +4.454× | +11.738× |
| US30 (Dow) | Monday 10:00 | LONG | 54.9% | 568 | +1.633× | +4.373× |
| USD/JPY | Friday 21:00 | SHORT | 62.8% | 309 | +0.656× | +2.068× rollover |
| GBP/USD | Friday 11:00 | SHORT | 53.5% | 1,040 | +0.394× | +0.228× |
| EUR/GBP | Thursday 20:00 | SHORT | 66.6% | 482 | +0.026× | +0.316× |
| EUR/USD | Friday 11:00 | SHORT | 51.6% | 1,177 | +0.446× | +0.649× |
Three things worth noticing before anyone copies a row:
- Most survivors are shorts, and most cluster late in the day. Friday and Thursday around 20:00–21:00 UTC dominate. Two of those carry a rollover flag — statistically strong, but sitting exactly where real spreads widen, which is why the flag exists.
- A high win rate is not the same as a big edge. EUR/GBP Thursday 20:00 wins 66.6% of the time and still nets only +0.026× the spread per trade — effectively zero. Meanwhile US30 Monday 13:00 wins just 53.7% and nets +6.5×. The win rate is the headline; the expectancy is the paycheck.
- The index rules beat the FX rules by an order of magnitude — because US30's spread is tiny relative to how far it travels in an hour. Same statistical method, completely different economics.
How to Read One Cell Without Fooling Yourself
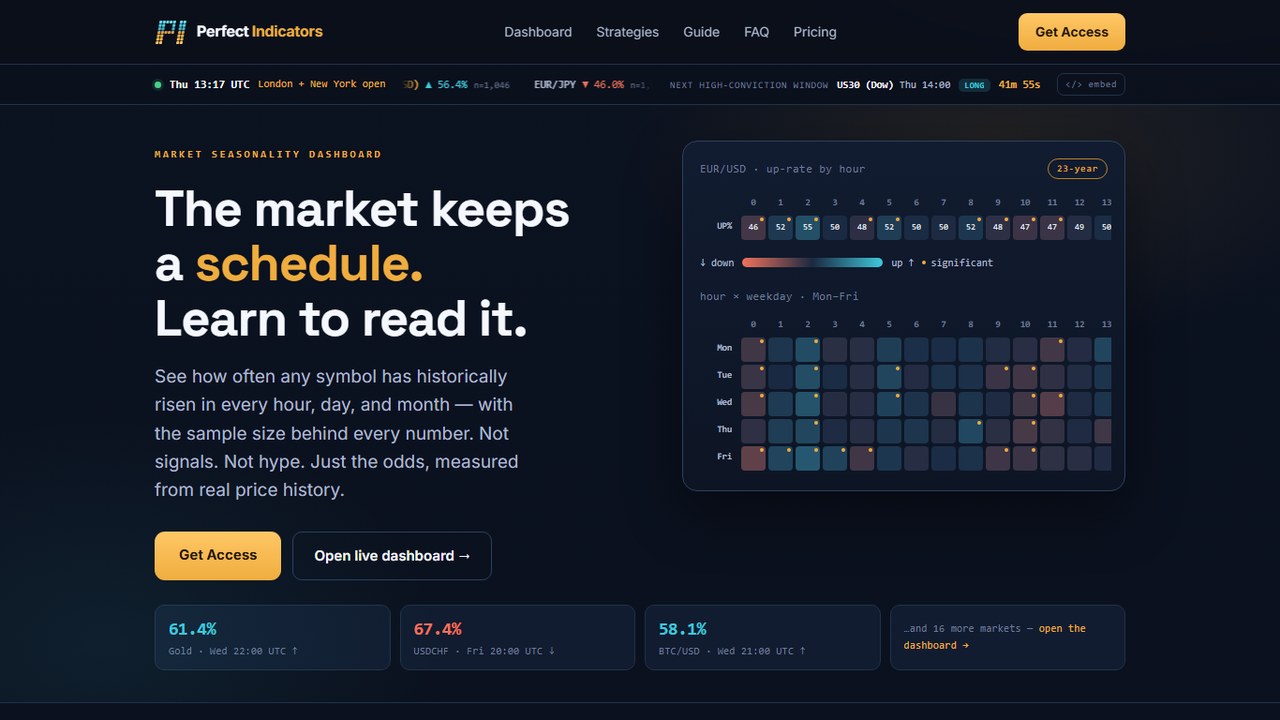
The dashboard behind the study prints four numbers on every bucket, and the discipline is to read all four together:
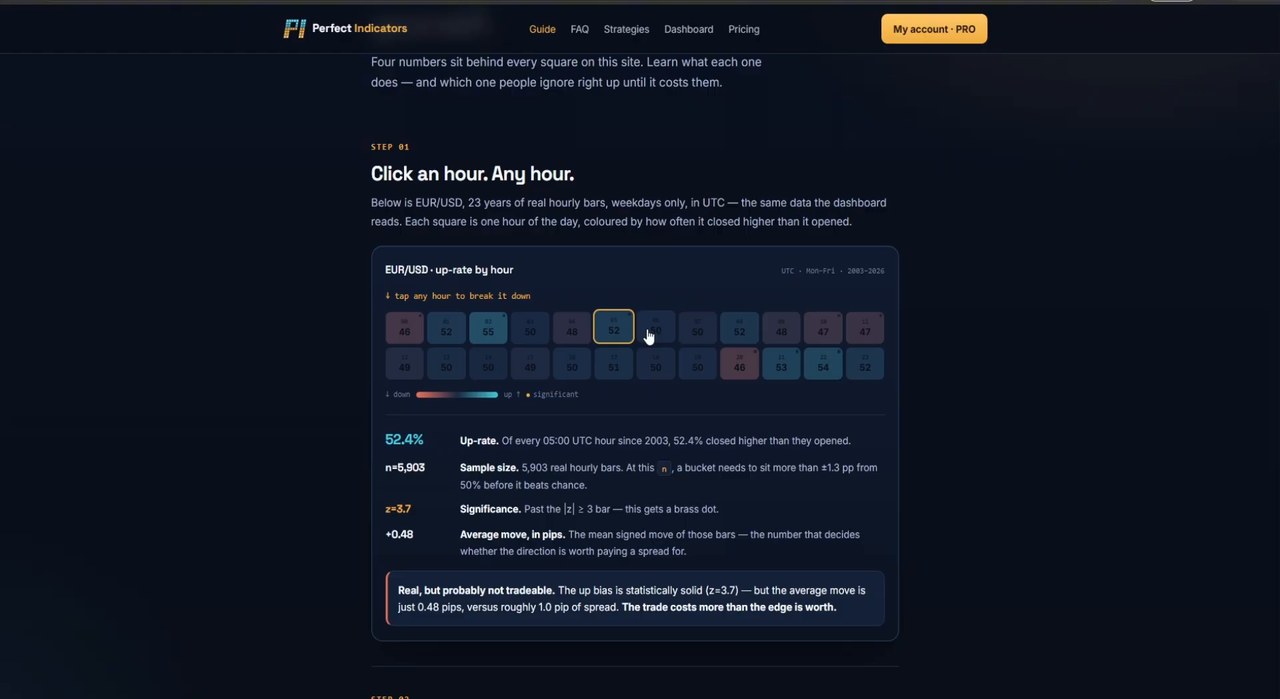
- Up-rate 52.4% — of every 05:00 UTC hour since 2003, this share closed higher than it opened.
- Sample n = 5,903 — at this size, a bucket needs to sit more than about 1.3 percentage points from 50% before it beats chance.
- Significance z = +3.7 — past that bar. Statistically, this is real.
- Average move +0.46 pips — and here it dies. The mean signed move of those bars is roughly half of a 1.0-pip spread. Real, but not tradable.
That is the whole lesson in one cell: a percentage without its sample size is a rumour, and a sample size without an average move is a trap.
Four Ways to Misuse This Data
- Trading a cell as an entry. It is a filter for when, not a signal for now. Bring your own setup — a momentum or trend method, a level, whatever you already trust — and let the clock decide whether you take the signal.
- Hunting for the biggest percentage. The most extreme cell on any heatmap is almost always the one with the thinnest sample. Sort by significance, never by headline number.
- Ignoring the spread. The one that actually empties accounts — see the 12.5% figure above.
- Narrowing until it looks perfect. Every filter you add divides the sample: month filters cut it by twelve. Start wide, confirm the story holds as you narrow, and stop the moment n gets thin.
What This Study Does and Does Not Prove
It does establish that time-of-day structure in FX and index markets is measurable, statistically significant, and stable enough that a minority of rules keep working on data they were never fitted to. Across 23 years and multiple rate cycles, that is not nothing.
It does not establish that any of these rules will work tomorrow. A backtest measures the past under assumptions: real fills slip, real spreads widen exactly when these edges cluster, and a rule chosen from thousands of candidates will always flatter itself somewhat — which is precisely why the out-of-sample column exists and why it is the first thing sorted on. Nothing here is financial advice.
The Verdict
5 out of 5 — and the rating is for the method, not for a promise of profit. What earns it: the costs are deducted rather than assumed away; 30% of history is held back before anything is chosen; the minimum sample is stated and enforced; instruments with short histories are penalised instead of quietly flattered; the ranking is expectancy relative to each symbol's own spread; and the headline result the whole thing produces is “96% of these rules fail.”
That last part is the reason for the full marks. Publishing the failure rate is the opposite of how trading products are normally marketed, and it is the only version of this study that is worth reading. If you want the raw hour-by-hour numbers rather than the tested rules, our own 23-year hourly breakdown of EUR/USD and gold covers every hour of the day with the same sample sizes attached.
Explore the dashboard, the full strategy board and the free widgets at perfectindicators.com, or read its guide to reading probability buckets first — it is the part that keeps the data from being dangerous.
#ForexBacktest #TradingStatistics #ForexSeasonality #TimeOfDayTrading #EURUSD #US30 #QuantitativeTrading #PerfectIndicators #UltimateFXTools
Watch the session
Sponsored content. This post is a paid feature of Perfect Indicators. It is for educational purposes only and is not financial advice. Trading involves substantial risk; you can lose some or all of your capital. All figures describe historical backtest results under stated assumptions. No result is guaranteed and past performance does not indicate future results. Trade only what you can afford to lose.
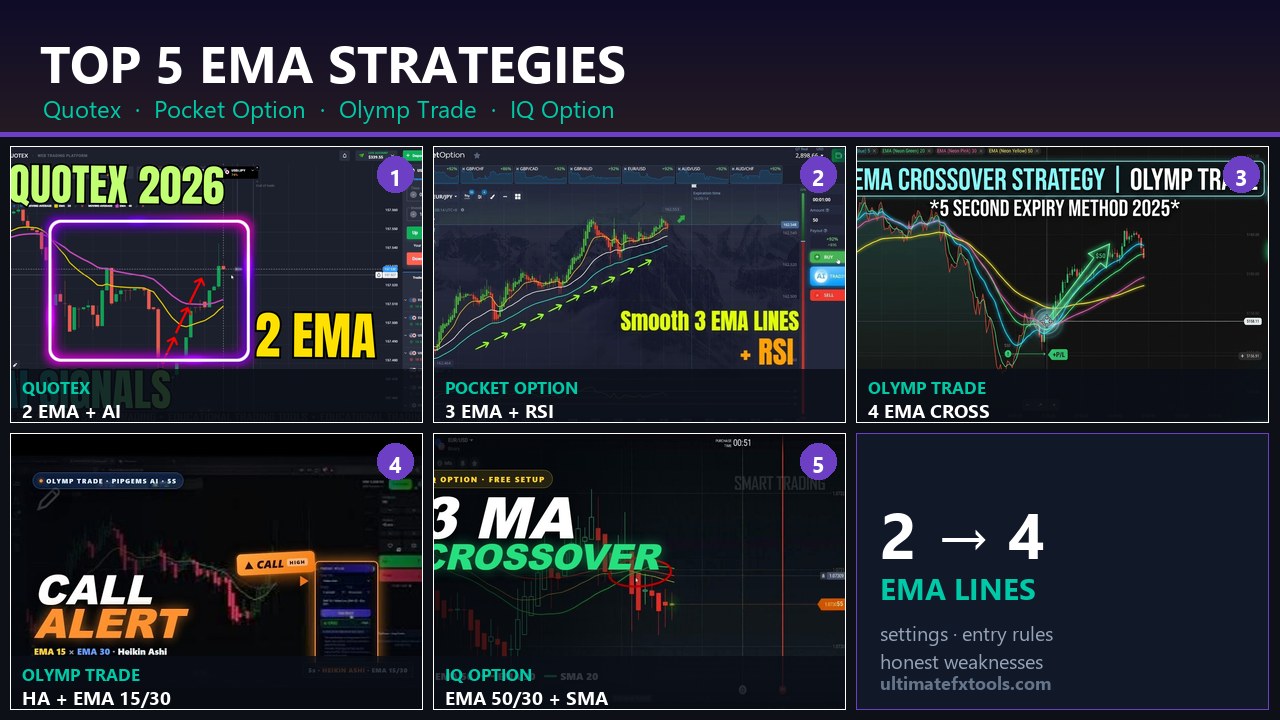
Next: put a time filter on a real setup with the top 5 EMA strategies, or browse the full MT4 and MT5 indicator library and the PipGems AI scanner.
Frequently Asked Questions
Do forex time-of-day strategies actually make money?
Mostly no. Across 5,086 hour and weekday-hour rules tested on 23 years of hourly data with a realistic round-trip spread deducted from every trade, 307 finished net positive and only 214 were still profitable on the last 30% of history that was held back. That is roughly 4% of everything tested. A time-of-day bias is real but small, and most of it is eaten by trading costs.
Why does the spread matter so much for hourly trading?
Because the average move of a single hour is tiny. Across the FX majors, of 400 liquid weekday-hour buckets only 50 - 12.5 percent - move more on average than a 1.0-pip spread. For the other 87.5 percent, the round trip costs more than the directional edge is worth, no matter how convincing the up-rate percentage looks.
What is an out-of-sample test and why does it matter?
The last 30 percent of each symbol's history is held back and never used when picking a rule. A rule only ranks if it stayed profitable on that unseen portion. It matters because searching thousands of candidates guarantees some will look brilliant on the data they were chosen from - the held-out sample is what separates a real pattern from a lucky one.
How do you read an hourly up-rate without fooling yourself?
Read four numbers together, never the percentage alone: the up-rate, the sample size behind it, the significance score, and the average move in pips. A bucket can be statistically solid - for example 52.4 percent up across 5,903 hours at z=3.7 - and still be untradable if its average move of 0.46 pips is smaller than the spread you pay to enter.