The Market Keeps a Schedule — But Not the One You Were Sold
“Trade the London–New York overlap.” “Avoid the Asian session.” “Sell in May.” Every trader has heard the rules; almost nobody has seen the arithmetic behind them. So we ran it: every hourly candle from 2003 to 2026, across 19 markets, sorted into buckets by hour of the day, day of the week and month of the year, then asked one blunt question of each bucket — how often did this hour close higher than it opened?
The answer is more useful than the folklore, and less exciting. Some hours are genuinely, measurably lopsided across two decades. But the honest range is roughly 45% to 60%, not the 80% win rates that get screenshotted on social media. Below is the whole picture — including the hours that look strongest and should be trusted least.
How to Read an Up-Rate (This Part Matters)
An up-rate is simply the percentage of times a given hour closed above its open. A perfectly random market sits at 50%. Three things decide whether a number above or below 50% means anything at all:
- Sample size (n). A bucket built from 40 candles can print 65% by pure luck. A bucket built from 5,900 candles cannot.
- Statistical significance (z-score). The z-score measures how far the result sits from a coin flip, given the sample. Roughly, |z| above 2.6 means the result is unlikely to be chance — and with 24 hours × 5 weekdays × 19 symbols being tested at once, a strict bar matters, because testing enough buckets guarantees some false winners.
- Liquidity. A statistically perfect edge inside a spread-widening window is not an edge. More on this below — it is the single biggest trap in seasonality data.
Every figure on this page is in UTC. Your MetaTrader chart is stamped in broker-server time (usually UTC+2 or UTC+3, and it shifts with daylight saving). Convert before you act: 02:00 UTC is 10:00 in the Philippines, 04:00 in Berlin summer, and 22:00 the previous evening in New York.
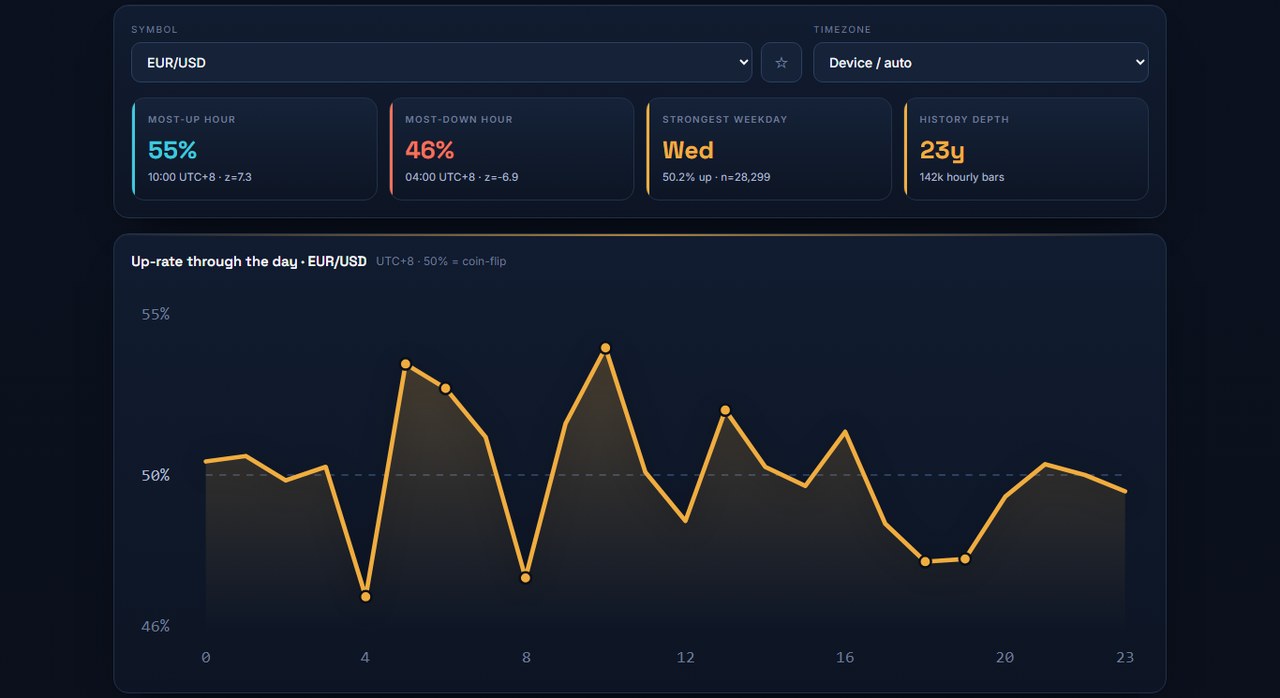
EUR/USD, All 24 Hours, 23 Years
The most traded pair in the world, Monday to Friday, roughly 5,900 samples per hour — about 142,000 hourly candles in total. Green means the hour closed up more often than not; red means down more often; the tag marks buckets that clear the significance bar.
| Hour (UTC) | Up-rate | Samples | z | Verdict |
|---|---|---|---|---|
| 00:00 | 46.2% | 5,902 | −5.86 | significant ↓ |
| 01:00 | 51.9% | 5,902 | +2.94 | significant ↑ |
| 02:00 | 54.7% | 5,902 | +7.26 | strongest up |
| 03:00 | 50.1% | 5,903 | +0.12 | coin flip |
| 04:00 | 48.3% | 5,903 | −2.56 | weak |
| 05:00 | 52.4% | 5,903 | +3.74 | significant ↑ |
| 06:00 | 50.3% | 5,902 | +0.42 | coin flip |
| 07:00 | 49.6% | 5,903 | −0.61 | coin flip |
| 08:00 (London) | 51.6% | 5,893 | +2.51 | weak |
| 09:00 | 48.2% | 5,893 | −2.80 | significant ↓ |
| 10:00 | 46.8% | 5,893 | −4.86 | significant ↓ |
| 11:00 | 46.9% | 5,893 | −4.78 | significant ↓ |
| 12:00 | 49.2% | 5,893 | −1.29 | coin flip |
| 13:00 (New York) | 50.4% | 5,892 | +0.68 | coin flip |
| 14:00 | 50.0% | 5,891 | −0.04 | coin flip |
| 15:00 | 49.4% | 5,891 | −0.93 | coin flip |
| 16:00 | 50.5% | 5,891 | +0.74 | coin flip |
| 17:00 | 50.7% | 5,892 | +1.12 | coin flip |
| 18:00 | 49.8% | 5,892 | −0.26 | coin flip |
| 19:00 | 50.3% | 5,892 | +0.42 | coin flip |
| 20:00 | 45.5% | 5,892 | −6.88 | strongest down |
| 21:00 | 53.1% | 5,132 | +4.38 | rollover |
| 22:00 | 53.5% | 4,723 | +4.82 | rollover |
| 23:00 | 51.6% | 4,721 | +2.20 | rollover |
Three findings jump out, and none of them match the folklore:
- The strongest clean hour is 02:00 UTC — the middle of the Asian session that beginners are told to skip. 54.7% up over 5,902 samples, z = +7.26. Small in size, but about as solid as market statistics get.
- The London morning leans down, not up. 09:00, 10:00 and 11:00 UTC all close lower more often than not, with 10:00 and 11:00 at roughly 47%. The session everyone calls “prime time” is directional — just not in the direction most people assume.
- The famous overlap is a coin flip. 13:00–17:00 UTC — London and New York both open, the most quoted window in retail trading — sits within half a point of 50% in every single hour. The overlap brings volatility, not direction. Those are different products, and traders confuse them constantly.
Gold Has the Biggest Clock of All
If EUR/USD is subtle, gold (XAU/USD) is loud. The same 23-year treatment, ~6,000 samples per hour:
| Hour (UTC) | Up-rate | Samples | z | Note |
|---|---|---|---|---|
| 05:00 | 55.6% | 6,022 | +8.76 | strongest liquid hour |
| 02:00 | 53.0% | 6,022 | +4.61 | significant ↑ |
| 01:00 | 52.9% | 6,021 | +4.47 | significant ↑ |
| 06:00 | 52.7% | 6,021 | +4.27 | significant ↑ |
| 16:00 | 51.8% | 6,022 | +2.83 | significant ↑ |
| 04:00 | 47.3% | 6,021 | −4.21 | significant ↓ |
| 20:00 | 46.0% | 5,894 | −6.07 | significant ↓ |
| 21:00 | 43.4% | 3,458 | −7.75 | rollover |
| 22:00 | 59.1% | 3,877 | +11.32 | rollover |
Gold's 05:00 UTC hour is the cleanest single result in the whole study: 55.6% up across 6,022 hours, in a liquid window, with a z-score near 9. Narrow it to Fridays and it reaches 57.9% (n = 1,194, z = +5.44). That is a real, repeatable tilt — and it is still only about eight percentage points of daylight over a coin flip.
The Rollover Trap — Where Fake Edges Live
Look again at gold's 22:00 UTC: 59.1% up, z = +11.32. The single most impressive number on this page. It is also the one you should trust least, and here is why:
- It sits on the broker rollover. 21:00–23:00 UTC is when the trading day rolls over: volume collapses, spreads widen, and swap is applied. Note the sample sizes in that band — 3,458 and 3,877 against roughly 6,000 elsewhere. The hour barely exists on many brokers' calendars.
- The candle boundary is a convention, not an event. A “22:00 candle” only means something because a server decided where the day starts. Shift the broker's offset and the edge moves with it.
- The spread eats it. An edge of a few percentage points inside a window where the spread can triple is a losing trade dressed as a statistic.
This is why every honest seasonality tool should flag those buckets rather than headline them. The strongest number is very often the least tradable one — and a dashboard that sorts by z-score without saying so is quietly selling you the rollover.
Hour × Weekday: Where the Real Structure Is
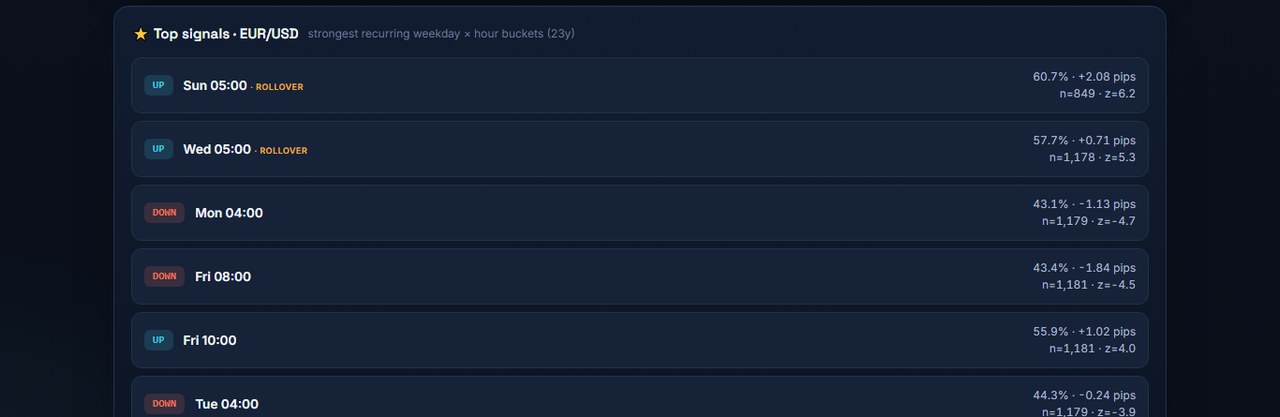
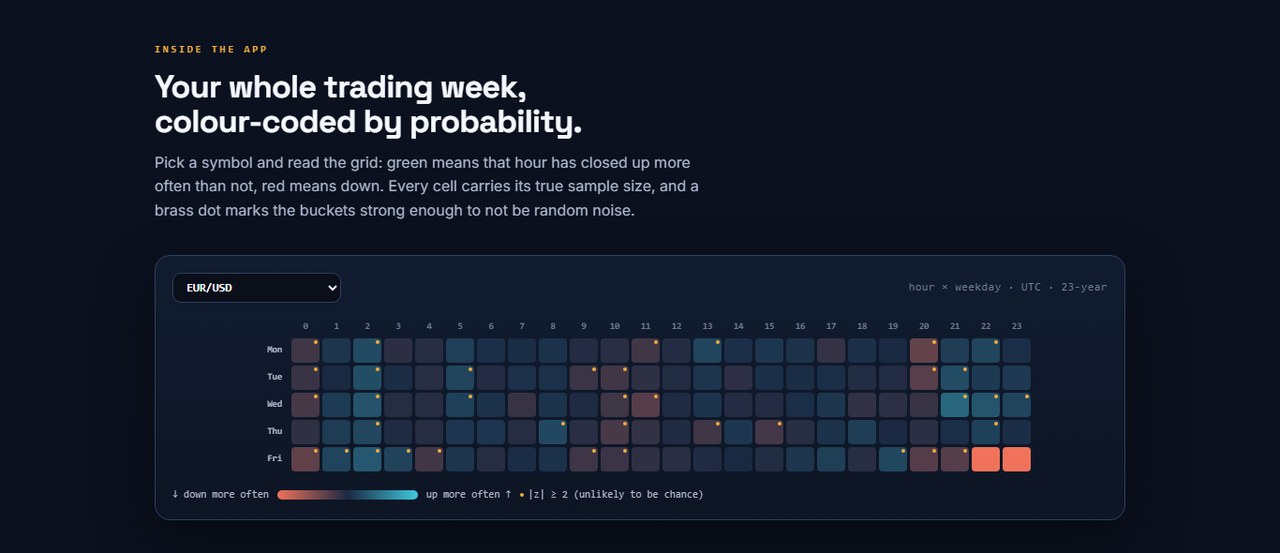
Averaging every Monday-through-Friday into one hour hides as much as it reveals. Split the same data by weekday and hour and sharper buckets appear. Excluding the rollover band entirely, these are the strongest liquid-hour buckets per market across 23 years:
| Market | Bucket (UTC) | Up-rate | Samples | z |
|---|---|---|---|---|
| Gold (XAU/USD) | Friday 05:00 | 57.9% | 1,194 | +5.44 |
| GBP/USD | Monday 01:00 | 55.8% | 1,041 | +3.75 |
| USD/JPY | Friday 00:00 | 55.7% | 918 | +3.43 |
| EUR/JPY | Friday 16:00 | 54.8% | 1,049 | +3.12 |
| US30 (Dow) | Monday 18:00 | 56.4% | 528 | +2.96 |
| EUR/USD | Friday 00:00 | 43.4% | 1,181 | −4.51 |
| USD/CHF | Tuesday 02:00 | 43.5% | 644 | −3.31 |
Note that the down-side buckets are just as strong as the up-side ones. EUR/USD on Friday at 00:00 UTC closed lower 56.6% of the time across 1,181 Fridays. For a directional trader that is the same information as an up-bucket, pointed the other way — and for anyone trading fixed-time contracts on any of the usual platforms, a persistent down-tilt is exactly as tradable as a persistent up-tilt.
The Calendar Barely Matters
Now the finding that contradicts an entire genre of trading content. Run the same test on month of the year for EUR/USD, roughly 11,000–12,000 hourly candles per month:
| Month | Up-rate | z | Month | Up-rate | z |
|---|---|---|---|---|---|
| January | 49.25% | −1.63 | July | 49.73% | −0.61 |
| February | 50.00% | 0.00 | August | 49.27% | −1.58 |
| March | 50.44% | +0.94 | September | 49.85% | −0.31 |
| April | 50.24% | +0.50 | October | 49.23% | −1.65 |
| May | 49.41% | −1.32 | November | 50.90% | +1.90 |
| June | 49.85% | −0.33 | December | 51.74% | +3.79 |
Eleven of twelve months sit within one percentage point of a coin flip. Only December clears the significance bar, and even then by 1.7 points. Meanwhile a single hour reaches 54.7% and another falls to 45.5% on the same instrument. The clock carries far more information than the calendar — which is the opposite of how most “seasonality” content is written, because months make for prettier headlines than hours.
What This Does Not Mean
A 55% historical up-rate is not a 55% win rate on your account, and it is not a prediction of tomorrow. It is a description of what has already happened.
- Costs come off the top. Spread, commission and swap turn a 3-point tilt into nothing. Only the larger buckets survive contact with real execution — and only outside spread-widening windows.
- Fixed-time contracts need more than a tilt. At an 80% payout, break-even sits near 55.5%. That is the top end of what any liquid bucket here delivers, before you have even placed a trade. An hour bias is a filter, never a system.
- Regimes change. 23 years covers several rate cycles, a financial crisis and a pandemic. A bucket that held across all of that is worth attention; that is still not a guarantee it holds next quarter.
- Testing enough buckets manufactures winners. 24 hours × 5 weekdays × 19 symbols is over 2,000 cells. Some will look brilliant by chance alone — which is exactly why sample size and significance belong next to every number, not in the footnotes.
How to Actually Use an Hour Bias
- Use it as a filter, not a trigger. Keep your existing entry method — a momentum or trend setup, a support-and-resistance level, whatever you already trade — and let the clock decide whether you take the signal or skip it. Long signals in an hour that historically leans down are the ones worth passing.
- Convert to your broker's server time first. Every hour on this page is UTC. Get the offset wrong and you are trading a different bucket entirely — and the offset moves twice a year with daylight saving.
- Delete the dead hours. Half of EUR/USD's day is statistically indistinguishable from a coin flip. Not trading those hours costs you nothing and saves you spread, screen time and impulse entries.
- Respect the rollover flag. If a bucket's strength lives at 21:00–23:00 UTC, treat it as an artefact until your own broker's spread data says otherwise.
- Log your own results per hour. Your fills, your spread, your platform. Historical up-rates tell you where to look; your trade log is the only thing that tells you whether it worked for you.
Where This Data Comes From
Every number on this page was computed from Dukascopy hourly candles, 2003 to 2026, across 19 markets: FX majors and minors, gold and silver, US30, NAS100, SPX500, GER40, UK100, plus BTC and ETH. Each hour is bucketed by month, weekday and hour in UTC, and every bucket keeps its own count so the sample size is never hidden.
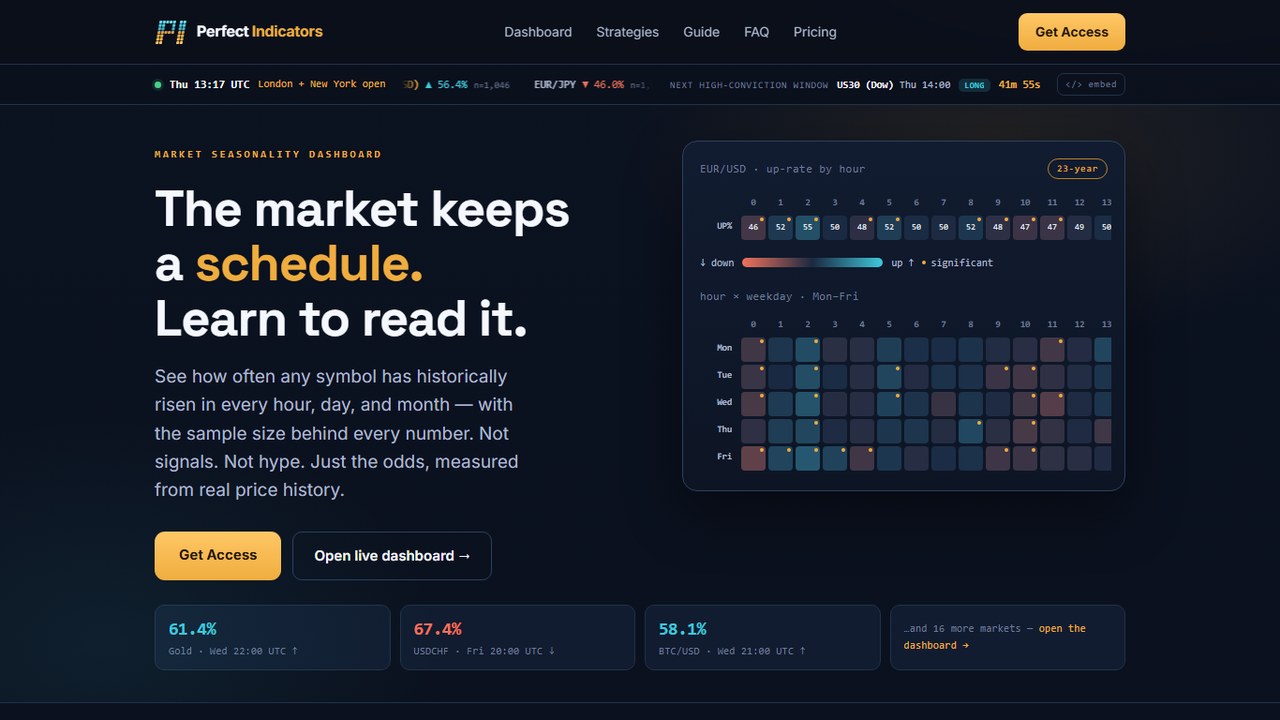
The same engine runs live at Perfect Indicators, a market seasonality dashboard we built for exactly this question. It converts every bucket into your timezone, colour-codes the whole trading week as a heatmap, flags the rollover buckets rather than headlining them, and prints the sample size and significance on every single cell — the four things missing from almost every “best time to trade” article on the internet. You can open the live dashboard and check any of the figures above yourself, or read the guide on reading probability buckets before you trust any of them.
It is a separate tool from the UltimateFXTools library and is not part of the $39 lifetime bundle. If you would rather have the chart-side toolkit — the MT4 and MT5 indicators, the strategy library, and the PipGems AI scanner — that is what the lifetime pack covers, and the two work well side by side: the dashboard tells you when to be watching, the indicators tell you what the chart is doing when you get there.
The Verdict
4.5 out of 5 for hour-of-day seasonality as a trading input. What earns it: the effects are real, they survive 23 years and multiple market regimes, they are measurable rather than anecdotal, and they cost nothing to apply — skipping the dead hours is free. Several of the results directly contradict trading folklore, which is usually a sign you are looking at data rather than repeating a slogan.
The missing half star is honesty about size. This is a 45%-to-60% effect, not a 80% one; costs eat a meaningful share of it; the flashiest buckets are the rollover artefacts; and no amount of history makes a probability a promise. Treated as a filter on top of a method you already trust, the clock is one of the cheapest edges available. Treated as a system on its own, it is a slow way to give the spread your money.
#ForexSeasonality #BestTimeToTradeForex #TradingHours #EURUSD #GoldTrading #MarketData #TradingStatistics #PerfectIndicators #UltimateFXTools
Frequently Asked Questions
What is the best hour to trade forex?
There is no single best hour for every market. Measured across 23 years of hourly candles, EUR/USD closed up most often at 02:00 UTC (54.7% of 5,902 hours) and least often at 20:00 UTC (45.5%). Gold's strongest liquid hour is 05:00 UTC at 55.6% up. These are historical frequencies of roughly 5-6 percentage points away from a coin flip, not predictions - and they differ by symbol, so the hour that matters depends on what you trade.
Does forex seasonality actually work?
Hour-of-day effects are measurable and statistically significant across 23 years of data, but they are mild: the honest range is about 45% to 60% up-rate, not the 80% figures often advertised. Month-of-year effects on EUR/USD are far weaker - eleven of twelve months sit within one percentage point of 50%. The clock carries more information than the calendar.
Why do the strongest hours cluster around 21:00-23:00 UTC?
Those hours straddle the broker rollover, when the trading day closes, liquidity thins and spreads widen. Statistics computed there look strong - gold shows 59.1% up at 22:00 UTC - but the wider spread often costs more than the edge is worth, and the candle boundary itself is a broker convention rather than a market event. Treat rollover buckets as flagged, not tradable.
How do I convert these hours to my own timezone?
Every figure in this study is in UTC. Your MetaTrader chart is stamped in broker-server time, which is usually UTC+2 or UTC+3 and shifts with daylight saving. Add your own offset before acting on any hour: 02:00 UTC is 10:00 in the Philippines (UTC+8), 04:00 in Berlin summer time, and 22:00 the previous day in New York.
This content is for educational purposes only and is not financial advice. Trading involves substantial risk; you can lose some or all of your capital. All figures describe historical frequencies. No result is guaranteed and past performance does not indicate future results. Trade only what you can afford to lose.
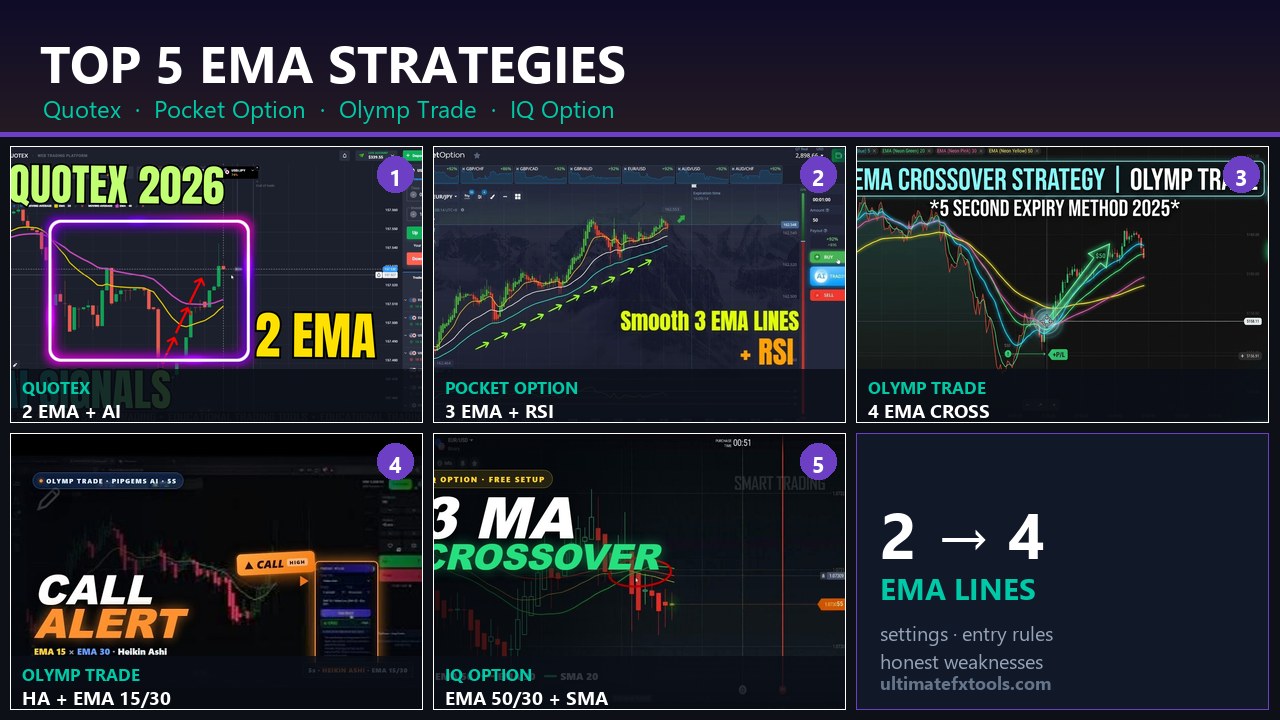
Next: pair an hour filter with a setup — the top 5 EMA strategies for trend entries, or the 6 best indicators for short-expiry trading. Browse everything in the strategy library.