What an EMA Actually Tells You
An exponential moving average is a rolling average of price that weights recent candles more heavily than old ones. That is the whole idea. It is not a prediction, it does not know where price is going, and it cannot be right or wrong — it can only be late, because every value it plots is built from candles that have already closed.
Which leads to the honest thing to say before a list like this: stacking more EMAs does not add confirmation. Four EMAs agreeing is one idea repeated four times — they are all drawn from the same price series, so they are heavily correlated by construction. What extra lines actually buy you is selectivity: a fast line that must clear a whole cluster fires far less often than a single cross, and on a 5- or 10-second chart being selective is most of the job.
That is why the strongest entries below pair the EMAs with something that measures differently — RSI momentum, Heikin Ashi smoothing, or an AI chart scanner reading the picture back to you — rather than simply adding a fifth line.
The Five, From Two Lines to Four
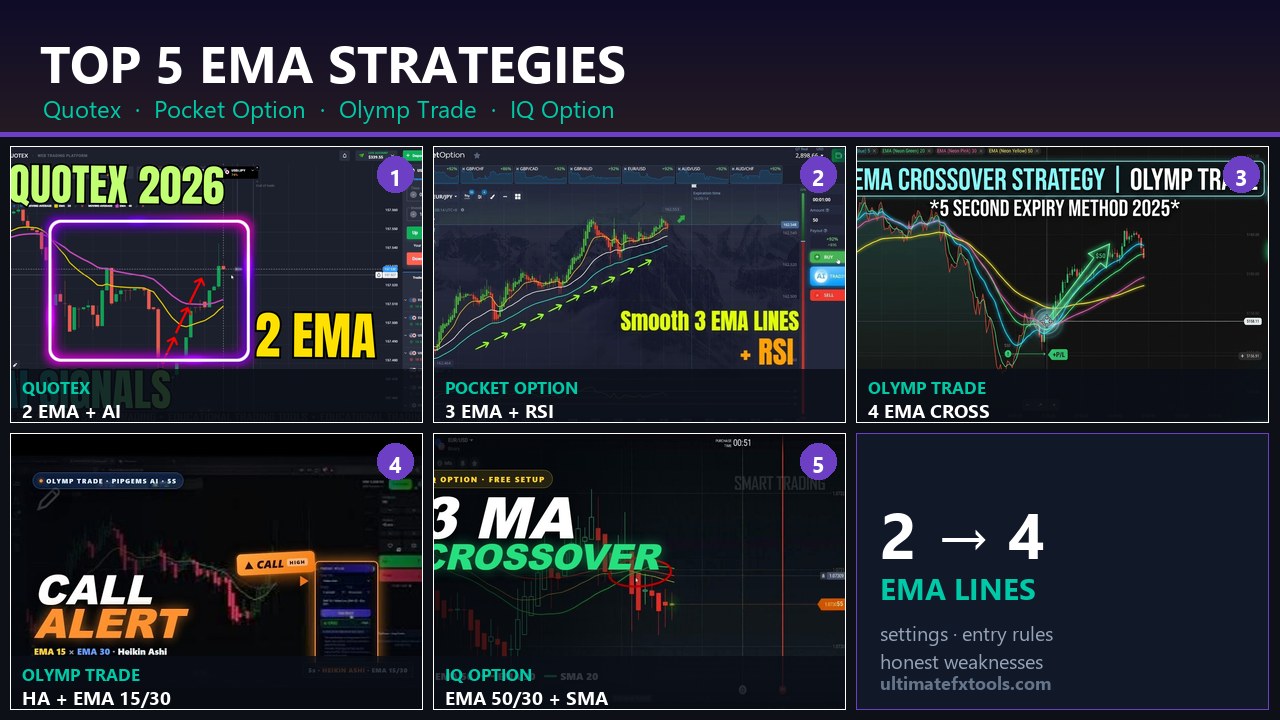
1. Quotex — 2 EMA + PipGems AI Signals ★ 4/5
- Platform: Quotex · Candles: 10 seconds
- Lines: EMA 20 (yellow) and EMA 40 (purple)
- The read: the AI app issues the CALL/PUT alert; the two EMAs are the filter. Separated and aligned means the trend has room — flat or tangled lines mean the market is ranging and the alert gets skipped.
- Best for: traders who want a signal source but need a rule that stops them taking every one of them.
This is the cleanest expression of the "EMA as a veto, not a trigger" idea. The AI supplies direction, the moving averages supply permission, and the setups that get filtered out are choppy conditions where a two-line cross would have whipsawed anyway.
→ Read the full Quotex 2 EMA + AI strategy
2. Pocket Option — 3 EMA Lines with RSI ★ 3.5/5
- Platform: Pocket Option · currency pairs
- Lines: fast EMA ~12, medium EMA ~35, slow EMA ~60
- Second opinion: RSI 14 — the 70/30 zones for stretch, the 50 line as the momentum midpoint
- The read: the EMA stack describes direction and how the time horizons line up; RSI is the independent check that flags when price is running out of steam while the averages still look healthy.
Of the five, this is the one that most deliberately fixes the correlation problem. RSI is not another average — it measures momentum, so it can disagree with the stack, and a tool that can disagree is worth more than one that cannot.
→ Read the full Pocket Option 3 EMA + RSI strategy
3. Olymp Trade — 4 EMA Crossover, 5-Second Expiry ★ 3.5/5
- Platform: Olymp Trade Quickler · Expiry: 5 seconds
- Lines: EMA 1 (red, fastest), EMA 5 (green), EMA 20 (blue), EMA 30 (orange, slowest)
- Chart mode: graph/line mode, not candles — at this speed candle wicks make the alignment unreadable
- Trigger: all four sloping the same way, then the red 1-period line turns and crosses the green 5-period line. Partial setups are skipped entirely.
The fastest setup on the list, and the most demanding. A 1-period EMA is effectively price itself, so the "crossover" is really a momentum flip caught early. It works when a move is running and whipsaws hard when nothing is — which is exactly why the all-four-aligned condition is not optional.
→ Read the full Olymp Trade 4 EMA crossover method
4. Olymp Trade — Heikin Ashi + EMA 15/30 with the AI Scanner ★ 4/5
- Platform: Olymp Trade · crypto OTC (Bitcoin, SHIB, BNB) at 90% payouts
- Candles: Heikin Ashi, 5 seconds · Trade duration: 45 seconds · Stake: flat $50
- Lines: EMA 15 (yellow) over EMA 30 (blue) = CALL side only; yellow below blue = PUT side only
- Second opinion: the PipGems AI Chart Scanner, configured to match — chart type Heiken Ashi, 5-second candles, 45-second target, and a note naming the two EMAs and their colours so the analysis can reference them.
The highest-rated of the group alongside #1, and for the same reason: the EMAs decide which side you are allowed to trade, and something that measures differently decides whether this particular chart is worth it. Heikin Ashi doing the smoothing means the EMAs are not fighting raw 5-second noise.
→ Read the full Heikin Ashi + EMA 15/30 strategy
5. IQ Option — 3 Moving Average Crossover (Free Built-Ins) ★ 3/5
- Platform: IQ Option · Candles: 5 seconds · Trade duration: 2 minutes
- Lines: EMA 50 (red, broad trend), EMA 30 (yellow, middle reference), SMA 20 (green, the signal line)
- Trigger: the green signal line crosses both slower lines, then the candles confirm before you click
- Cost: nothing — all three are built into the platform's Moving Average panel, no custom files
The lowest rating here, and it is not a criticism of the idea so much as of what plain crossover logic can do alone. There is no independent second measure anywhere in the setup: three correlated averages and your own read of the candles. It earns its place because it is genuinely free, genuinely simple, and a fair first setup to learn crossover discipline on — a 2-minute expiry off 5-second candles gives the trade room to work.
→ Read the full IQ Option 3 MA crossover strategy
Side by Side
| # | Platform | EMAs | Candles / expiry | Second measure | Rating |
|---|---|---|---|---|---|
| 1 | Quotex | 20 / 40 | 10s candles | AI signal app | 4 / 5 |
| 2 | Pocket Option | 12 / 35 / 60 | short expiry | RSI 14 | 3.5 / 5 |
| 3 | Olymp Trade | 1 / 5 / 20 / 30 | 5s expiry | none — alignment only | 3.5 / 5 |
| 4 | Olymp Trade | 15 / 30 | 5s candles, 45s trade | Heikin Ashi + AI scanner | 4 / 5 |
| 5 | IQ Option | 50 / 30 + SMA 20 | 5s candles, 2m trade | candle confirmation | 3 / 5 |
Which One Should You Start With?
If you are new to moving averages, start at #5. It is free, the trigger is unambiguous, and a 2-minute expiry is forgiving enough that you can watch what a crossover actually does before money is involved. Learn there why crossovers lag.
If you already trade and want fewer, better entries, go to #2 or #4. Both give you something that can veto the moving averages, which is the single upgrade that matters most in this family of setups.
Leave #3 until last. Five-second expiries with a 1-period EMA demand a decision every few seconds, and the cost of hesitating or misreading is immediate.
The Maths Every One of These Has to Beat
On fixed-time trades a win returns your stake plus the payout, while a loss costs the entire stake — so break-even sits above 50%. At a 90% payout you need 52.6% accuracy just to stay level; at 85% it is 54.1%, and at 75% it climbs to 57.1%.
No EMA arrangement changes that bar. Pair selection does: choosing a 90% chart over a 77% one lowers your break-even by roughly four points before you have read a single candle. It is the cheapest edge on this page, and it costs nothing but patience.
What All Five Share — The Honest Part
- Every EMA is late. It is an average of closed candles. On a 5-second chart it will still be sloping one way for several bars after price has genuinely turned.
- More lines ≠ more confirmation. Correlated tools agreeing is one opinion, repeated. Selectivity is the real benefit.
- Ranging markets punish all of them. Crossovers cluster and reverse when price goes sideways — that is where account damage happens, not in trends.
- OTC pricing is platform-generated. Several of these sessions run on OTC pairs for the payouts. Behaviour there does not transfer one-for-one to live-market hours.
- A recorded session is not a sample size. Six or ten trades in a video can look excellent or terrible by chance alone.
Risk Management Rules
- Keep the stake identical on every entry. Never raise it to recover a loss.
- Skip partial setups. In all five, "most of the conditions" is a losing habit dressed as patience.
- Limit the number of trades per session and set a hard daily loss cap before you start.
- Prefer the higher-payout chart when two setups look equally clean.
- Trade one of these at a time on a demo balance until the entry rule is automatic — running all five at once teaches you nothing about any of them.
Want the crossover read as an alert on MetaTrader rather than by eye? The EMA MACD Alert indicator fires when the two agree, and Rainbow EMA stacks EMA 5 through EMA 89 for the alignment view.
#EMA #EMAStrategy #Quotex #PocketOption #OlympTrade #IQOption #MovingAverage #BinaryOptions #TradingStrategy #TechnicalAnalysis
This content is for educational purposes only and is not financial advice. Trading involves substantial risk; you can lose some or all of your capital. Past results do not guarantee future outcomes. Limit your daily trades, practise responsible money management, and trade only what you can afford to lose — test everything on a demo account first.