Best 5 Pocket Option EMA Strategies
The exponential moving average, or EMA, is one of the most widely used tools for traders on Pocket Option. Unlike a simple moving average, an EMA places more weight on recent price action, so it reacts faster to changes in direction. That responsiveness matters on a fixed-time platform where expiries can be as short as 5, 15, or 60 seconds, because you need a filter that keeps pace with the current candle rather than lagging several bars behind. EMAs are built into the Pocket Option chart, so you can apply them without importing anything. Below are five practical EMA setups, from the simplest single line to multi-tool combinations, each with concrete period settings you can test on a demo chart.
1. Single EMA Trend Filter
The most beginner-friendly approach uses one EMA, commonly a 20-period or 21-period line, as a directional bias filter. When price trades above the EMA and the line slopes up, you only look for upward (call) entries; when price is below a downward-sloping EMA, you only consider downward (put) entries. This single rule keeps you aligned with the short-term trend and filters out many counter-trend setups that tend to reverse quickly. For a related single-tool trend idea, see the Pocket Option 2024 Trend WMA approach, which applies the same logic with a weighted average.
2. Two-EMA Crossover
A classic setup places a faster EMA and a slower EMA on the chart, for example a 9-period and a 21-period. When the fast 9 EMA crosses above the slow 21 EMA, momentum is shifting up and you look for call entries; when the 9 crosses below the 21, you look for put entries. Waiting for a candle to close on the crossover side helps reduce false signals in flat, choppy markets. For a comparable two-line moving-average method, see Pocket Option 2 Weighted Moving Average.
3. Three-EMA Ribbon
The ribbon adds a third line, typically a 9, 21, and 55 EMA stacked together. When all three line up in order, fast on top for an uptrend or fast on the bottom for a downtrend, the trend is considered clean and you trade only in that direction. When the lines tangle and cross repeatedly, the market is ranging and it is usually better to stand aside. The ribbon is especially useful on 1-minute charts where you want visual confirmation before committing.
4. EMA + RSI
Combining a 21 EMA with the Relative Strength Index adds a momentum check to your trend filter. Use the EMA to set direction, then require RSI (period 14) to confirm: for call entries price should be above the EMA with RSI rising through the 50 midline, and for put entries price should be below the EMA with RSI falling below 50. An overextended RSI near the 70 or 30 extremes also warns that a pullback may be near, helping you avoid late entries. Layering a trend line with an oscillator is a common theme across our guides, such as Pocket Option Moving Averages with DeMarker.
5. EMA + MACD
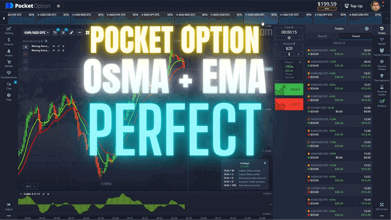
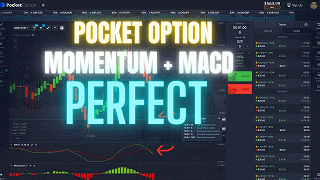
The final setup pairs a 50 EMA with the MACD histogram to blend trend and momentum. The 50 EMA defines the broader bias, while the MACD crossing its signal line in the same direction provides the entry trigger. When the EMA points up and the MACD histogram flips from negative to positive, that agreement supports a call entry; the mirror image supports a put. Because both tools smooth price, this suits slightly longer expiries like 1 to 5 minutes; for a related blend see Pocket Option OsMA and EMA.
Choosing EMA Periods for Your Timeframe
There is no single best EMA period, because the right setting depends on your expiry and chart timeframe. On very short expiries such as 5 to 15 seconds, faster EMAs like 5, 9, or 12 keep up with each candle, though they also produce more noise. On 1-minute to 5-minute expiries, slower lines like 21, 50, or even 100 give a steadier read of the underlying trend and cut down on whipsaws. A common practice is to keep the fast EMA close to your average trade duration in candles and the slow EMA two to three times longer. Always demo-test any combination for a stretch of sessions first, since each currency pair and OTC symbol reacts differently, and settings that suit one may lag on another.
FAQ
What are the best EMA periods for beginners?
A simple 9 and 21 EMA pair is a friendly starting point. It is easy to read, works across most timeframes, and clearly shows direction through the crossover. Begin with those two lines on a demo chart, learn how they behave on your favorite pairs, and only add more tools like RSI or MACD once the basic crossover feels natural.
What is the difference between EMA and SMA?
A simple moving average (SMA) gives equal weight to every price in its lookback window, so it moves smoothly but reacts slowly. An EMA weights recent prices more heavily, so it turns faster when the market changes direction. On short fixed-time expiries many traders prefer the EMA for that quicker response, while the SMA can feel too delayed for fast entries.
Do I need to pay, or can I use EMAs for free?
Every EMA setup on this page uses tools already built into the Pocket Option chart, so you can apply and test them at no cost. If you later want a full library of ready-made custom indicators and organized strategy files, our $39 lifetime package bundles them together, but it is entirely optional and not required to trade the setups above.
This content is for educational purposes only. Trading involves risk. Past results do not guarantee future outcomes. Always practice responsible money management and limit your daily trades to avoid large losses.