Pocket Option Moving Averages with DeMarker
Pocket Option is a fixed-time trading platform: you open a position, choose an expiry, and the trade settles on whether price finishes higher or lower when the timer ends. This method leans on two indicators that do very different jobs — a pair of moving averages to read the trend, and the DeMarker oscillator to time the pullback. Neither predicts the future; together they add structure to a bare chart.
The pairing works because the tools cover each other's blind spots. Moving averages are lagging trend tools — they follow price and only confirm a direction after it has begun, so they are slow but steady. The DeMarker is a bounded oscillator that reacts quickly to stretched conditions. One gives context (which way the market leans), the other gives timing (when a move looks overextended). Traded with no trend context, the oscillator leaves you fighting the market's direction.
The DeMarker Indicator, Explained
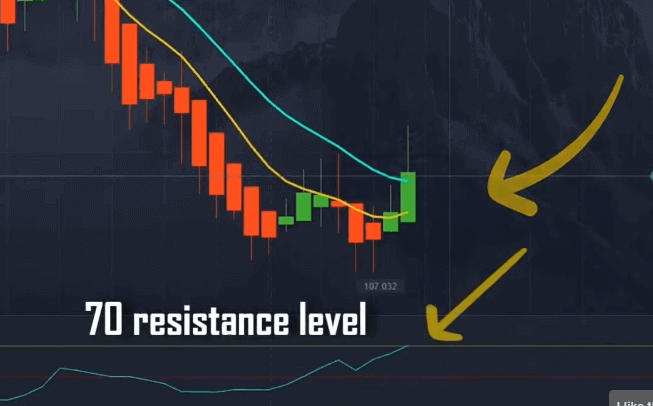
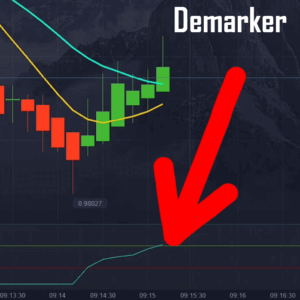
The DeMarker compares recent highs and lows to gauge whether buyers or sellers have been doing the heavy lifting. It plots on a fixed 0-to-1 scale: readings toward the upper band mean the market is stretched to the upside (overbought), and readings toward the lower band mean it is stretched to the downside (oversold). Because the scale is bounded, an extreme reading means the current push may be running out of room — not a command to trade against it.
For this setup the DeMarker period is set to 7, with the overbought and oversold levels marked at 70/30 (0.7 and 0.3 on the oscillator). A short period like 7 makes the line responsive, suiting quick expiries but producing more false pokes into the extreme zones — which is why it is filtered through the moving averages rather than traded alone.
The Two Weighted Moving Averages
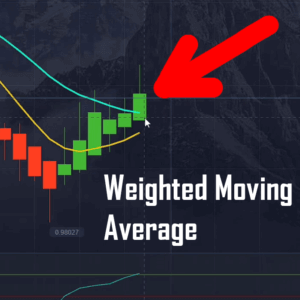
A weighted moving average (WMA) smooths price but gives more importance to the most recent candles, so it turns a little sooner than a plain simple moving average. This method uses two: a faster WMA at period 12 and a slower WMA at period 23, each set to a color you can tell apart at a glance.
The crossover between the lines is the trend cue. When the faster 12 WMA crosses above the slower 23 WMA, momentum leans up; when it crosses below, momentum leans down. These are lagging lines: the cross confirms a shift already underway, keeping you on the right side of the move rather than calling the exact top or bottom.
How to Read a Trade
Trade a pullback in the direction the moving averages already point, using the DeMarker to time entry:
- Up setup: the 12 WMA is above the 23 WMA (uptrend context) and the DeMarker dips toward the 30 oversold band and turns back up — a pause inside an uptrend rather than a full reversal.
- Down setup: the 12 WMA is below the 23 WMA (downtrend context) and the DeMarker pushes toward the 70 overbought band and rolls back down.
- Stand aside: the two WMAs are flat and tangled, or the DeMarker is mid-range with no clear extreme — a coin flip, so skip it.
Let each candle fully form before you act. Built for OTC pairs on short expiries, this setup behaves best when the market is quietly trending.
When This Setup Fails
The clearest failure mode is a strong trend. In a hard one-way move the DeMarker can sit pinned in overbought or oversold while price keeps going — taking every extreme reading as a reversal is how you rack up losses fighting the trend. Choppy, sideways markets are the other trap: the WMAs cross back and forth and generate cues that lead nowhere. Manage both the same way — only take signals where the trend context and the oscillator agree. Stake a small, fixed fraction of your balance per trade, cap trades per session, and set a daily loss limit you actually stop at. Practice the routine on a Pocket Option demo until the reads feel automatic before risking real funds. No indicator combination removes losing trades; the aim is steady, repeatable decisions and consistency over time.
FAQ
Does the DeMarker predict reversals on its own?
No. It only measures whether recent price action is stretched overbought or oversold. An extreme reading flags that a move may be tiring, but price can stay extreme for a long time in a strong trend — which is why it is paired with the moving averages for context.
Why use two moving averages instead of one?
A single line only shows the general slope. Two lines give a crossover — a clearer, rule-based way to define the trend and its shifts. The faster 12 WMA reacts to recent candles while the slower 23 WMA holds the broader direction.
Do I need to buy anything to try this?
The DeMarker and weighted moving averages are standard indicators on most platforms, so you can test the method free on a demo. The full custom indicator and strategy set is bundled under a single $39 lifetime plan. For related reading, see DeMarker + MA cross on Pocket Option, the two weighted moving average method, and the trend-plus-MA DeMarker Advanced indicator.
This content is for educational purposes only. Trading involves risk. Past results do not guarantee future outcomes. Always practice responsible money management and limit your daily trades to avoid large losses.