One indicator, deliberately
Most short-expiry setups stack three or four tools and leave you refereeing their disagreements. This one uses a single indicator whose meaning is unusually honest: the Donchian Channel does no averaging and no smoothing. Set to period 26 on a 10-second chart, its upper line is simply the highest high of the last 26 candles and its lower line the lowest low — the edges of everything price has done in roughly the last four and a half minutes.
So when a candle touches a band, it is not an oscillator opinion — price is literally at its recent extreme. The whole strategy is one idea: at a flat band, an extreme is more likely to snap back toward the middle than to keep going, and a 5-second expiry only needs the first tick of that snap-back.
The exact settings
| Platform | Quotex (web) |
|---|---|
| Indicator | Donchian Channel, period 26 — the only indicator on the chart |
| Candle timeframe | 10 seconds |
| Expiry | 5 seconds (00:00:05) |
| Stake | Flat $50 per trade — no martingale anywhere in the session |
| Markets | OTC currency pairs at 81–92% payout (USD/PHP, USD/NGN, USD/DZD, USD/EGP, EUR/NZD, EUR/CHF…) |
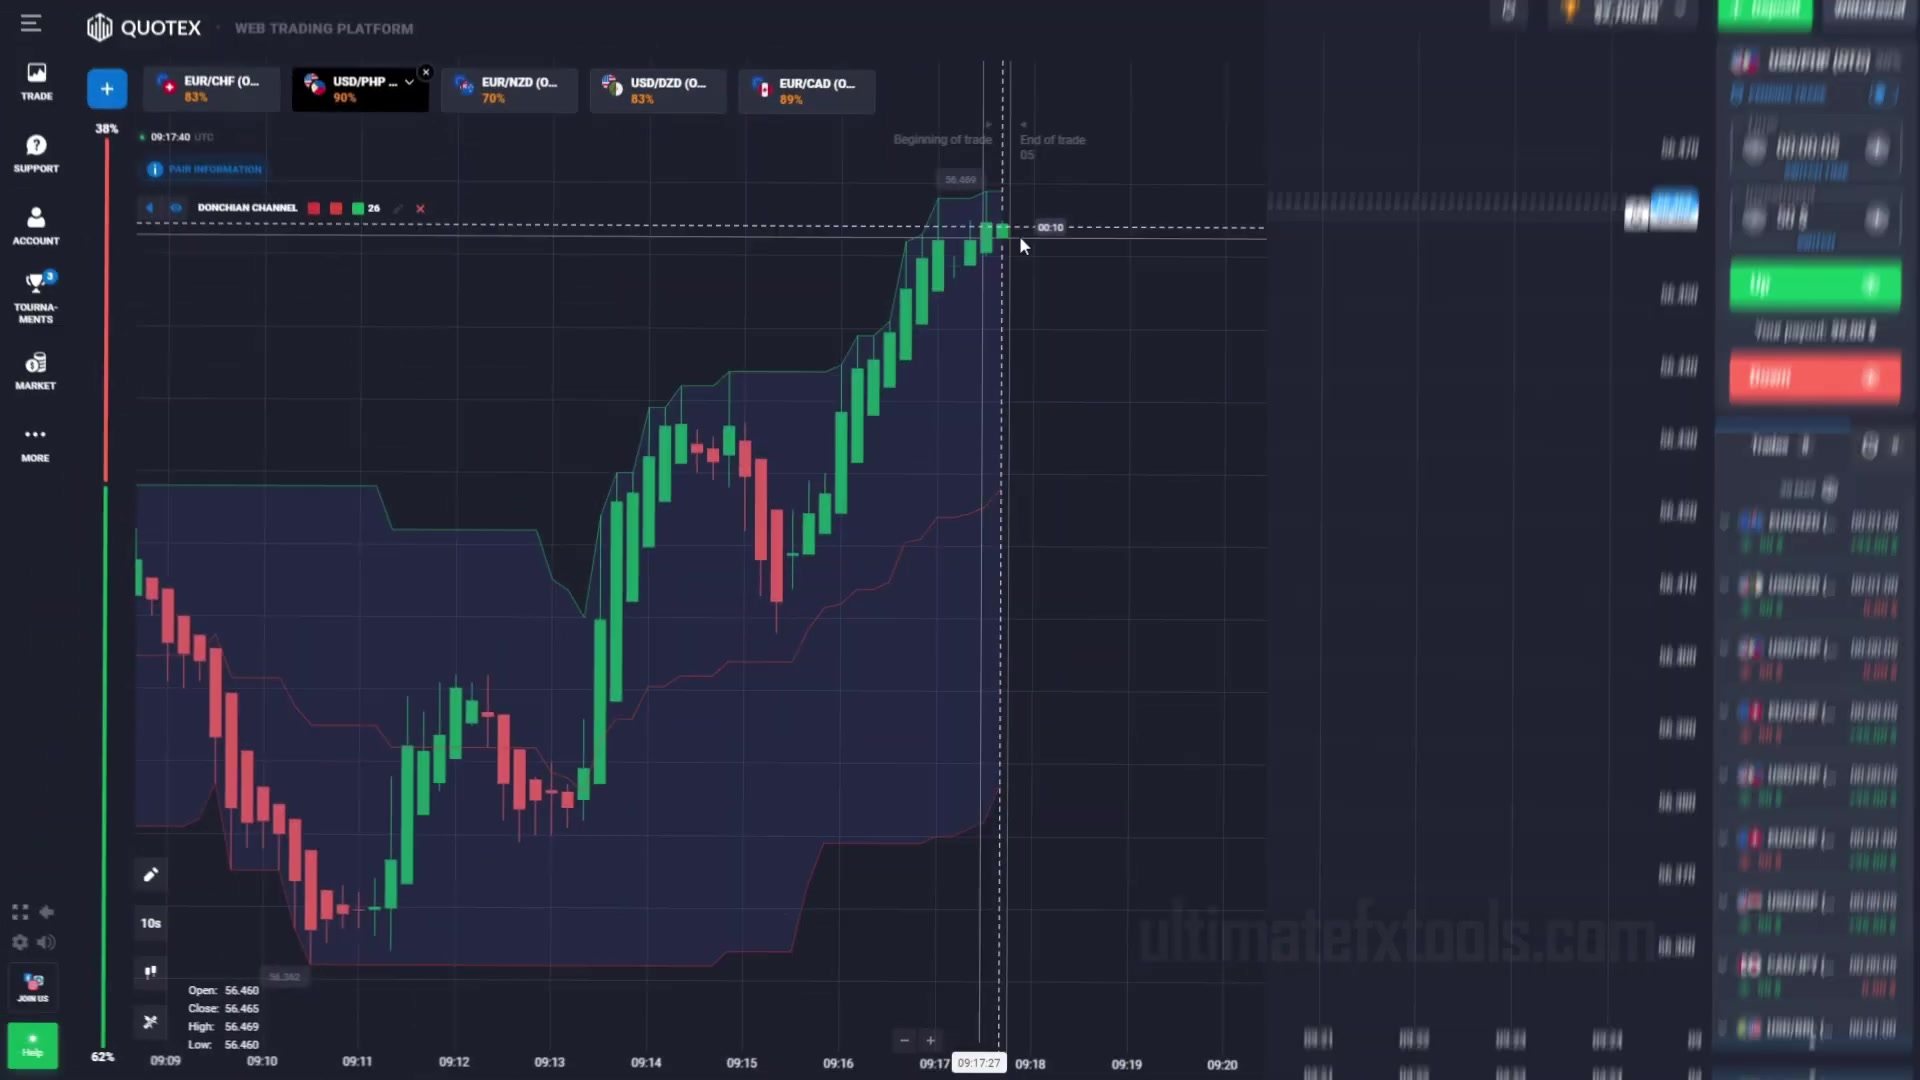
Entry 1 — the upper-band fade (SELL)
- A candle reaches up and touches the upper band — a wick touch counts; it does not need to close beyond it.
- Wait for confirmation: the next candle starts forming red (downward).
- Enter Down with the 5-second expiry — on the confirmation candle, not on the touch itself.
In the session this fires on USD/PHP for +$95 on the $50 stake. The confirmation step is what separates this from blind band-fading: a touch alone is not enough, the first sign of rejection is required.
Entry 2 — the lower-band spike (BUY)
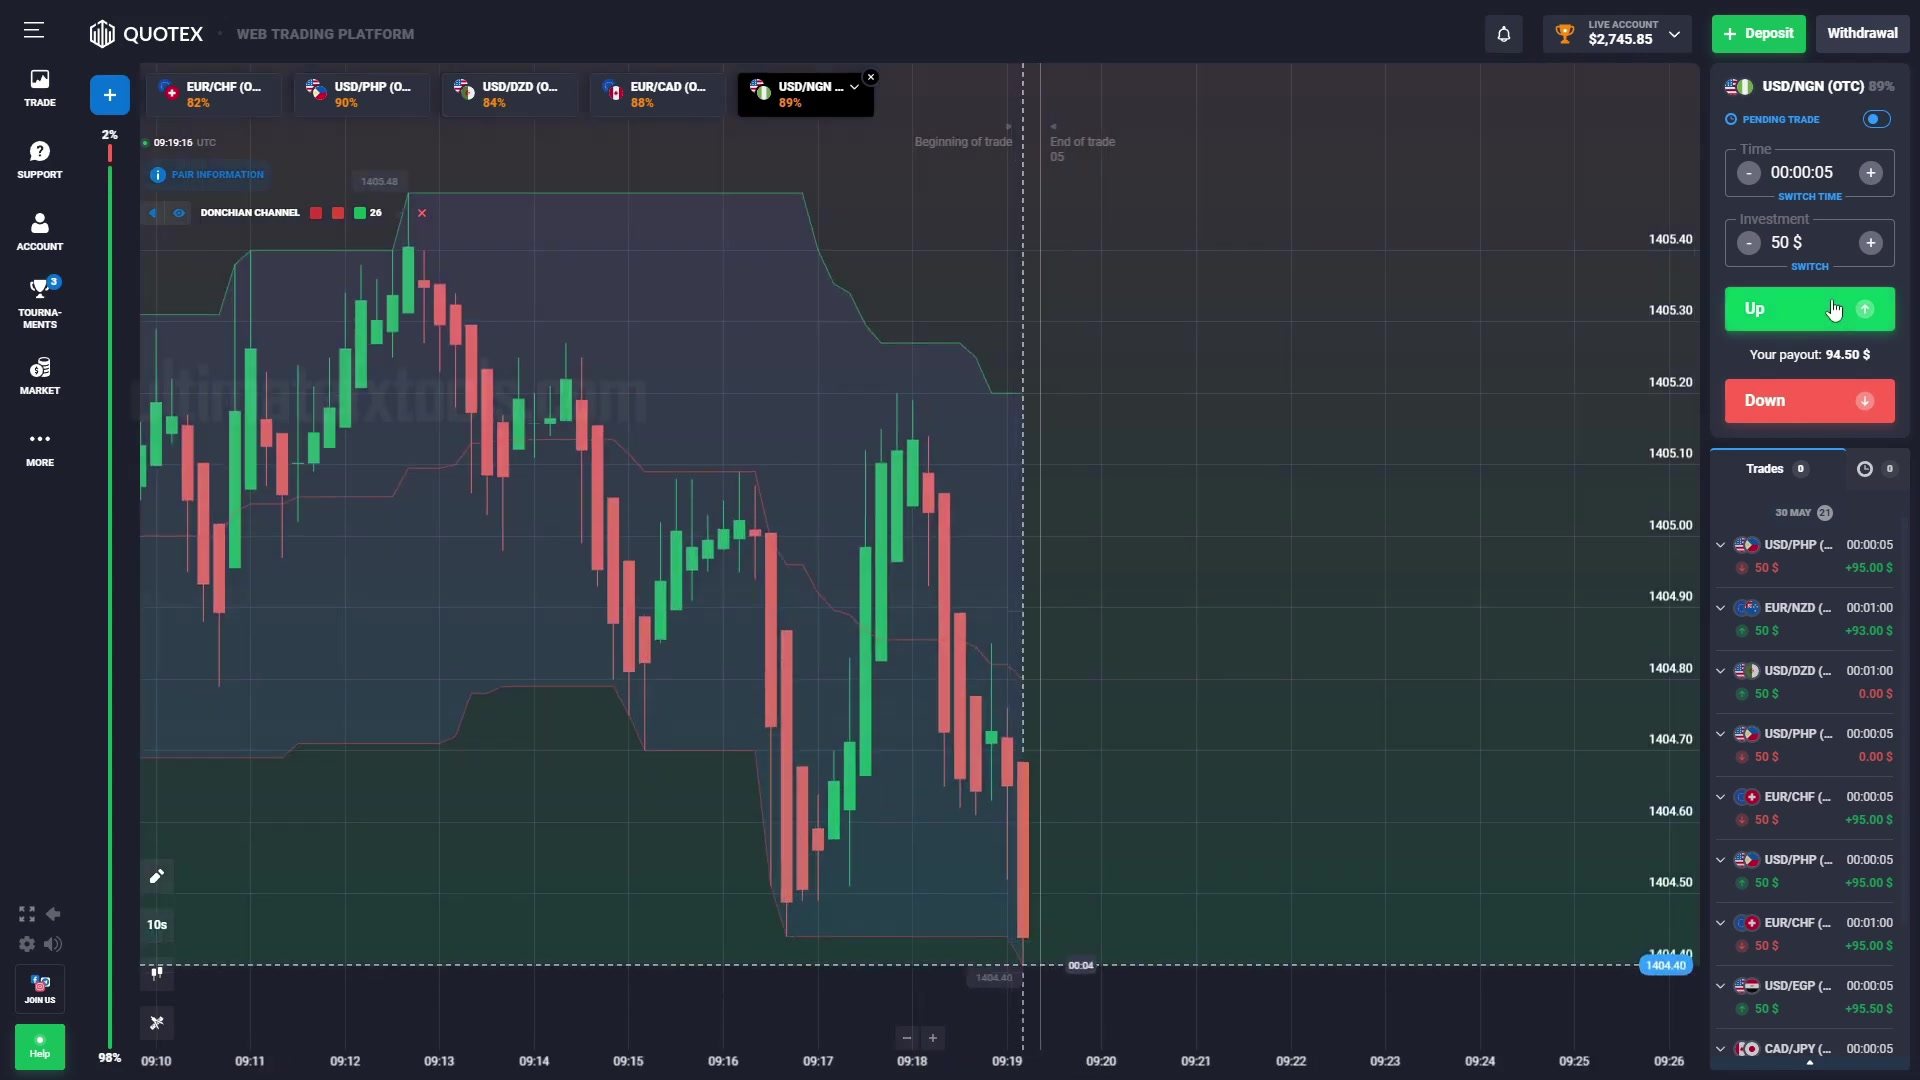
- A tall red candle — visibly bigger than its neighbours — drives down and touches or pierces the lower band.
- No confirmation wait here: the spike itself is the signal. The logic is that an over-extended push is the most likely candle to retract.
- Enter Up with the 5-second expiry.
This is the aggressive entry of the three — it fires during the extreme rather than after rejection is shown, which makes it both earlier and easier to get wrong. In the session it lands +$94.50 on USD/NGN.
Entry 3 — the exhaustion cluster (BUY)
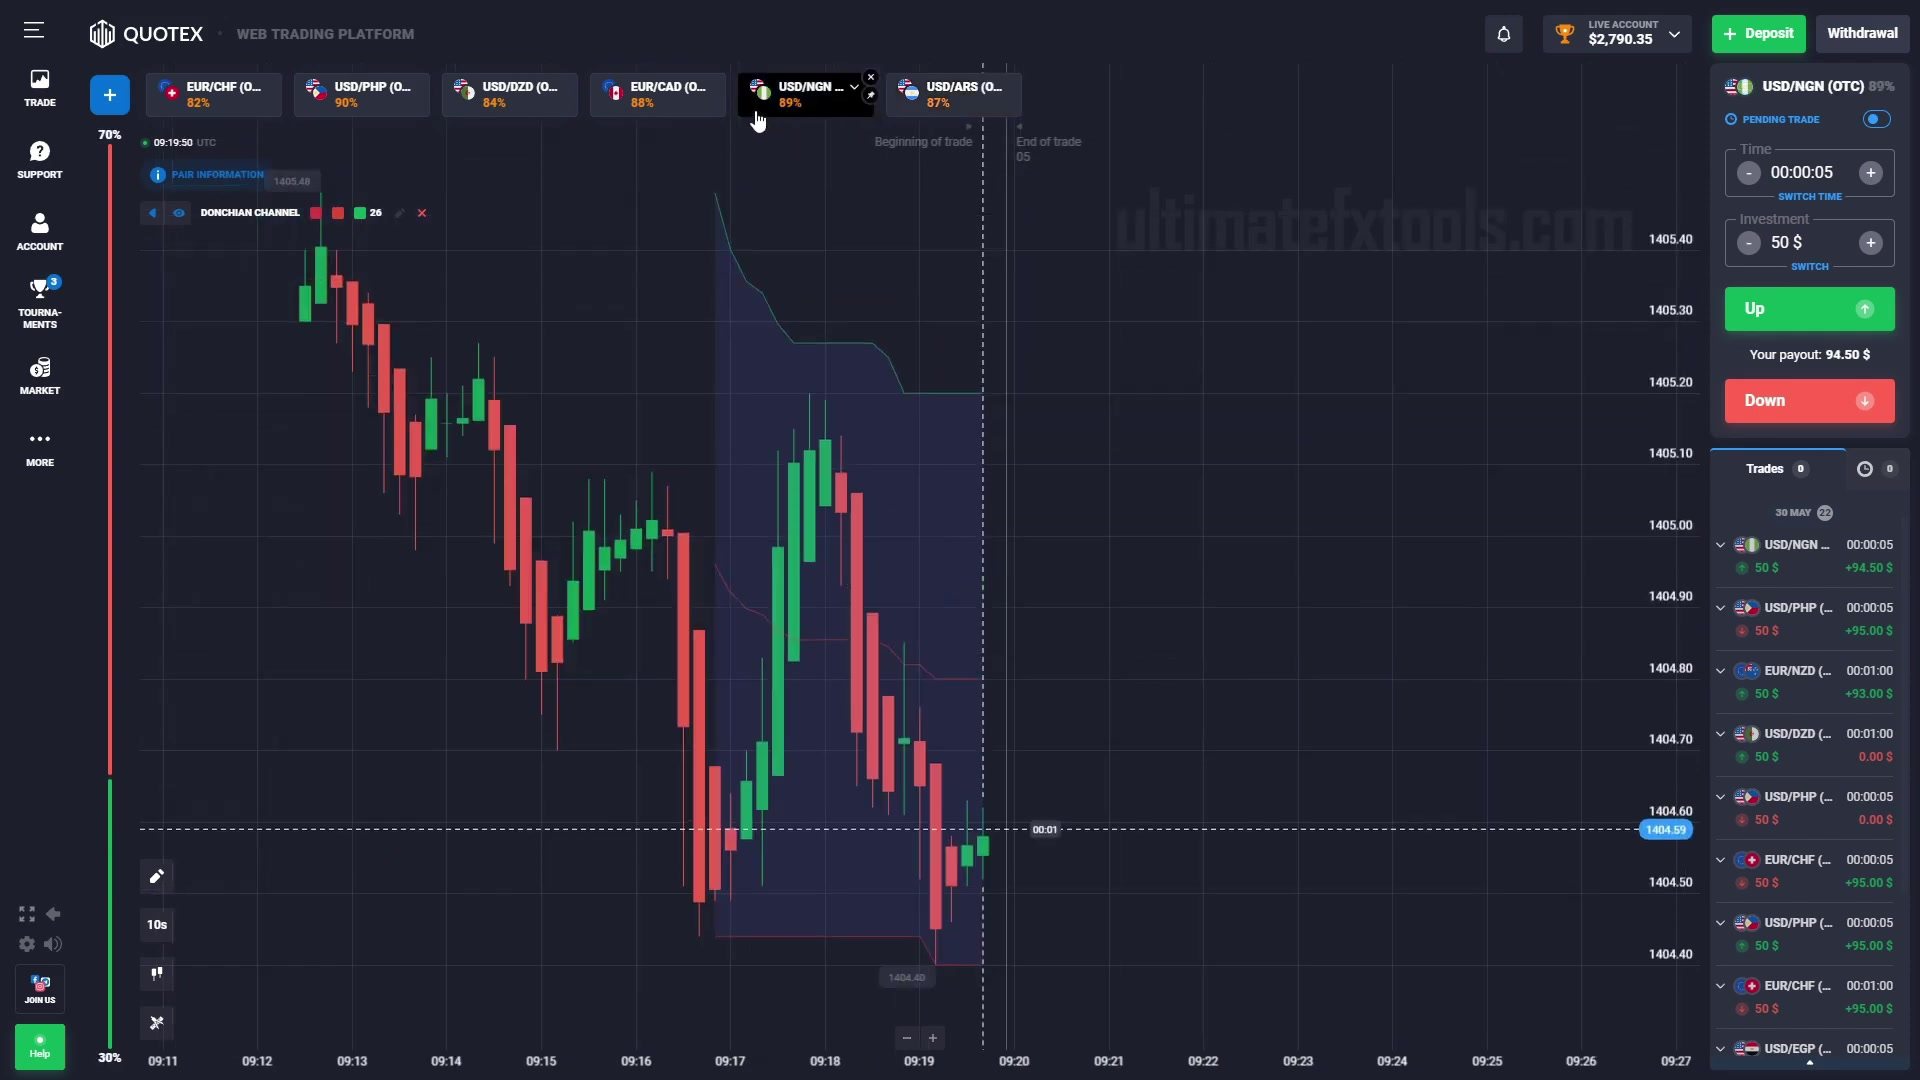
- After a decline, price sits near the lower band.
- A red candle is followed by three consecutive small green bars — sellers still pressing, but no longer making new lows.
- Enter Up after the third green bar, 5-second expiry.
This is the patient version of Entry 2: instead of buying the spike, it waits for the sell pressure to visibly stall. Smaller candles near an extreme are the tell — momentum has run out before price has moved away.
The maths a 5-second trade has to clear
At an 89% payout, a win pays +$44.50 on the $50 stake and a loss costs the full $50, so break-even is 1 ÷ 1.89 ≈ 52.9% of decided trades. The pairs in this session paid between 81% and 92%, which moves break-even between roughly 52.1% and 55.2%. That spread is worth acting on: the same touch on a 92% pair needs three fewer winners per hundred trades than on an 81% pair, so taking the identical signal on the better-paying pair is free edge.
The session's own numbers — losses included
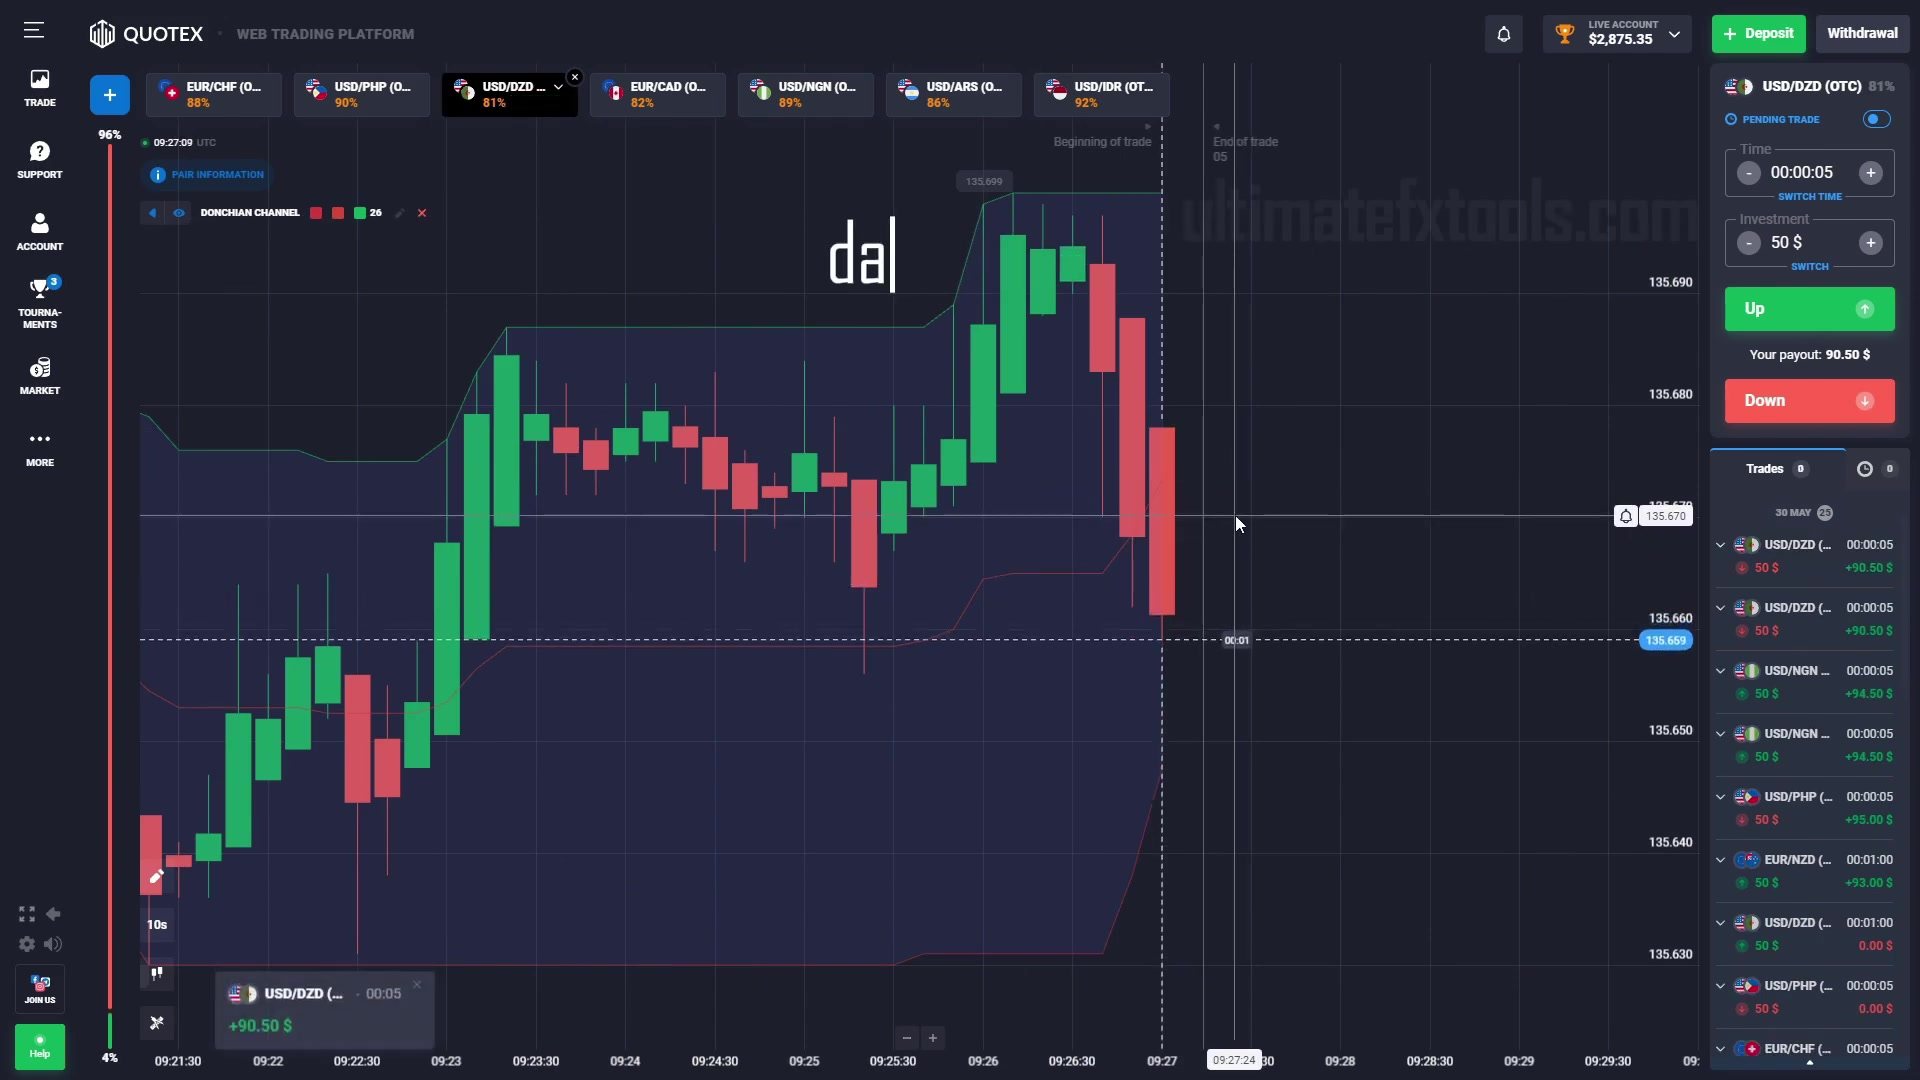
The trade panel in the recording shows wins of +$90.50 to +$95.50 per $50 stake across USD/DZD, USD/NGN, USD/PHP, USD/EGP, EUR/CHF and EUR/NZD — and it also shows 0.00 results on USD/DZD and USD/PHP: full losses, left in the recording. The visible balance climbs from about $2,745 to $2,875 over the recorded stretch, roughly +$130 net of those losses.
Read that honestly: it is a short winning sample, not a track record. A few dozen trades cannot establish a long-run edge at a 52.9% break-even — the session demonstrates the entries, nothing more. Note also that the history shows a couple of 1-minute trades from before the recording (EUR/NZD, EUR/CHF) — the 5-second method is what the video actually demonstrates.
When to stand aside
Do not fade an expanding channel. A Donchian band only moves when price makes a new extreme — so in a strong push, the band steps outward candle after candle and every “touch” is a fresh breakout, not a stretched extreme. The fade logic needs a flat band: price returning to an old extreme. The 0.00 trades in the session log look exactly like touches taken while the band was still stepping — which makes “is the band flat?” the single most useful filter you can add to this method.
- News and volatile opens: a 5-second expiry gives a spike no time to settle; scheduled news makes band touches meaningless.
- Payout below ~85%: the break-even climbs fast at the bottom of the payout range. If the pair pays 81%, find another pair.
- After two consecutive losses: stop. At this speed, revenge trading empties an account faster than any other timeframe.
Our rating: 4 out of 5
4 out of 5. What earns it: one indicator with a physically meaningful reading, three entries that are genuinely distinct rather than restatements of each other, a flat stake with no martingale, and a session recording that leaves its losses visible. What holds it back: the 5-second horizon is the least forgiving in short-term trading — entries are intra-candle with no time to reconsider, spreads of attention matter as much as spreads of price, and the strategy gives no explicit rule for the expanding-channel condition that produced its losses. Treat the flat-band filter above as mandatory, not optional.
Frequently asked questions
What does the Donchian Channel period 26 actually measure here?
On 10-second candles, a 26-period Donchian Channel draws the highest high and lowest low of the last 26 bars — roughly the last four and a half minutes. The upper band is the most recent short-term extreme on the buy side, the lower band on the sell side. Nothing is averaged or smoothed: the bands are the recent extremes, which is why a touch means price is at the edge of everything it has done in the last few minutes.
Why does a 5-second expiry pair with 10-second candles?
Because the trade settles inside the candle it was placed on, or at the very start of the next one. The strategy is betting on an immediate snap-back from a band touch, and a 5-second expiry only needs the first tick of that reaction. It also means the entry cannot wait for a candle to close — the decision is made intra-candle, at the touch, which is what makes this style fast and unforgiving in equal measure.
What win rate does this need to break even?
At an 89% payout, break-even is 1 divided by 1.89 — about 52.9% of decided trades. The pairs in the session paid between 81% and 92%, so break-even ranges from roughly 52.1% at the top payout to 55.2% at the bottom. That is why pair selection matters: the identical entry on an 81% pair needs three more winners out of every hundred than it does on a 92% pair.
Did the session in the video win every trade?
No, and the trade panel shows it. Alongside the wins of +90.50 to +95.50 per $50 stake there are 0.00 results on USD/DZD and USD/PHP — full losses. The balance still climbed from about $2,745 to $2,875 during the recorded stretch, but that is a short sample, and a run of a few dozen trades proves nothing about a long-run edge either way.
When should this setup NOT be traded?
When the channel is expanding. A Donchian band moves when price makes a new extreme, so during a strong push the band steps outward candle after candle and every touch is a fresh breakout, not an edge to fade. The fade logic only makes sense when the band is flat — price reaching back to an old extreme — and the 0.00 trades in the session log look exactly like touches taken while the market was still trending.
Related tools
The channel-touch idea in this method is the same family of logic our MT4/MT5 channel indicators are built on — they are in the indicator library. To watch indicators like these read live markets without installing MetaTrader, the Signals web app (a month of it is included with the $39 package) runs them in the browser, including a scanner that reads every indicator across every market at once.
Risk note. This content is for educational purposes only. Trading involves risk. Past results do not guarantee future outcomes. Always practice responsible money management — limit the number of trades you take in a day, keep stakes small relative to your balance, and never trade money you cannot afford to lose. The session shown is a short sample; nothing here is a claim about future win rates.