A Session That Checks Every Alert Twice
Most signal videos show an alert, a click and a green result. This one shows the part in between: what the trader looks at after the alert pops and before the trade is placed. Every signal in the clip is checked two ways — does the PipGems gauge agree with it right now, and how often has this exact signal closed green over the last 30 days in this time window? One of the four entries is taken against the gauge on the strength of its history, and it loses. That makes this a more useful clip than a clean run of wins would have been.
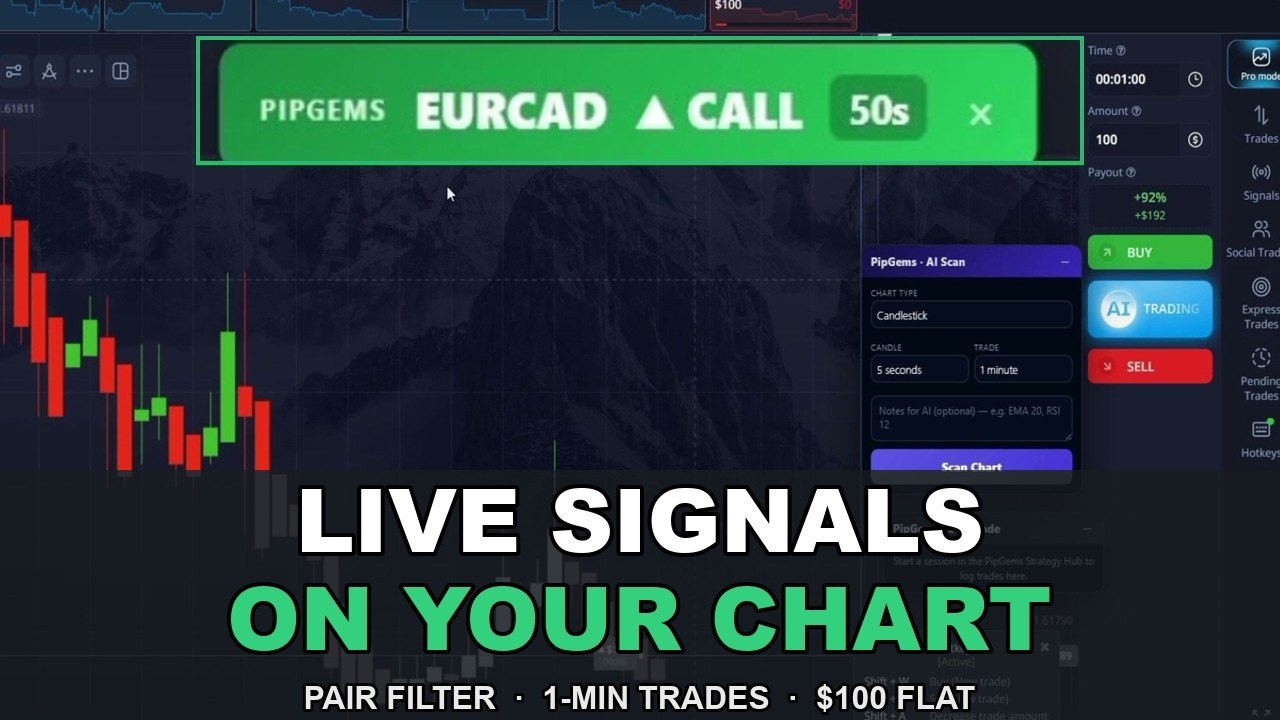
The session is on a Pocket Option real account in Pro mode, on non-OTC pairs only, with 1-minute trades and a flat $100 per entry. The vertical clip is the first three minutes of a longer live session; the full 12-minute video is on the same channel, and part two logs the other nine minutes entry by entry.
The Setup, Exactly as Shown
- Platform: Pocket Option, real account, Pro mode, desktop
- Markets: non-OTC forex pairs only — the OTC feed is deliberately left out
- Trade duration: 1 minute on every entry
- Stake: $100 per entry (the recovery step uses three $100 entries, not one $300 — more on that below)
- Payouts on screen: 81% to 92% depending on the pair — EUR/USD paid 86–89%, GBP/CHF 83%, CHF/JPY 92%
- Signals: the PipGems AI signals, with the Pair Filter and the Gauge panels open beside the chart
Step 1: Sync the Pair Filter with the Chart Tabs
The first minute of the clip is housekeeping, and it is the step most people skip. The trader opens the chart tabs for the pairs he wants to trade — AUD/USD, USD/CAD, EUR/CHF, GBP/CHF, CAD/JPY, AUD/JPY, CHF/JPY, AUD/CAD and EUR/USD — and then opens the PipGems Pair Filter and toggles the same nine pairs on. The panel confirms it: “Alerting 9 pairs”.
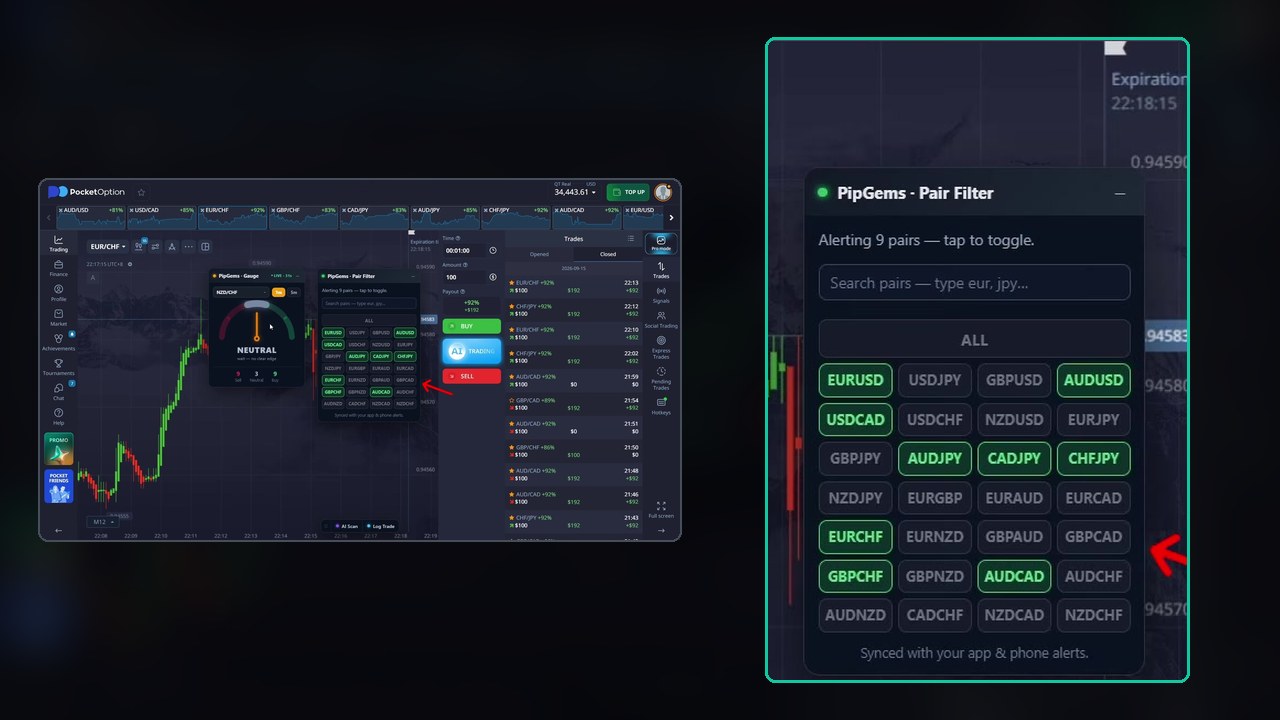
Why bother? Because an alert on a pair you do not have open is an alert you will react to late, and on a 1-minute trade a late entry is a different trade. Keeping the filter and the open tabs in sync means that when a signal fires, the chart is one click away and the payout for that pair is already visible in the tab strip. The Gauge is left open too, but the narration is clear that it is optional here — the signals are the trigger, the gauge is a check.
Step 2: The Two-Part Check Before Every Entry
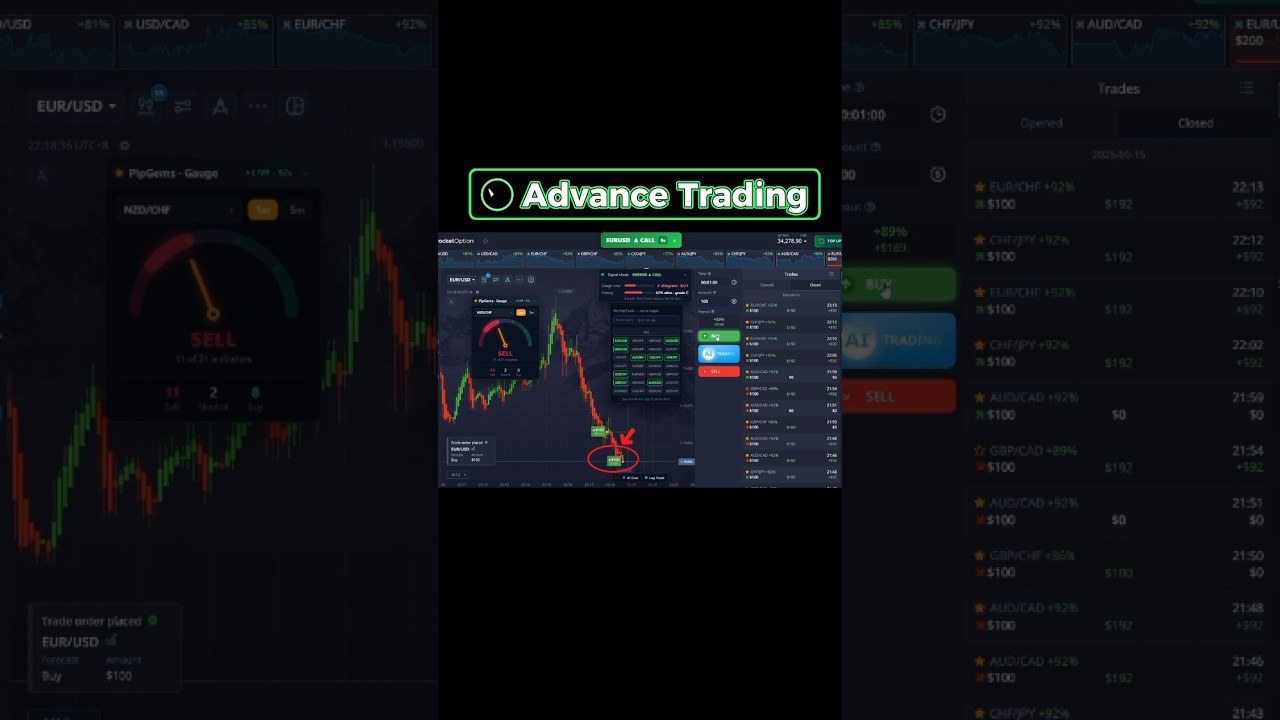
At 22:18 the first alert lands: EUR/USD CALL, 1 minute. The chart shows price has just dropped hard, so the signal is calling for a bounce. Before clicking, the trader opens the Signal check card that comes with the alert. It shows two things:
- Gauge now: ✗ disagrees — 8 of 21 indicators, pointing to sell
- History: 62% wins, grade C — “this pair, this 3-hour window, last 30 days”
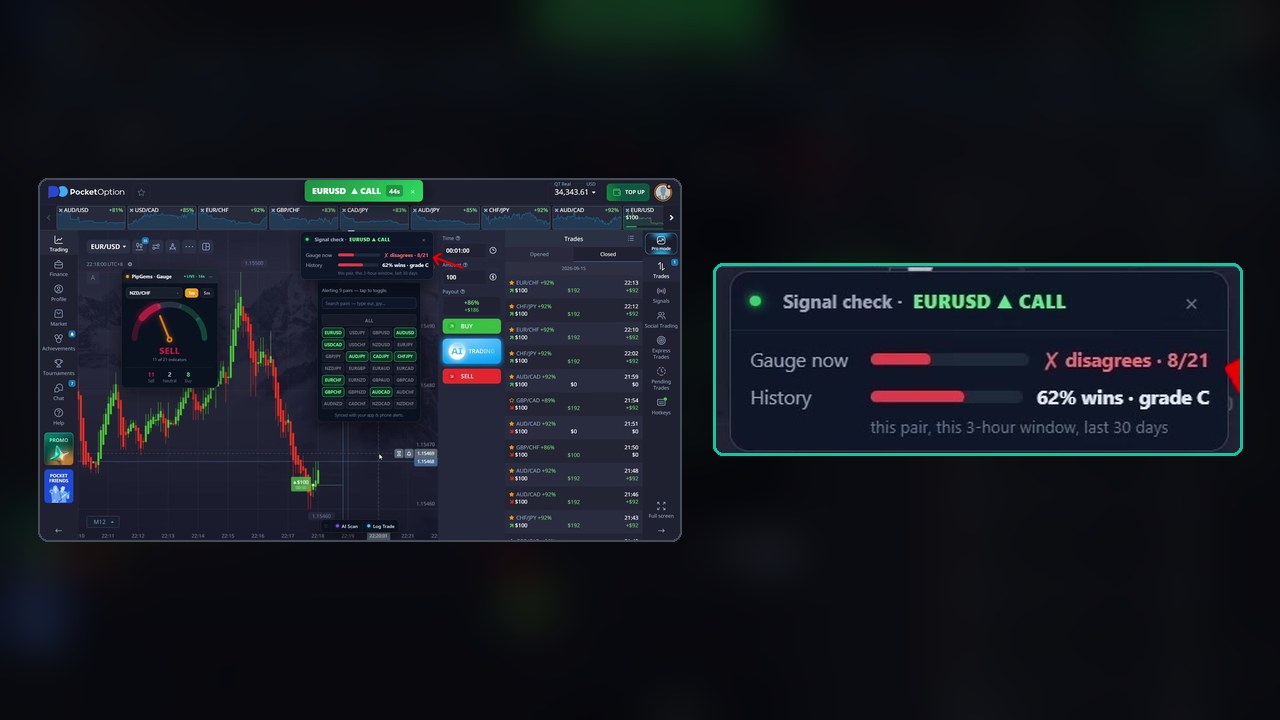
That is a genuinely mixed reading. The live gauge says the moment is bearish; the history says this particular signal, at this hour, has closed green about six times in ten. The trader goes with the history, calls it “pretty solid”, and takes the CALL at $100.
It closes red. The trades list shows the entry at 22:18 with a $0 return. Nothing in the clip pretends otherwise, and the narration pauses right there for the usual reminder about demo accounts and affordable losses.
Step 3: The Recovery — and Why You Should Read This Part Slowly
Before the first trade has even settled, the trader places three more $100 CALL entries on EUR/USD, a few seconds apart. The narration calls this the Martingale method: if the market does move up, three winning entries recover the earlier loss and leave a profit.
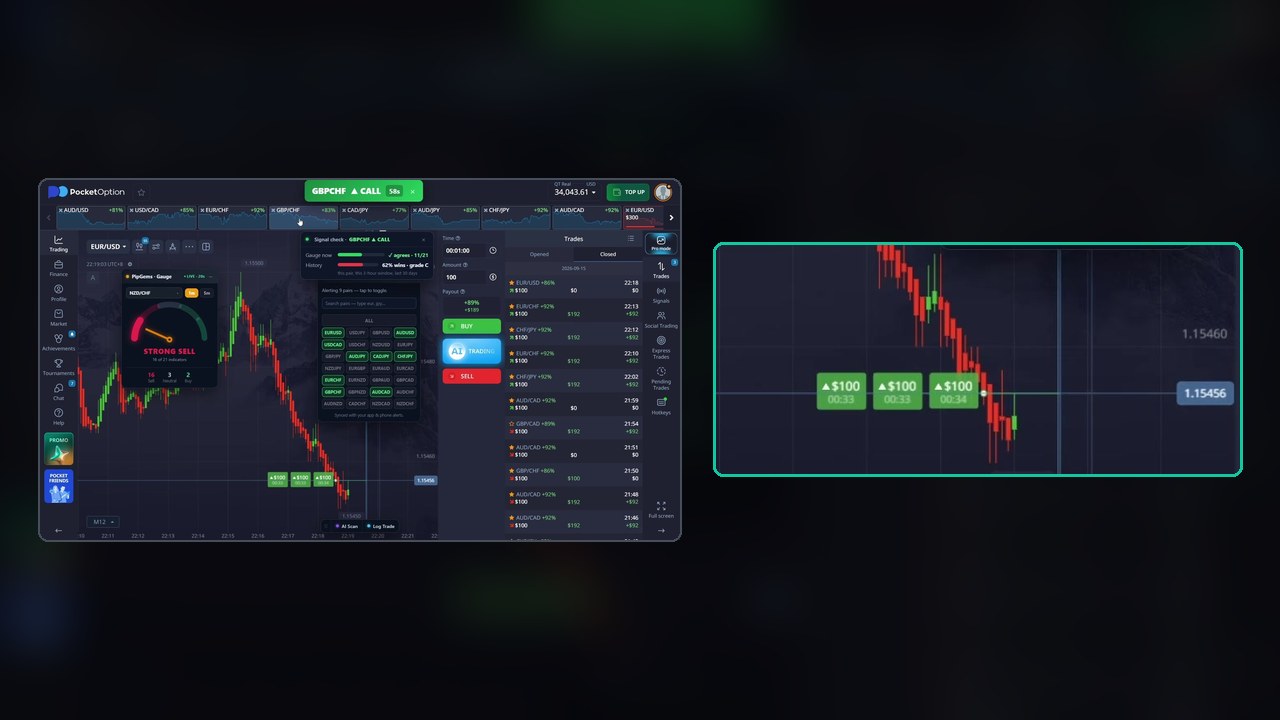
Here it worked. All three closed green at 89%, paying $189 each — $567 back on $300 staked, a profit of $267, which more than covers the $100 lost on the first entry. The clip is honest about what it is doing, so we will be equally honest about the arithmetic behind it:
- The recovery is not a new signal. It is the same CALL, on the same pair, taken again at triple the exposure after it had just failed once. The gauge that disagreed the first time still disagreed.
- Had EUR/USD kept falling for one more minute, the session would have been $400 down in about 120 seconds. That is the trade you are actually making when you stack entries: a larger bet that the second minute goes differently from the first.
- At an 89% payout you need to win roughly 53% of the time just to break even. Recovery stakes do not change that number — they only change how much a losing streak costs.
We show it because it is in the video and because it went well on camera. We do not recommend it. If you copy anything from this session, copy the two-part check, not the stacking.
Two More Alerts, Both Checked, Both Green
While the EUR/USD entries are running, a GBP/CHF CALL alert arrives. The trader takes it at $100 and it closes green at 83% — $183 back. Then a CHF/JPY PUT fires, and this time the check reads the other way:
- Gauge now: ✓ agrees — 12 of 21 indicators
- History: 67% wins, grade C in this window
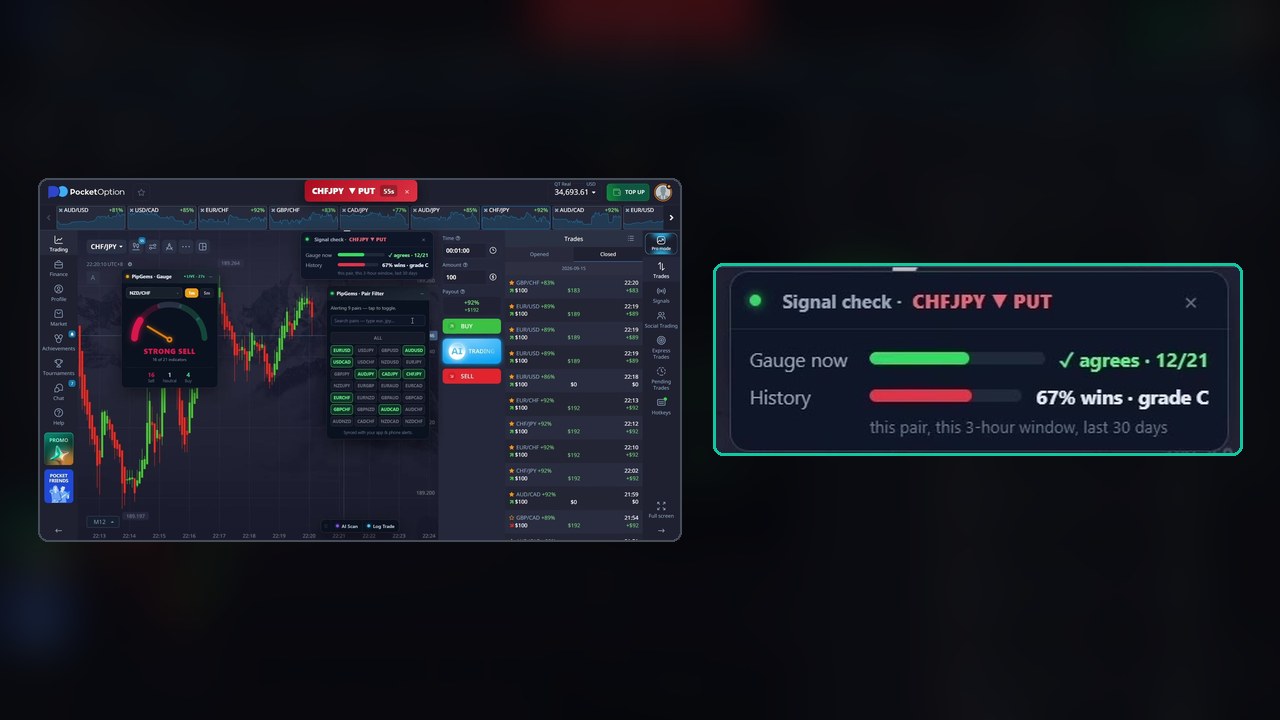
The trader then switches the Gauge panel itself to CHF/JPY as a third confirmation — it reads SELL, 13 of 21 — and takes the PUT at $100. It closes green at 92%: $192 back. That is the clearest entry in the clip: signal, gauge and history all pointing the same way, and the highest payout of the session.
The Results, Reconciled Against the Balance
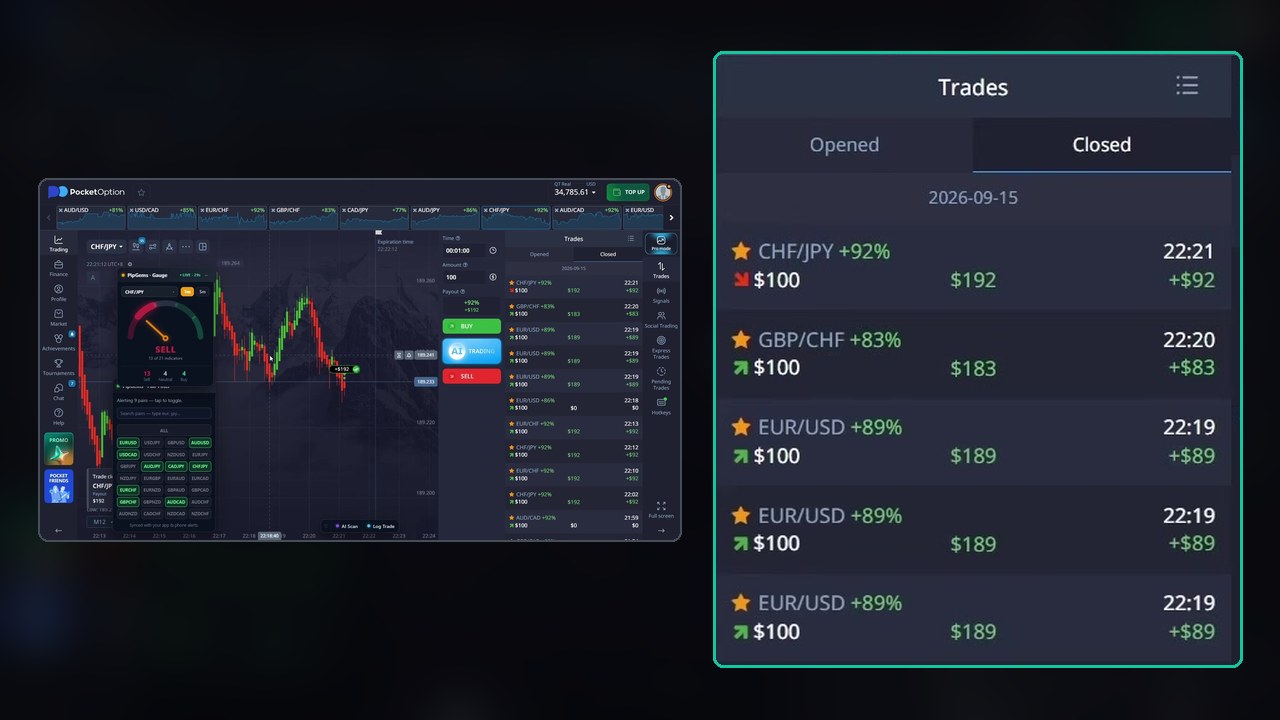
We did not take the narration’s word for the tally. The account balance is visible in the top bar throughout, and it moves from $34,443.61 at the start of the clip to $34,785.61 at the end — a net +$342.00. That matches the trades exactly: −$100 on the first EUR/USD entry, +$267 across the three recovery entries, +$83 on GBP/CHF and +$92 on CHF/JPY. Six entries, five green, one red, in about three minutes.
Look a little further down the same closed-trades list and the session before the clip is visible too: several EUR/CHF and CHF/JPY wins at 92%, but also AUD/CAD entries at $0 and a GBP/CHF that returned only the stake. The clip is a good three minutes from a longer session that was not all green. That is worth knowing before you read the +$342 as typical.
What the Clip Does Not Tell You
- What “grade C” means. Both signals taken carry a C grade with 62% and 67% histories. The card does not show the sample size behind those percentages, and a 30-day window at one hour of the day can be a small number of trades.
- There is no rule for a disagreeing gauge. The first trade is taken against the gauge and loses; the last is taken with it and wins. Two trades prove nothing, but the clip never states when a disagreement should mean skip.
- The visible Gauge panel is on NZD/CHF for most of the clip, not on the pair being traded. The agree/disagree line on the Signal check card is what is doing the work; the big dial is only switched to the traded pair for the final CHF/JPY entry.
- The recovery is the whole P&L. Without the three stacked entries the clip is −$100 +$83 +$92 = +$75 on three single trades. The headline number comes from the stake, not from the signals.
Turning It Into Rules You Can Test
- Prepare the list. Pick your non-OTC pairs, open their tabs, and toggle exactly those pairs in the Pair Filter so alerts and charts stay in sync.
- Check twice on every alert. Open the Signal check card. Note whether the gauge agrees and what the 30-day history says for this window.
- Decide your disagreement rule in advance — for example, take a signal only when the gauge agrees and history is at or above 60%. Write it down before the session, not during it.
- Flat stake, one entry per signal. Skip the stacking. Let the check, not the stake size, carry the session.
- Log every alert, taken or skipped, with its check reading and outcome. Fifty logged alerts will tell you whether “agrees + 60%” actually clears the 53% break-even. PipGems keeps a graded history per signal if you would rather not do it by hand.
Watch the Clip
Three minutes — the pair filter sync, both signal checks, the loss, the recovery and the two clean wins:
Honest Weaknesses
- Stacked recovery entries are the riskiest thing in the clip, and they produce most of its profit. That combination is exactly how a good-looking session turns into a bad week.
- 1-minute trades on major pairs are noisy. A late click after reading the card changes the entry, and the card takes a few seconds to read.
- Six entries is not a sample. Five green out of six is a nice clip and says nothing about the next fifty.
- A real account on camera raises the stakes but not the evidence. The balance math checks out; it still describes three minutes.
Risk Management
- Fix your stake before the session and keep it flat — no stacking, no doubling after a loss.
- Cap the number of trades per session and set a daily loss limit you stop at without exception.
- Know the break-even for the payout you are trading: about 53% at 89%, 52% at 92%, 55% at 83%.
- Run the two-part check on a demo account first and only move to real money with a logged sample behind you.
Frequently Asked Questions
What does the PipGems signal check card show?
Two readings for the alert you just received: whether the PipGems gauge currently agrees with the signal (with the indicator count, such as 12 of 21), and the signal’s win rate over the last 30 days for that pair in the current 3-hour window, with a letter grade.
Why did the first EUR/USD trade lose?
It was taken against the gauge: the card showed the gauge disagreeing at 8 of 21 while the history read 62%. The trader went with the history and the 1-minute CALL closed red. The clip does not hide it.
Is the 3x recovery step part of the strategy?
The narration presents it as a Martingale recovery, and in the clip it recovered the loss. We show it because it is in the video, not as a recommendation: a second losing minute would have cost $400, and stacking entries does not change the roughly 53% win rate needed to break even at an 89% payout.
What was the net result in the clip?
Six entries: one EUR/USD loss (−$100), three EUR/USD recovery wins at $189 each (+$267), GBP/CHF at $183 (+$83) and CHF/JPY at $192 (+$92). The account balance moved from $34,443.61 to $34,785.61, a net +$342 that matches those trades exactly.
The Verdict
4.5 out of 5. What earns it: the clip shows the decision layer most signal videos hide — the pair filter sync, the gauge-agree line, the 30-day history and grade — and it keeps the losing trade in. Every number in this write-up was read off the screen and the balance reconciles to the dollar, which is rarer than it should be.
The missing half star is the stacked recovery. It is the riskiest thing in the video and it supplies most of the profit, and the clip never states when a disagreeing gauge should mean skip. Take the two-part check, write the skip rule yourself, keep the stake flat, and let a logged sample decide.
#PocketOption #PipGems #AISignals #PairFilter #SignalCheck #1MinuteTrades #NonOTC #BinaryOptions #TradingStrategy
This content is for educational purposes only and is not financial advice. Trading involves substantial risk; you can lose some or all of your capital. No result is guaranteed and past results do not indicate future outcomes. Always practise responsible money management, limit your daily trades, and trade only what you can afford to lose.
Related reading: the payout filter explains why a 57% pair is a skip and a 92% pair is a trade, and the mobile non-OTC session runs the same signals from a phone. For everything else on this platform, see the strategy library.