The Trick Is the Trade You Don’t Take
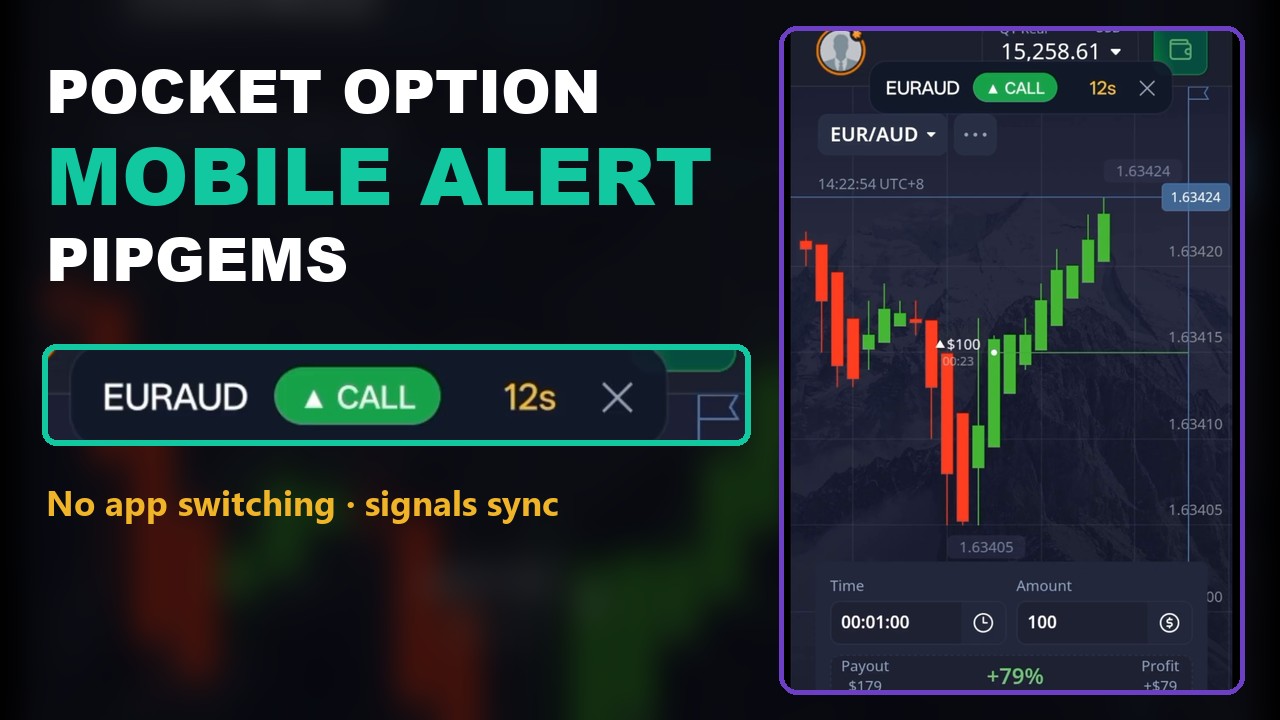
This is a short Pocket Option session recorded on a phone, using PipGems signals on the mobile app (the narration points viewers to pipgems.com for the Android APK). The signals show up as small cards on top of the chart: the pair, CALL or PUT, a countdown, and a coloured bar with a rating at real entry.
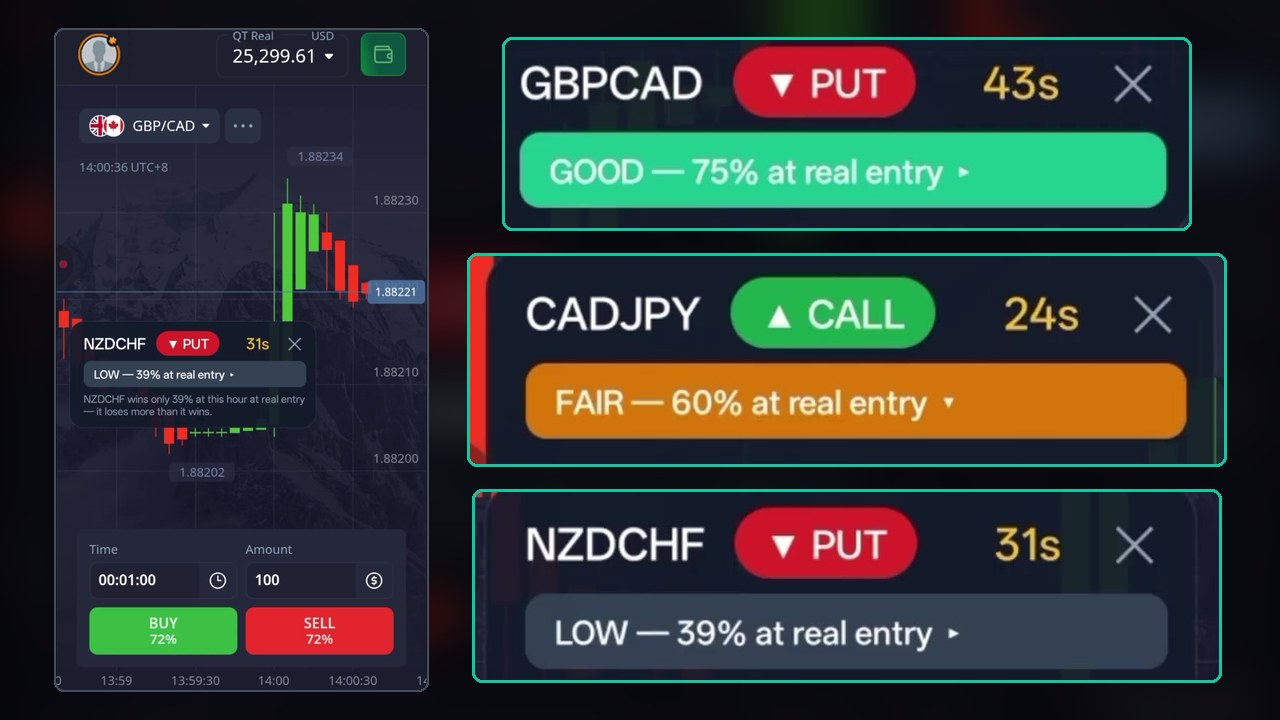
Three ratings appear in the video: GOOD (green), FAIR (orange) and LOW (grey). The trader takes three signals and lets one LOW alert go. That skip is the “trick” in the title, and it is the most useful habit in the video. The video has no settings panel and only short on-screen captions, so everything below was read off the frames and checked against the account balance.
The Setup in the Video
| Item | As shown |
|---|---|
| Platform | Pocket Option mobile app, real account (QT Real) |
| Signals | PipGems signal cards, each with a GOOD / FAIR / LOW rating at real entry |
| Pairs | EUR/JPY, GBP/CAD and CAD/JPY, all regular (non-OTC) pairs |
| Trade | 1 minute expiry, flat $100 per trade, no doubling |
| Payouts | EUR/JPY +58%, GBP/CAD +64%, CAD/JPY +84% |
Real Pairs, Even at a Lower Payout
The first thing the trader does is search for the pair from the alert. Pocket Option lists both versions: EUR/JPY OTC at +78% and the real EUR/JPY at +58%. The trader picks the real one. Later, CAD/JPY OTC pays +92% against +84% for the real pair, and again the real pair is chosen.
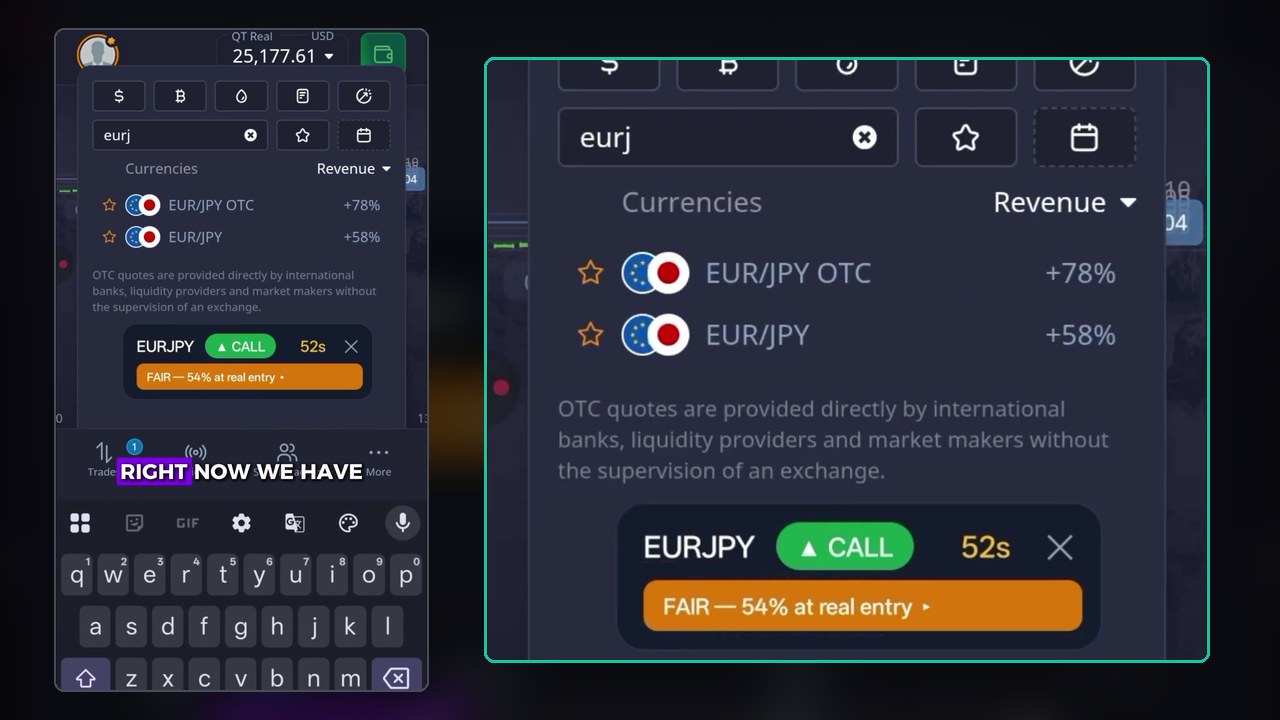
That is the right call. PipGems reads the real forex market. OTC prices are produced by the broker when the real market is closed, so a signal for EUR/JPY says nothing about EUR/JPY OTC. A higher payout on the wrong price feed is not a better trade. (The same goes for MT4 and MT5 indicators, which cannot read OTC prices at all.)
What the GOOD, FAIR and LOW Ratings Mean
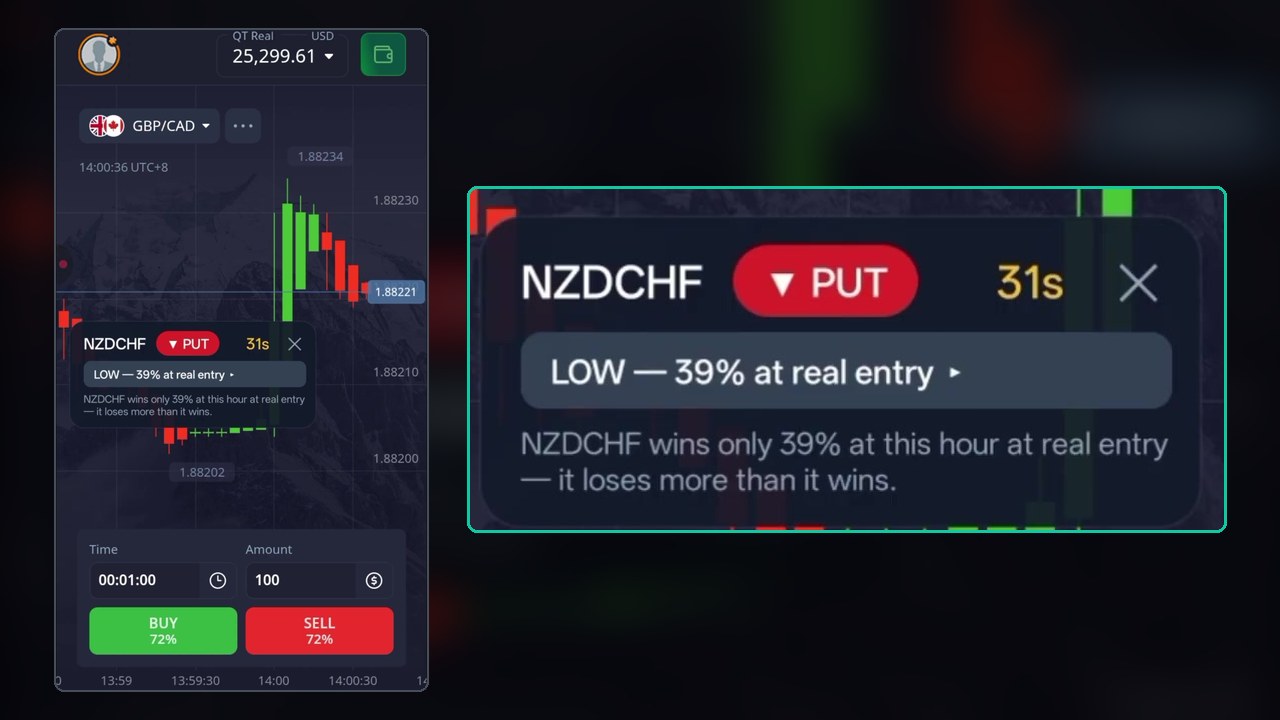
Each card carries one line such as “GOOD — 75% at real entry”. The LOW card explains itself in plain words: “NZDCHF wins only 39% at this hour at real entry — it loses more than it wins.” So the percentage is how often that signal has won, at that hour, when entered at the real price. The four ratings seen in the video:
| Pair | Signal | Rating | Payout | Break-even win rate | Action |
|---|---|---|---|---|---|
| EUR/JPY | CALL | FAIR 54% | 58% | 63% | Taken |
| GBP/CAD | PUT | GOOD 75% | 64% | 61% | Taken |
| NZD/CHF | PUT | LOW 39% | – | – | Skipped |
| CAD/JPY | CALL | FAIR 60% | 84% | 54% | Taken |
The break-even column is the part most traders skip. On a fixed-payout trade you need to win 1 ÷ (1 + payout) of the time just to stand still. At a 58% payout that is about 63%. By its own history, the EUR/JPY signal (54%) sat below that line. It won this time, but on the numbers it was the weakest trade of the three. GBP/CAD (75% against 61%) and CAD/JPY (60% against 54%) were above theirs.
Reading the Card in Detail
On the CAD/JPY alert the trader taps the card open. The expanded view shows the history and the gauge behind the rating:
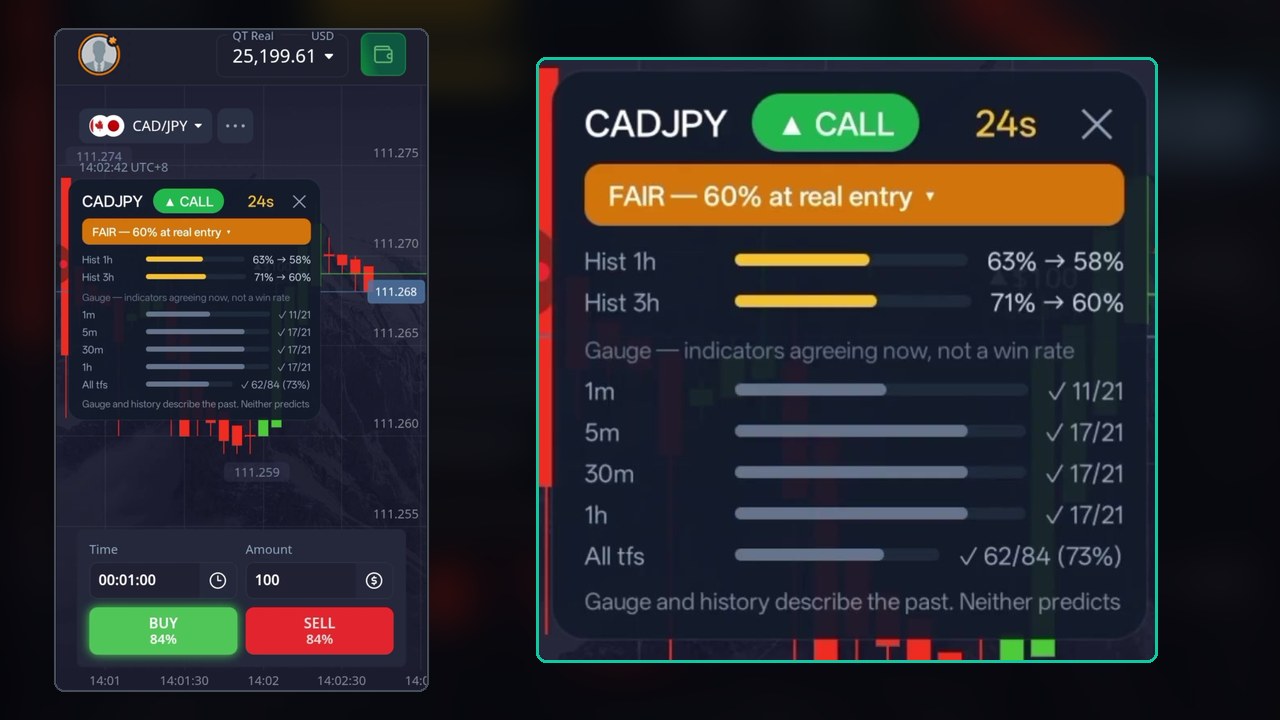
- History: 1h 63% → 58%, 3h 71% → 60%. The 60% on the FAIR bar matches the 3-hour figure.
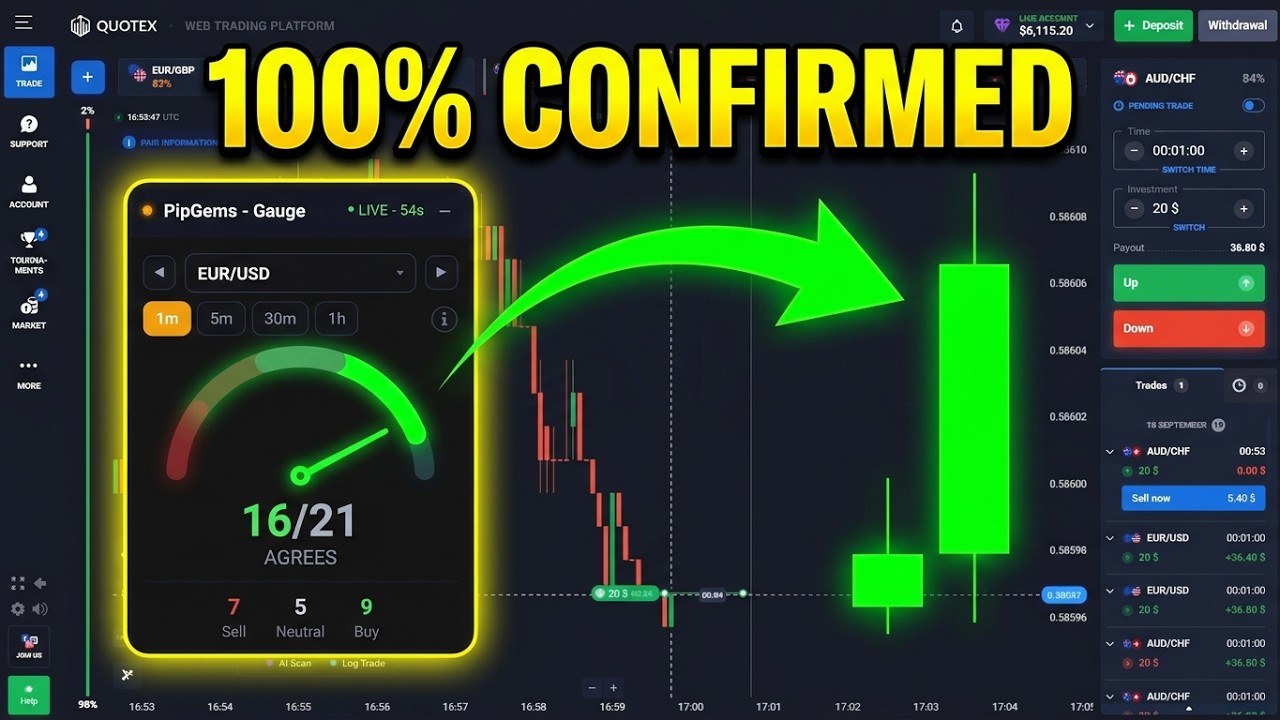
- Gauge: 11/21 indicators agree on the 1-minute chart, 17/21 on the 5-minute, 30-minute and 1-hour charts, and 62/84 (73%) across all of them.
The card labels the gauge “indicators agreeing now, not a win rate”, and its footer says plainly that gauge and history describe the past and neither predicts. Treat both as context. In this case the higher timeframes agreed with the CALL and the 1-minute chart was split, which fits a pullback inside a move up.
The Session, Trade by Trade
The balance before the first trade is 25,177.61. Each $100 trade takes $100 off when it opens and pays back $100 plus the payout on a win, so every step can be checked at the top of the screen.
| # | Pair | Direction | Rating | Balance after | Result |
|---|---|---|---|---|---|
| 1 | EUR/JPY | CALL | FAIR 54% | 25,235.61 | +$58 |
| 2 | GBP/CAD | PUT | GOOD 75% | 25,299.61 | +$64 |
| – | NZD/CHF | PUT | LOW 39% | 25,299.61 | Skipped |
| 3 | CAD/JPY | CALL | FAIR 60% | 25,383.61 | +$184 back (+$84) |
Three wins of $58, $64 and $84 add up to +$206, and the balance moves from 25,177.61 to 25,383.61, exactly $206. The tally and the balance agree.
Trade 1: EUR/JPY CALL, FAIR 54%
The alert is a CALL with a FAIR 54% rating. The caption notes that the history only shows 54%, but the short-term trend was already pointing up, so the trader went with it. The CALL closed at +$158 back on the chart (the $100 stake plus $58). A win, but on a rating below its payout’s break-even.
Trade 2: GBP/CAD PUT, GOOD 75%
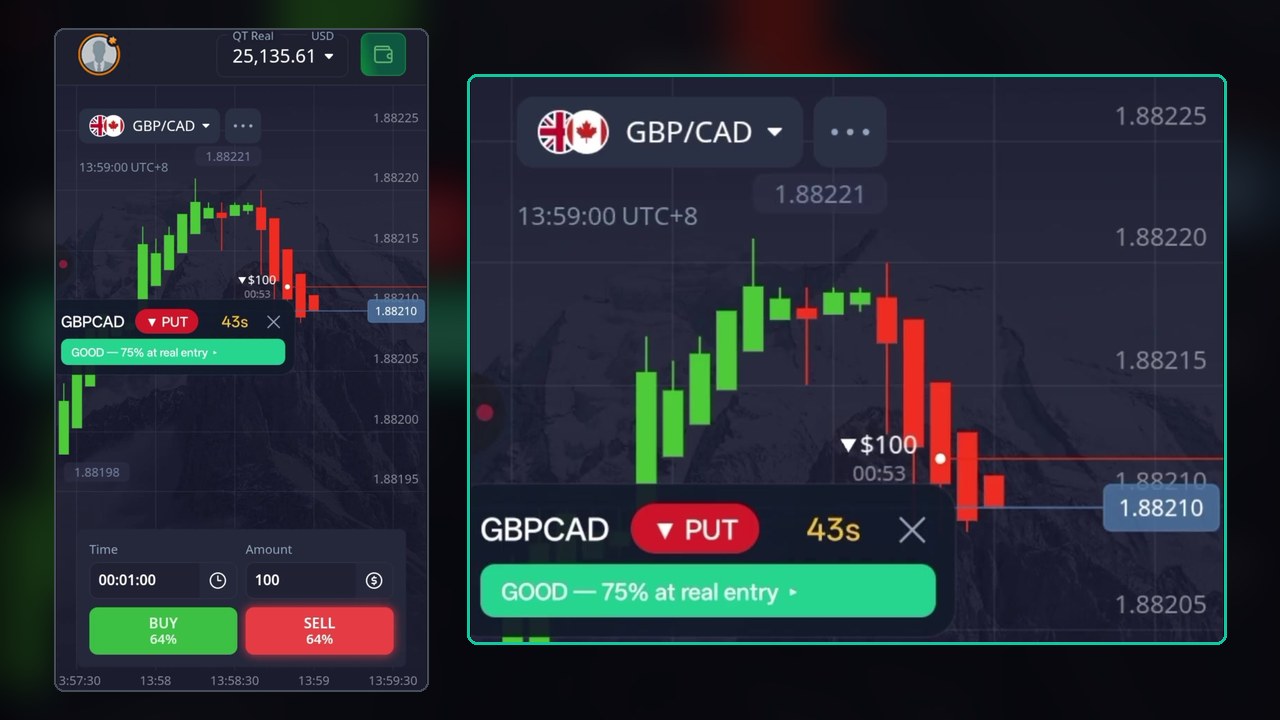
This is the strongest rating in the video. GBP/CAD had rallied and was rolling over when the PUT alert came in. The trader sold $100 with most of the card’s countdown still to run, price kept falling, and the trade returned $164.
The Skip: NZD/CHF PUT, LOW 39%
Next an NZD/CHF PUT appears, rated LOW 39%. The trader opens the asset list, looks, and then lets the countdown run out without trading. The balance stays at 25,299.61. The NZD/CHF chart is never opened, so the video cannot tell us how that PUT would have ended, and this post does not guess. What it shows is the habit: a signal that has lost more often than it has won at this hour is not worth $100, whatever its direction.
Trade 3: CAD/JPY CALL, FAIR 60%
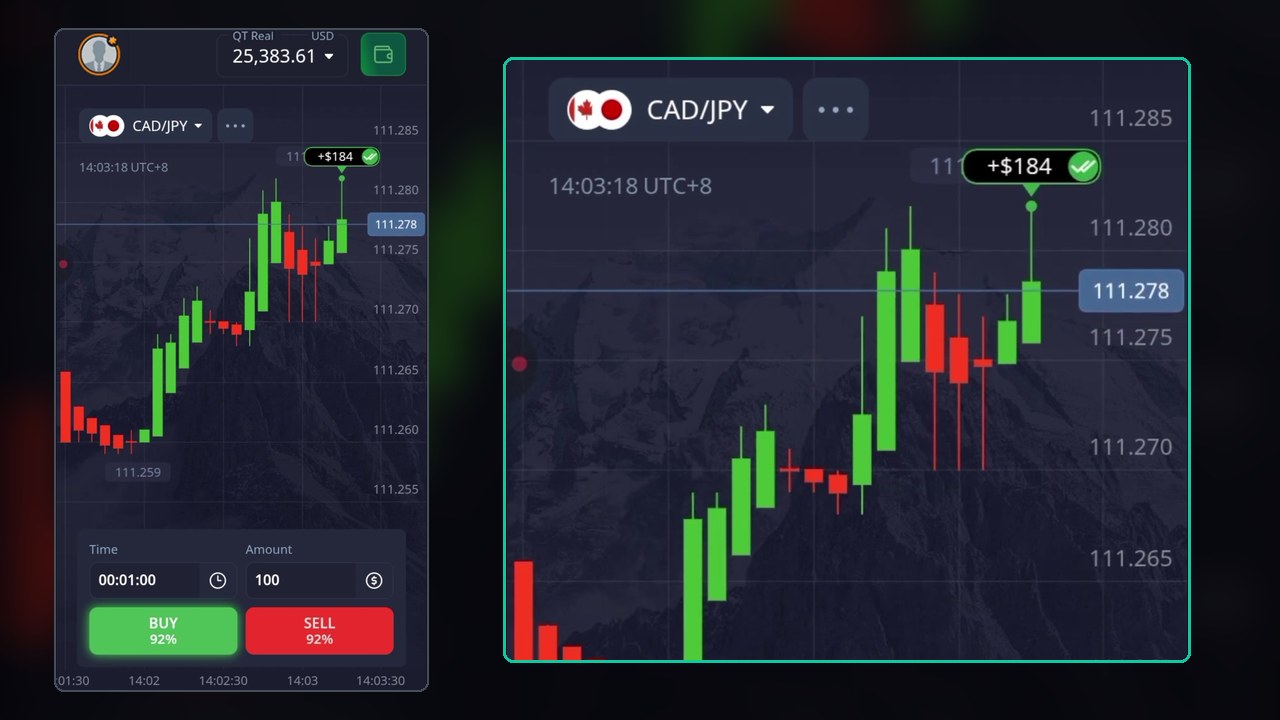
CAD/JPY had dropped hard and was turning back up. The CALL card is rated FAIR 60%, and the expanded view shows the higher timeframes agreeing. The real CAD/JPY paid +84%, and the trade closed at +$184 back, taking the balance to 25,383.61.
Video Chapters
- 0:00 Introduction, and the EUR/JPY CALL rated FAIR 54%
- 0:44 Executing the GBP/CAD PUT (GOOD 75%)
- 2:05 Skipping the low-rated NZD/CHF signal (LOW 39%)
- 3:56 Analysing the signal indicators on the CAD/JPY CALL
Watch the Video
Just over five minutes, recorded on the phone:
Limits to Keep in Mind
- Three trades is a demonstration, not a record. All three won here, but a sample this small says nothing about the long run.
- The rating is history, not a forecast. A GOOD 75% signal still loses about one time in four, if its past holds at all.
- Low payouts raise the bar. Real pairs often pay less than OTC. At 58% you need about 63% wins to break even, so a FAIR 54% signal is a losing bet on paper.
- No narration of rules. The video shows ratings and choices, not a written entry rule. The one clear rule is: skip LOW.
- Mobile only. This is the phone workflow. PipGems is a paid product, so check the plans at the PipGems page before you plan around it.
Risk Management
- Keep the stake flat. The video uses $100 on every trade, with no doubling.
- Compare every rating with the payout’s break-even before you tap, and skip anything below it.
- Set a daily loss limit and a maximum number of trades before you start, and stop when you hit either one.
- Practise on the Pocket Option demo account first, and log your own trades before risking real money.
- Binary and fixed-time trading is restricted in some countries, so check the rules where you live, and only trade money you can afford to lose.
Frequently Asked Questions
What do GOOD, FAIR and LOW mean on a PipGems signal?
They are the signal's rating at real entry. Each card shows the pair, the direction, a countdown and a bar such as GOOD 75%, FAIR 60% or LOW 39%. The percentage is how often that signal has won at real entry in its recent history. It describes the past and does not predict the next trade.
Why was the NZD/CHF signal skipped?
It was rated LOW 39% at real entry, and the card spelled it out: NZDCHF wins only 39% at this hour at real entry, so it loses more than it wins. At a normal payout you need well over 50% just to break even, so the trader let it go.
Should the rating be compared with the payout?
Yes. At a 58% payout you need to win about 63% of trades to break even, at 64% about 61%, and at 84% about 54%. In this video EUR/JPY was rated 54% at a 58% payout, which is below its break-even even though the trade won. GBP/CAD at 75% and CAD/JPY at 60% were above theirs.
Did the trades use OTC pairs?
No. The trader chose the real EUR/JPY, GBP/CAD and CAD/JPY pairs even though the OTC versions paid more (EUR/JPY OTC +78% against +58%, CAD/JPY OTC +92% against +84%). PipGems reads the real forex market, and OTC prices are generated by the broker, so the signals do not apply to OTC.
What was the result in the video?
Three $100 one-minute trades, all wins: EUR/JPY +$58, GBP/CAD +$64 and CAD/JPY +$84, for +$206. The balance went from 25,177.61 to 25,383.61, which matches the three payouts exactly. One LOW-rated NZD/CHF alert was skipped. Three trades is far too few to judge the method.
The Verdict
4 out of 5. The video shows something genuinely useful: each PipGems alert arrives with a rating at real entry, the trader sticks to real pairs instead of chasing OTC payouts, and the one LOW alert is left alone. All three results check out against the balance. It loses a point because the sample is tiny, nothing is explained out loud, and the first trade was a FAIR 54% signal on a 58% payout, which is below break-even on its own numbers.
The takeaway is simple: read the rating, compare it with the payout, and let the LOW ones go.
#PocketOption #PipGems #MobileTrading #TradingSignals #1MinuteStrategy #BinaryOptions
This content is for educational purposes only and is not financial advice. Trading involves substantial risk; you can lose some or all of your capital. No result is guaranteed and past results do not indicate future outcomes. Always practise responsible money management, limit your daily trades, and trade only what you can afford to lose.
Related reading: the payout filter post explains why a 57% pair is a skip and a 92% pair is a trade, the floating signal overlay covers the same phone setup, and Quotex + PipGems signal grades looks at how the grades held up on another platform. For more, browse the Pocket Option hub or the full strategy library. For the opposite approach, where LOW-history alerts are traded as reversals when the chart is stretched, see signal checks: low-history alerts traded as reversals.