Seven Graded Signals, and What the Grades Did
This session runs PipGems AI signals on Quotex, and every alert arrives with two numbers attached: how many of 21 indicators currently agree with it, and how often that signal has closed green for that pair in this time window over the last 30 days — expressed as a percentage and a letter grade.
That makes it an unusually testable clip. Seven signals are taken on camera with their grades visible, so we can ask the question the grade is supposed to answer: did the higher grades win?
The short answer is the reason this post exists. Both losses in the session came from the highest-graded signal on the board — 83% wins, grade A+ — while a 62% grade C won.
The Setup, Exactly as Shown
- Platform: Quotex web, live account
- Trade duration: 1 minute on every entry — $20 flat
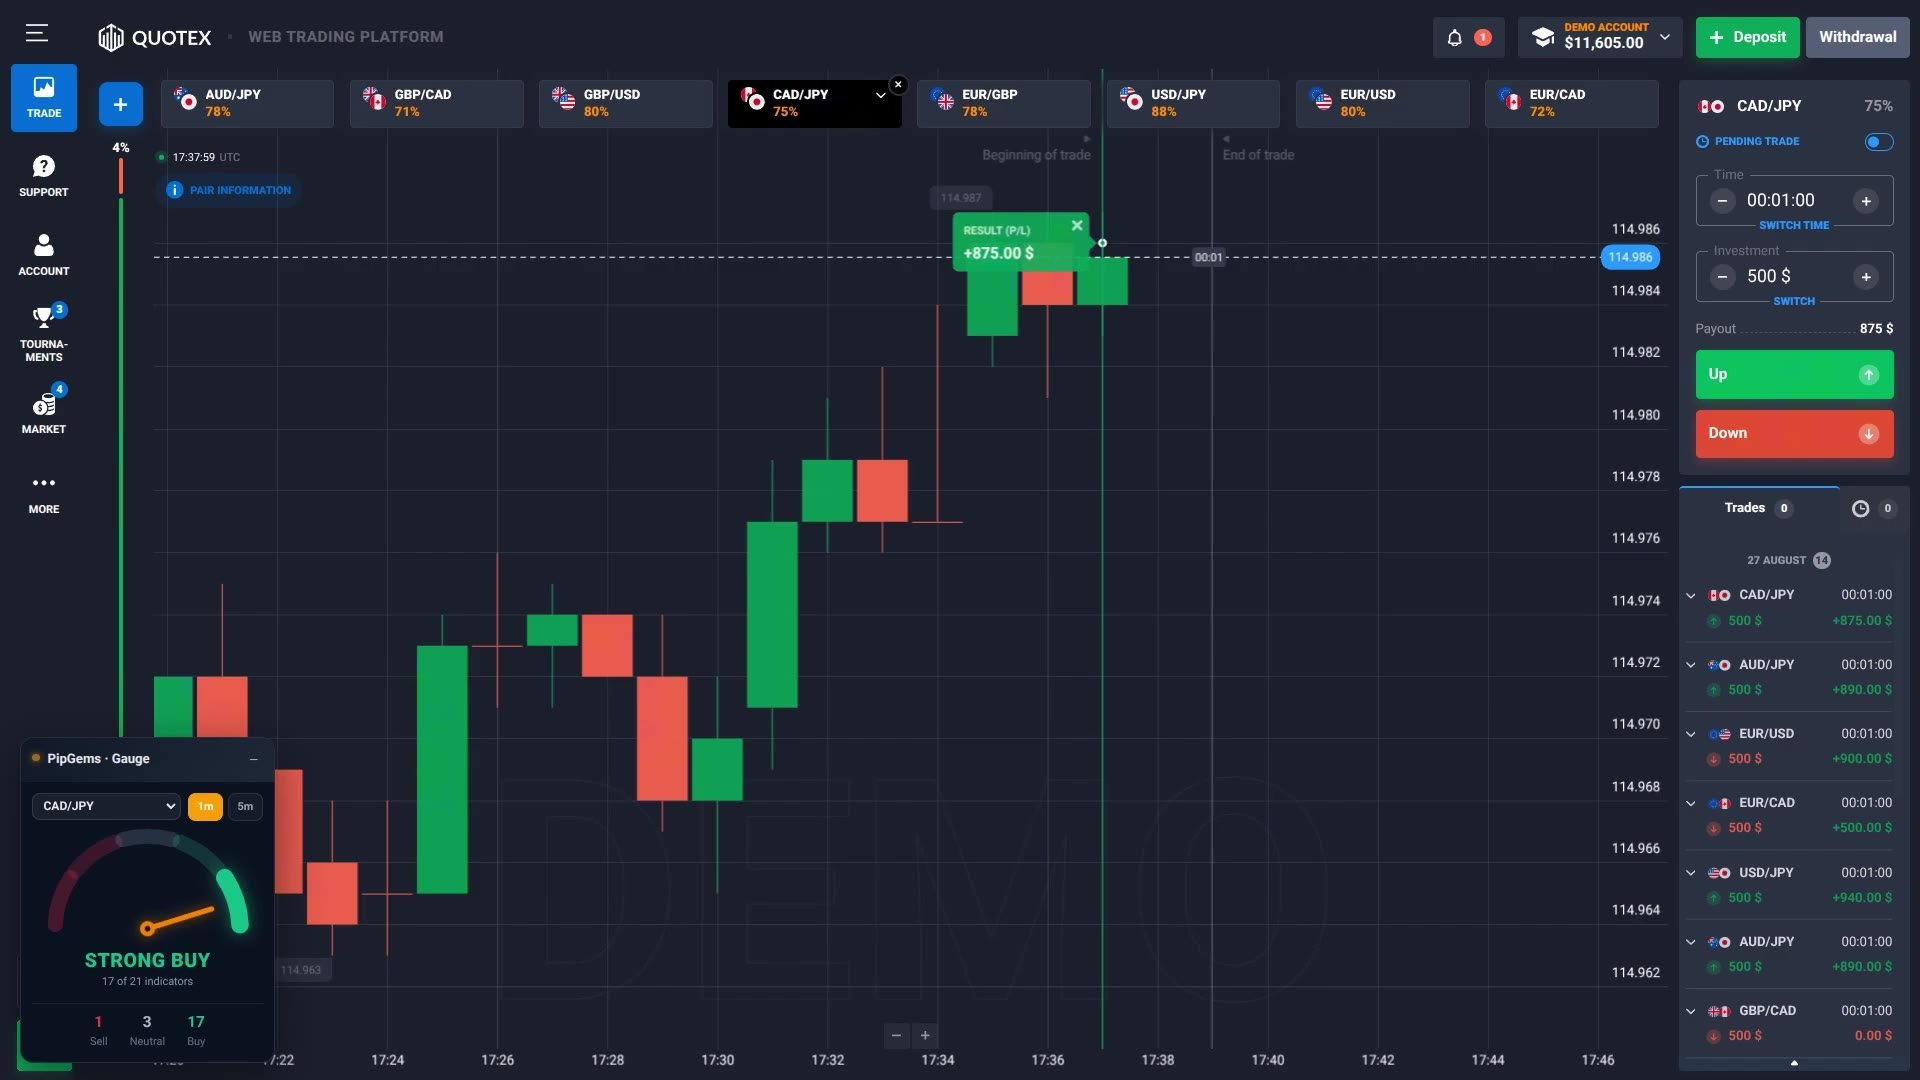
- Markets: non-OTC currency pairs, picked for payout — AUD/JPY 87%, AUD/CAD 86%, EUR/GBP and AUD/USD 85%, AUD/CHF 84%, EUR/JPY and CAD/JPY 83%, GBP/USD 80%
- Tools: the PipGems Pair Filter (nine pairs armed), the signal check card on every alert, and the Gauge panel
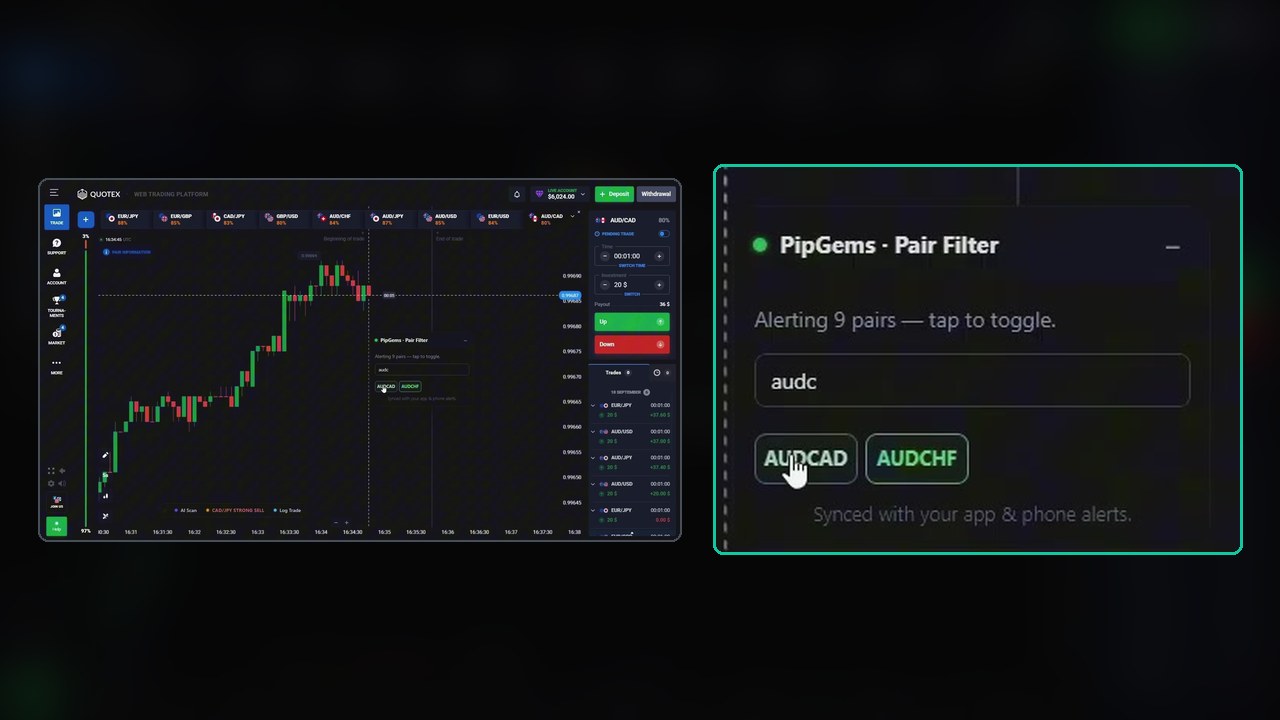
The first minute is spent adding high-payout non-OTC pairs to the chart and arming the same list in the Pair Filter, so an alert and its chart are never more than a click apart.
What the Two Numbers Mean
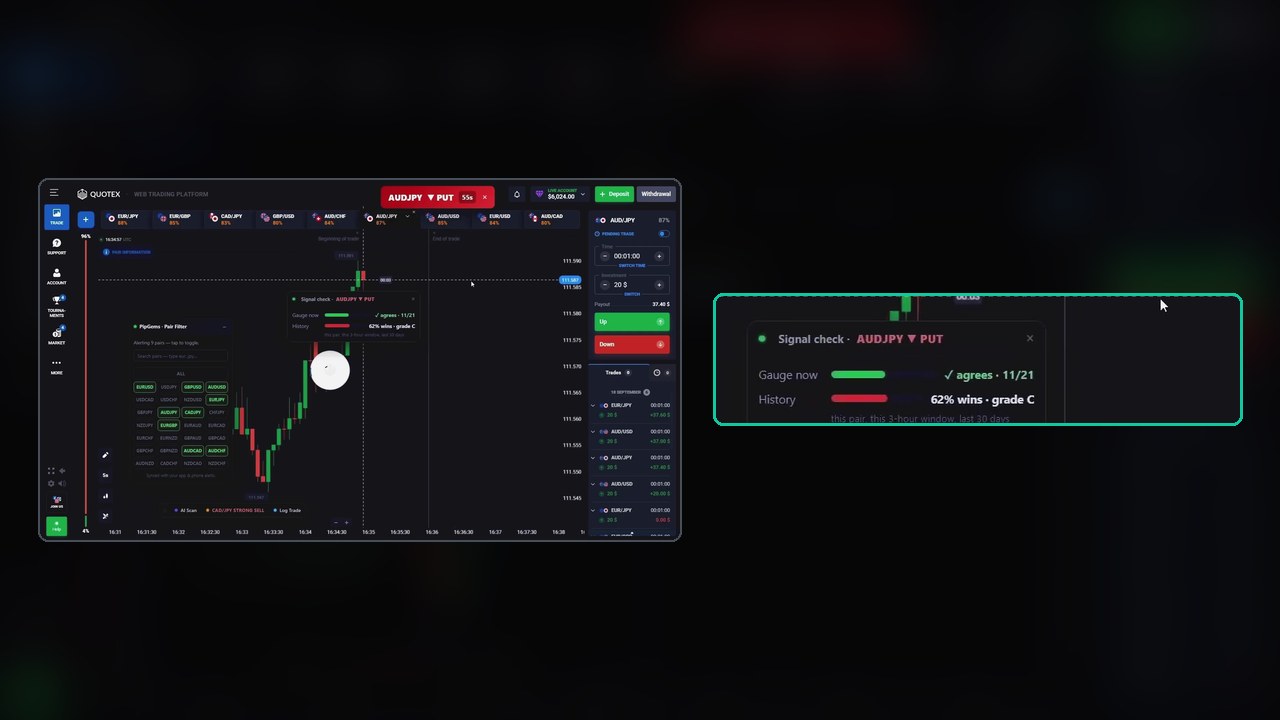
Every alert opens a card like this one:
- Gauge now — how many of the 21 indicators currently agree with the signal’s direction. Here, 11 of 21 on an AUD/JPY PUT.
- History — the win rate for this signal, on this pair, in this 3-hour window, over the last 30 days, with a letter grade. Here, 62% and a grade C.
Note what the history line is not: it is not a prediction, and the card does not show the sample size behind the percentage. A 30-day window narrowed to one pair and one three-hour slot can rest on a small number of trades, and a grade computed from a small sample moves a long way on one result.
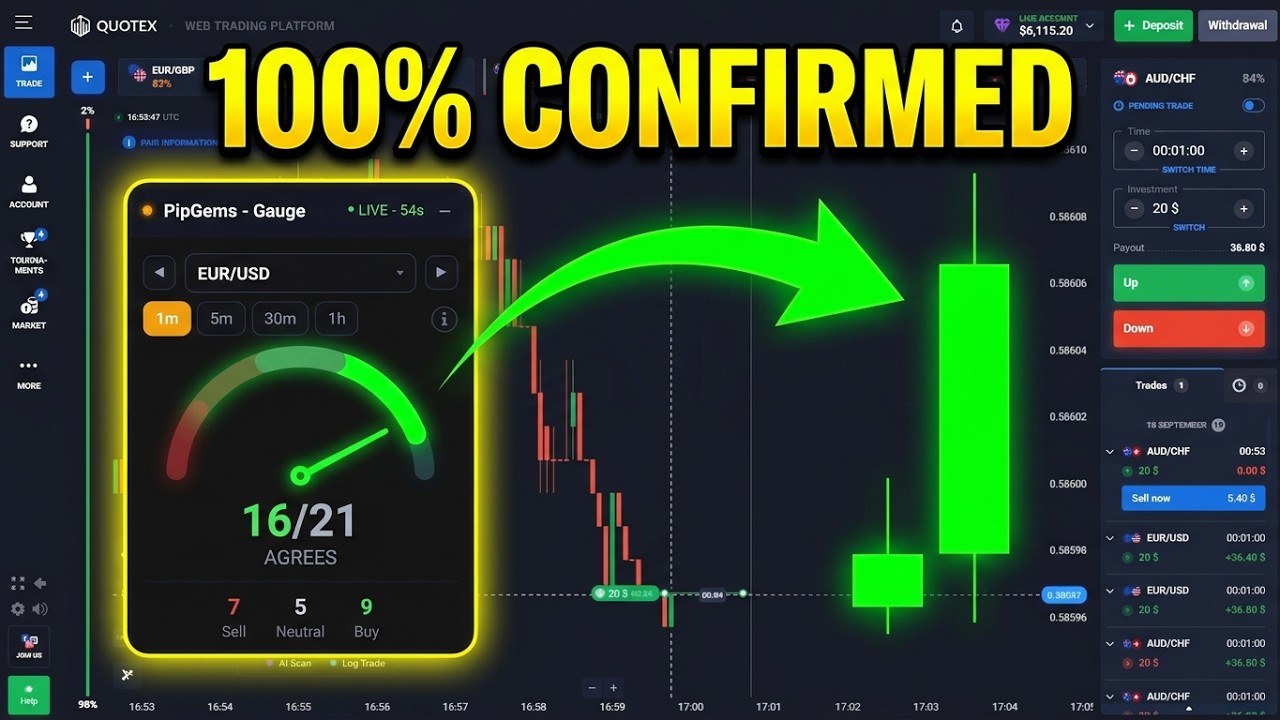
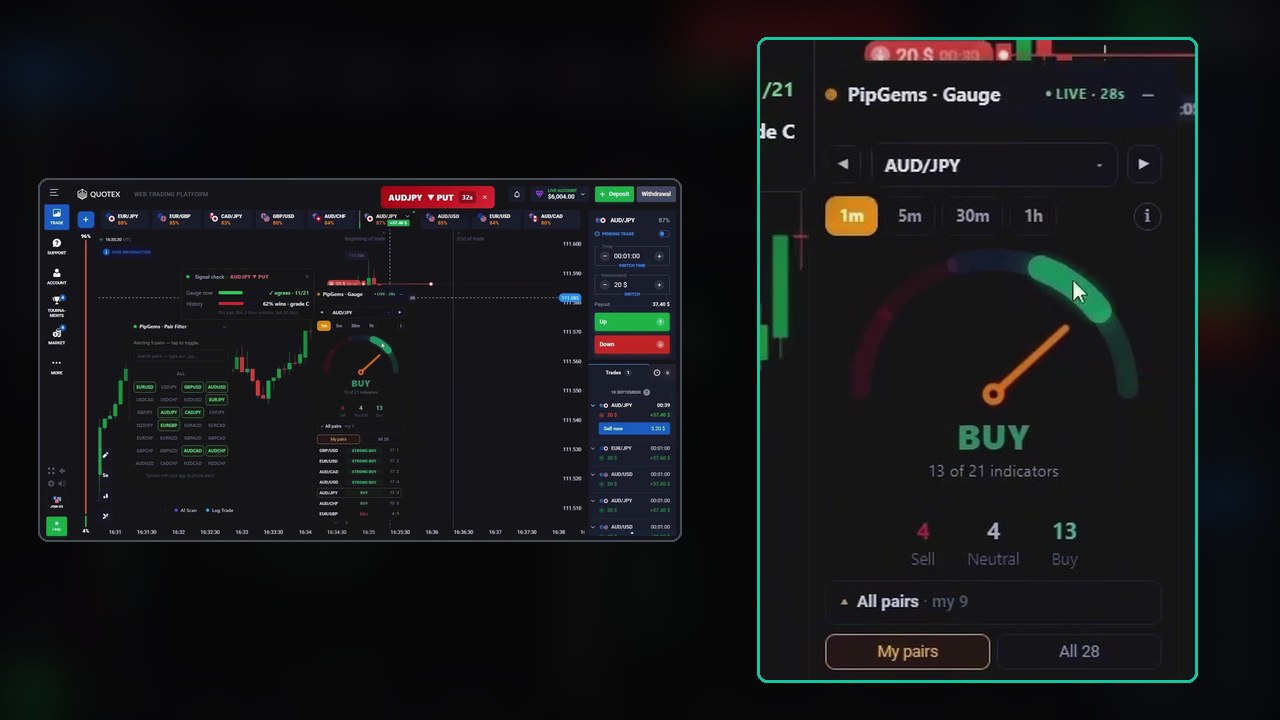
The Gauge panel is separate and optional. It reads the same 21 indicators for a chosen pair, and it switches between 1m, 5m, 30m and 1h — which is the genuinely useful part, because it shows whether the minute you are trading agrees with the hour around it.
The Seven Trades, in Order
Every figure below is read off the screen — the card at entry, and the result badge at settlement.
- AUD/JPY PUT — gauge 11/21, history 62%, grade C → won, +$37.40
- EUR/GBP CALL — gauge 8/21, history 71%, grade C → won, +$37.00
- EUR/JPY PUT — gauge 14/21, history 71%, grade C → won, +$36.60
- CAD/JPY PUT — gauge 16/21, history 80%, grade A → won, +$36.60
- AUD/CHF CALL — gauge 10/21, history 83%, grade A+ → lost, $0.00
- EUR/USD CALL — gauge 16/21, history 71%, grade C → won, +$36.80
- AUD/CHF PUT — gauge disagrees 6/21, history 83%, grade A+ → lost
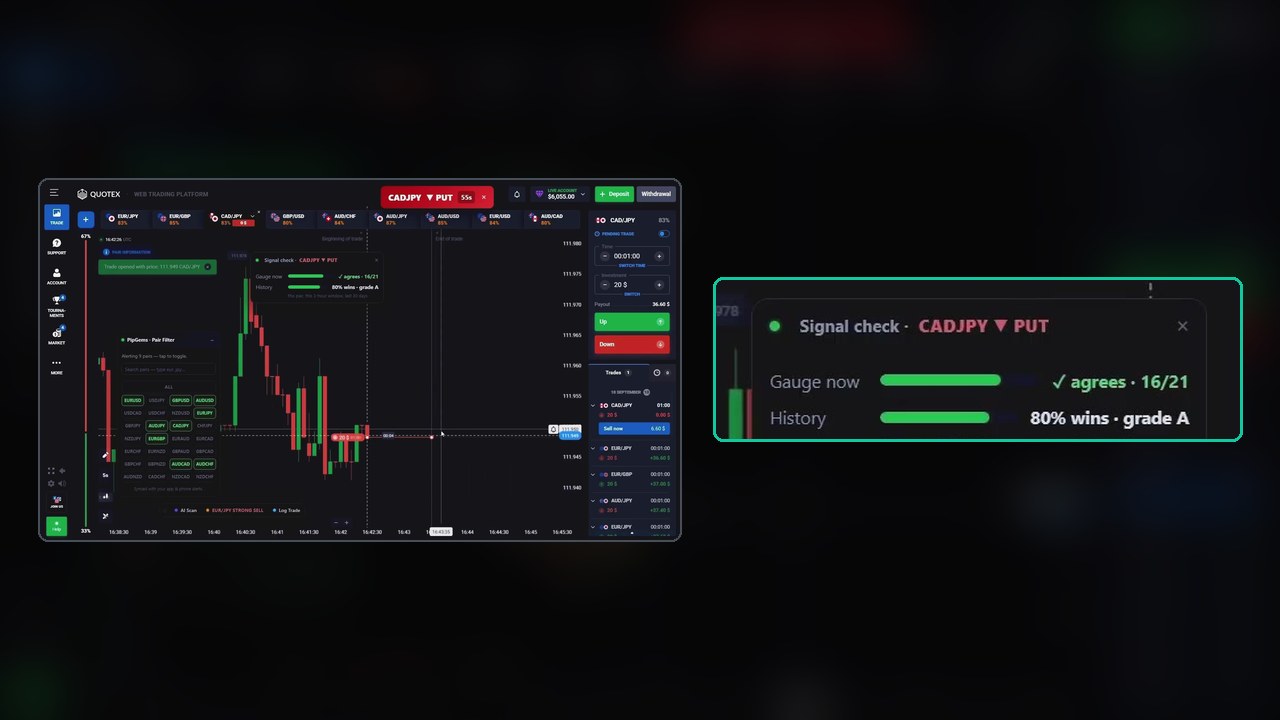
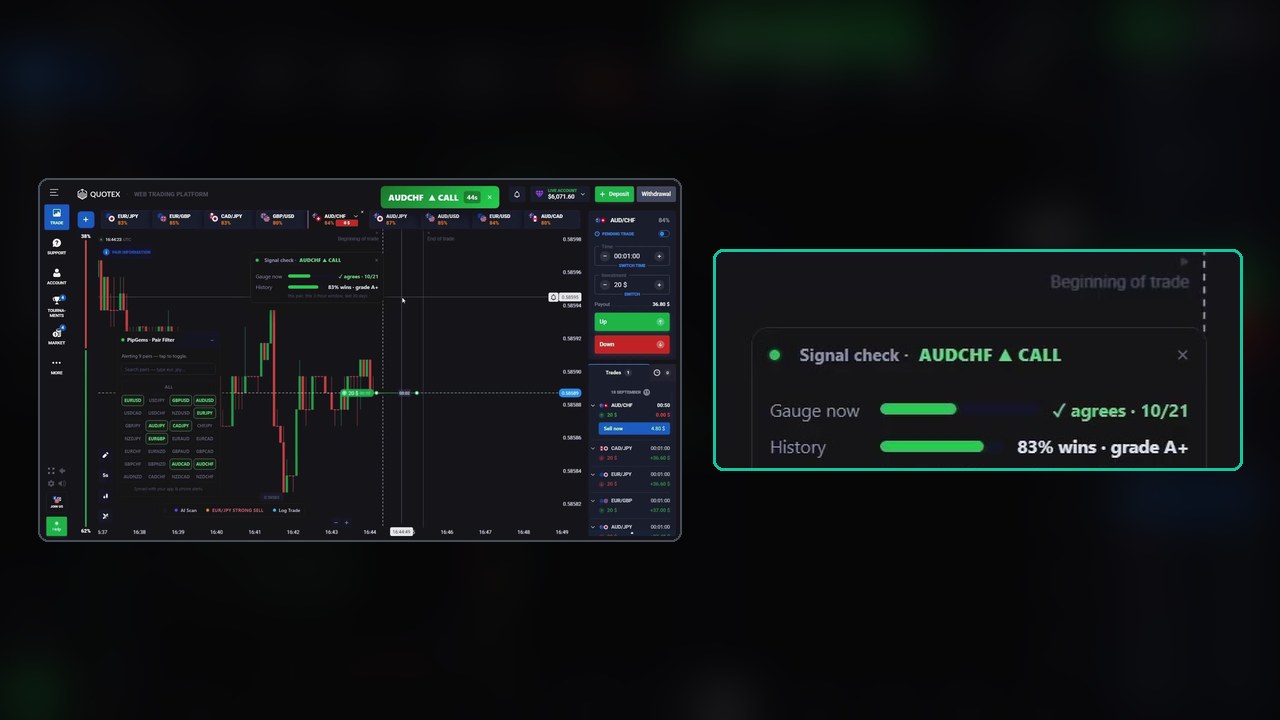
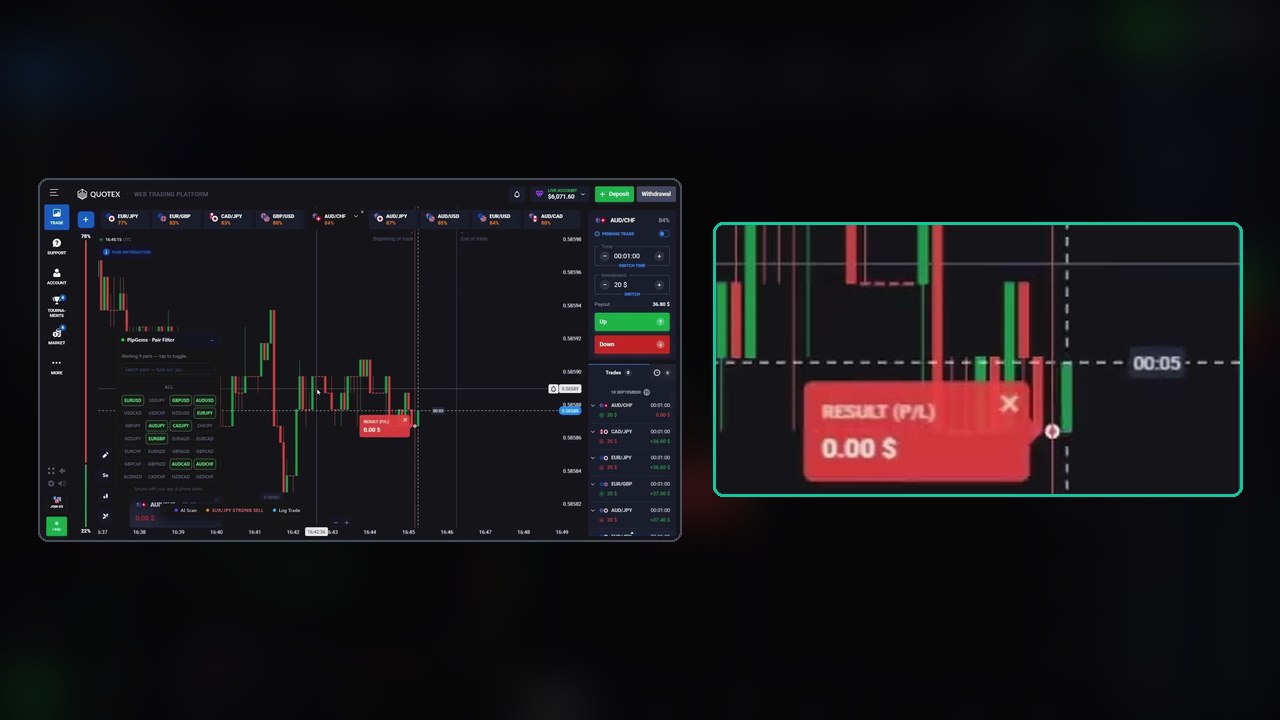
Five wins, two losses, and the grades pointed the wrong way: the A+ signal lost twice while four grade C signals won. Seven trades prove nothing about the grading system in general — but they do prove it is not a shortcut, and that is worth seeing before you start treating a letter as a guarantee.
The clearest lesson is in trade 7. The card showed the gauge disagreeing with the signal at 6 of 21, and the trade was taken on the strength of the 83% history anyway. It lost, and price moved hard against the entry. When the two numbers on the card contradict each other, the honest reading is no trade, not pick the number you like.
The Re-Entry, and Why We Are Not Recommending It
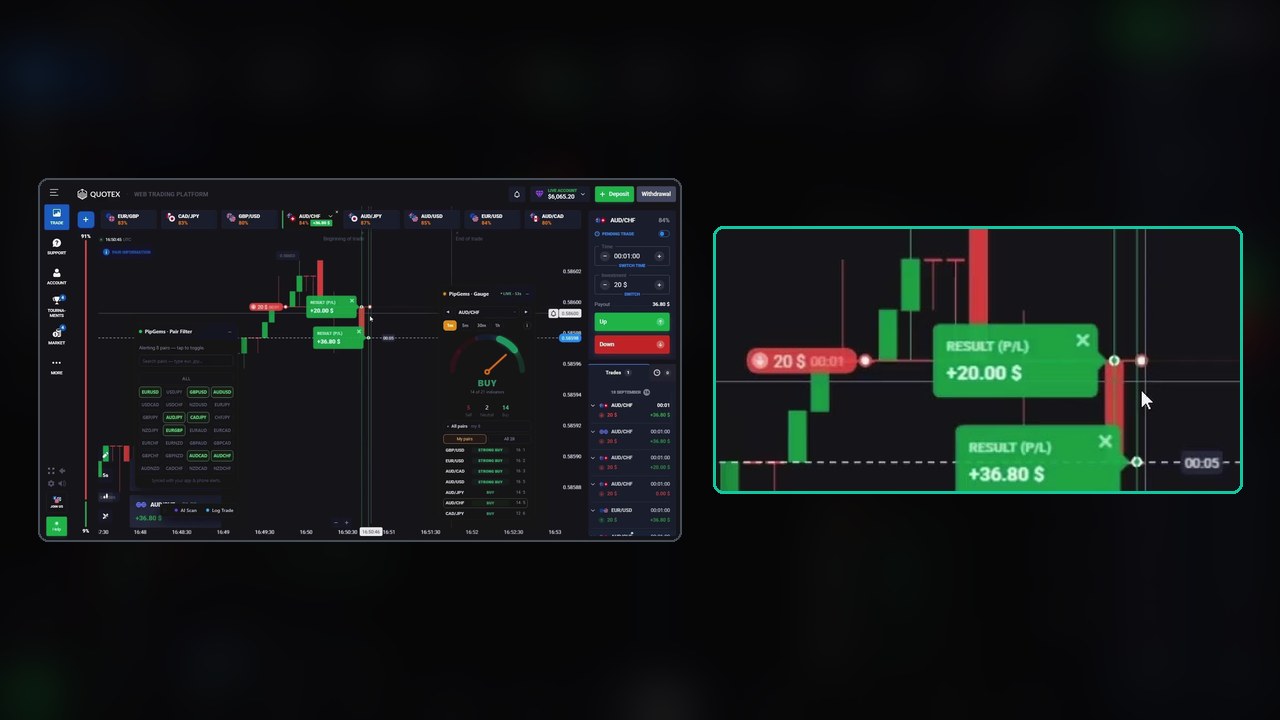
After that loss the narration describes an optional method: re-enter with a larger position, expecting the move to pull back. It is presented with its own warning — “this increases your risk… the situation is still 50/50… never chase losses beyond what you planned” — and in this case it recovers, with two results closing green and one closing even.
We are showing it because it is on screen. We are not recommending it. Increasing size after a loss changes nothing about the next minute’s odds; it only changes what that minute costs you. If you take one thing from this section, take the sentence the video puts around it: only within your daily limit.
Log a Trade — the Feature Nobody Uses
The video points at something easy to overlook: the Log a Trade button sitting under the chart. It records the entry so the session becomes a record rather than a memory.
This matters more than any single signal. The grades in this clip were unhelpful across seven trades — but seven trades is not a sample, and neither is a good session you half remember. A log turns “the A+ signals feel unreliable” into a number you can check: what did grade A+ actually do over my last fifty alerts? If the answer is 83%, take them. If it is 50%, you have saved yourself a month of confident losses.
The Payout Maths
Every entry here is $20 at 83–87%, so a win returns $36.60 to $37.40 and a loss returns nothing:
- At 87%, break-even needs about a 53.5% win rate.
- At 83%, it needs about 54.6%.
- At 80%, it needs about 55.6%.
That is why the session sorts pairs by payout before it sorts them by signal. Two or three points of payout is the cheapest edge on the screen, and it is the only one you can be certain of in advance.
What the Session Made
The account opens the clip at $6,058.40 and finishes at $6,152.00 — about +$93.60 across roughly fourteen minutes, including the trades that run under the music after the narration stops. Several positions overlap on different pairs, so a per-trade tally beyond the seven listed above cannot be read from the video.
Turning It Into Rules You Can Test
- Arm the same pairs in the filter and on the chart, chosen by payout first.
- Write a skip rule before the session. The obvious one from this clip: if the gauge disagrees with the signal, skip — whatever the grade says.
- Use the Gauge’s higher timeframes as context: a 1-minute signal against a clearly opposed 30-minute reading is a lower-quality trade.
- Flat stake, one entry per signal. No size increases after a loss.
- Log every alert — taken or skipped, with its grade and outcome. Fifty entries will tell you what the grades are worth on your pairs, at your hours.
Watch the Session
Fourteen minutes — the pair filter, every signal card, both losses and the recovery:
Honest Weaknesses
- Seven trades decide nothing. The grades underperformed here; on the next fifty they may do exactly what they claim. Neither this clip nor any clip can settle it.
- The card hides its sample size. A percentage without an n is an opinion with a decimal point.
- The session takes signals the gauge contradicts, which makes it impossible to tell whether the rule or the discretion produced the result.
- Re-entry after a loss appears in the same clip that preaches daily limits. The warning is there, but so is the behaviour.
- 1-minute expiries on live pairs are noisy, and the reading of a card costs seconds the entry does not have.
Risk Management
- Set a daily profit target and a stop-loss before the first trade — the video says it twice, and it is the most useful sentence in it.
- Flat stake. No recovery sizing, no exceptions.
- Know the break-even for the payout you took: 53.5% at 87%, 54.6% at 83%.
- Demo first, with the log running, until the grades have earned your trust on your own data.
Frequently Asked Questions
What do the PipGems signal grades mean on Quotex?
The grade summarises the history line on the signal check card: how often that signal has closed green for that pair, in the current 3-hour window, over the last 30 days. Grade C sits around 62–71% in this session, grade A at 80% and grade A+ at 83%. The card does not show how many trades those percentages are based on.
Did the highest-graded signals win in this video?
No. Both losses came from the 83% grade A+ signal on AUD/CHF, while four grade C signals won. Seven trades is far too small a sample to judge the grading system, but it does show that a high grade is not a guarantee.
What happens when the gauge disagrees with the signal?
In this session it happened once — the gauge read 6 of 21 against an AUD/CHF PUT that carried an 83% history — and the trade lost. The sensible rule is to skip a signal the gauge contradicts rather than choosing whichever number supports the trade.
What is the Log a Trade feature for?
It records each entry so a session becomes a checkable record instead of a memory. It is the only way to find out what a grade is actually worth on the pairs and hours you trade, rather than trusting the label.
The Verdict
4 out of 5. The workflow is sound and unusually transparent: payout-sorted pairs, a filter that keeps alerts and charts together, two numbers on every alert, higher-timeframe context a click away, and a trade log built in. The video also keeps both losses in and repeats the daily-limit rule, which is more than most.
It loses a star for the gap between the framing and the evidence. The signals are presented as an easy system, yet the grades pointed the wrong way across the seven trades shown, one entry was taken against the gauge, and a recovery re-entry appears alongside the risk advice. Use the checks, write the skip rule, keep the stake flat, and let the log decide.
#Quotex #PipGems #AISignals #BinaryOptions #TradingStrategy #RiskManagement #TradingJournal
This content is for educational purposes only and is not financial advice. Trading involves substantial risk; you can lose some or all of your capital. No result is guaranteed and past results do not indicate future outcomes. Always practise responsible money management, limit your daily trades, and trade only what you can afford to lose.
Related reading: the Gauge explained in full covers what a 17-of-21 reading really means, the hourly heatmap shows which hours a pair has actually paid, and the Pocket Option version runs the same checks on another platform.