Most signal apps tell you one thing: buy or sell. This one tells you three, and the third is the interesting one — because sometimes it says the app's own indicators disagree with the signal it just sent you.
That is rare enough to be worth a post on its own. It is also the part most likely to be ignored, including in the session below.
Three numbers on every card
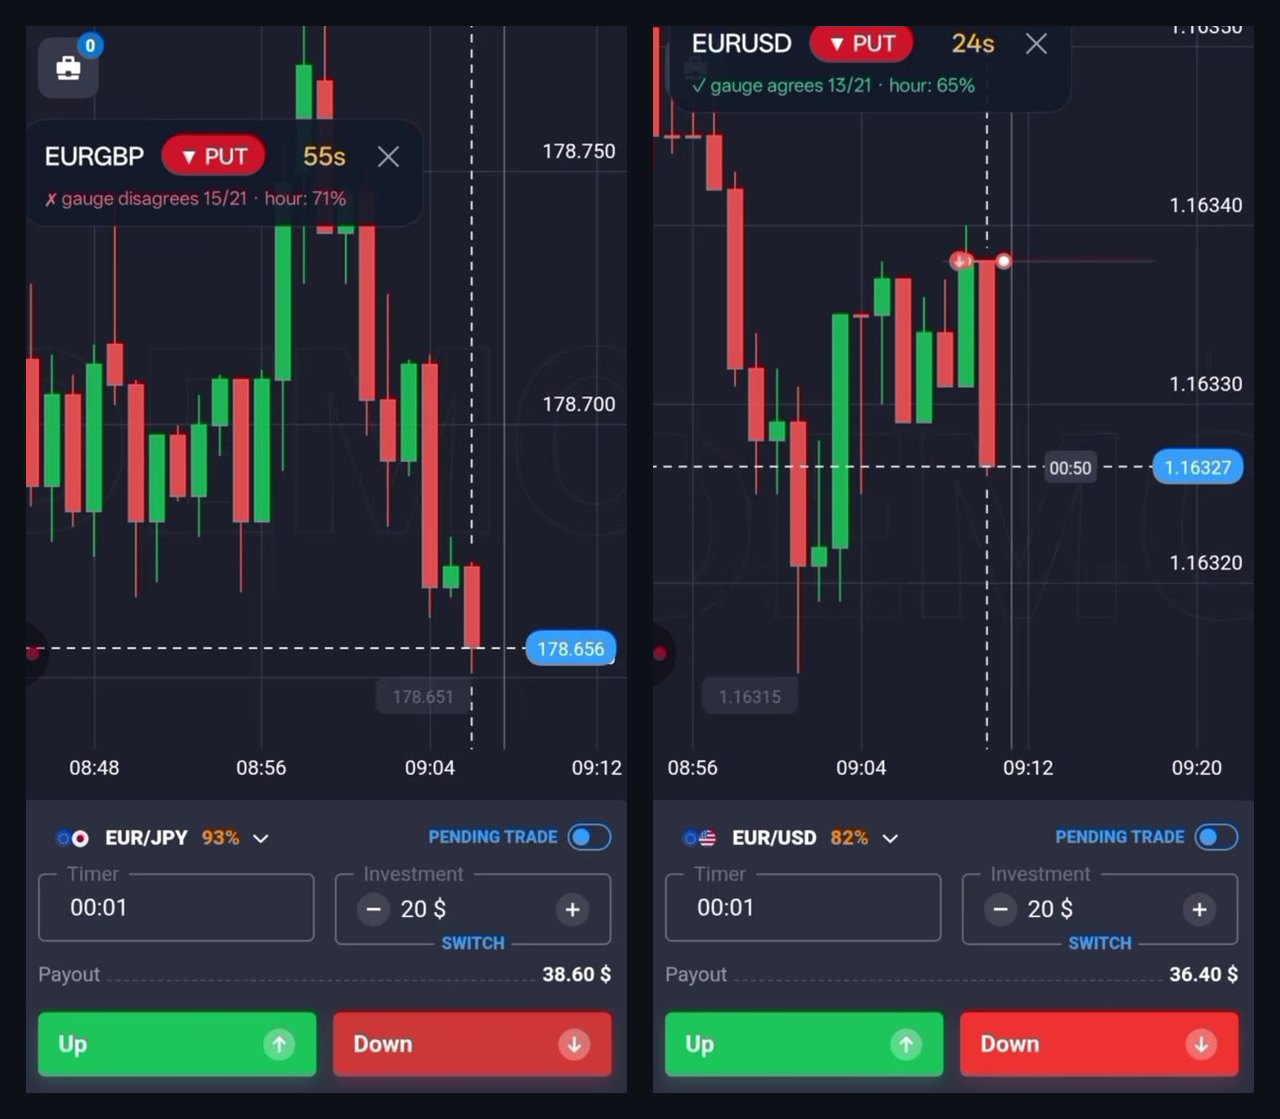
Two alerts from the same hour, side by side. Read the small line under each one:
| Card | Signal | Gauge | Hourly heatmap |
|---|---|---|---|
| EUR/GBP | PUT, 55s left | ✗ disagrees 15/21 | 71% |
| EUR/USD | PUT, 24s left | ✓ agrees 13/21 | 65% |
So each alert carries direction and a countdown, then two independent readings:
- Gauge agreement. How many of 21 indicator readings currently point the same way as the signal. A red cross means the indicator panel is leaning the other way.
- The hourly heatmap. How often signals on that pair, at that hour of the day, have finished in the money across the lookback window.
Showing the disagreement is genuinely unusual. Most signal products present one confident arrow and never surface internal conflict at all, because conflict does not sell. Printing "gauge disagrees 15/21" on the card is the app arguing with itself in public, and that is what makes it possible for you to decline the trade.
What the app is doing behind that
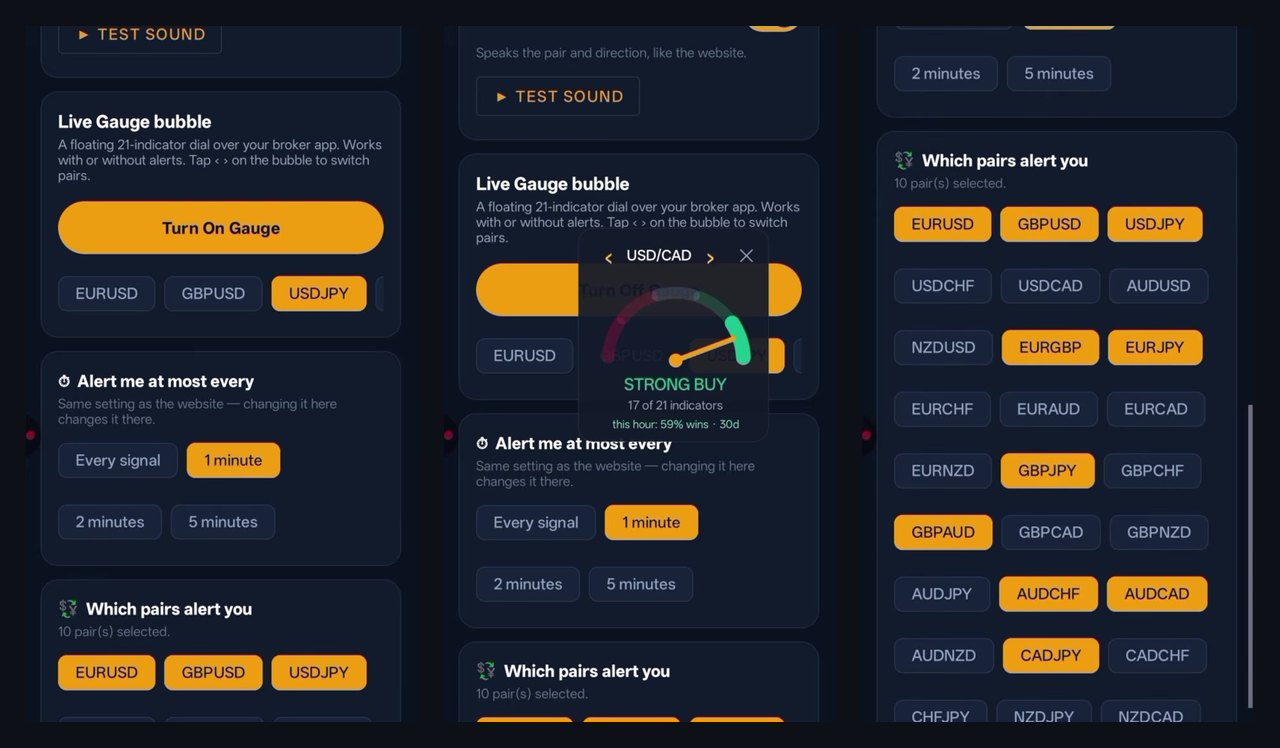
Three controls do the work, and they are worth setting before the session rather than during it.
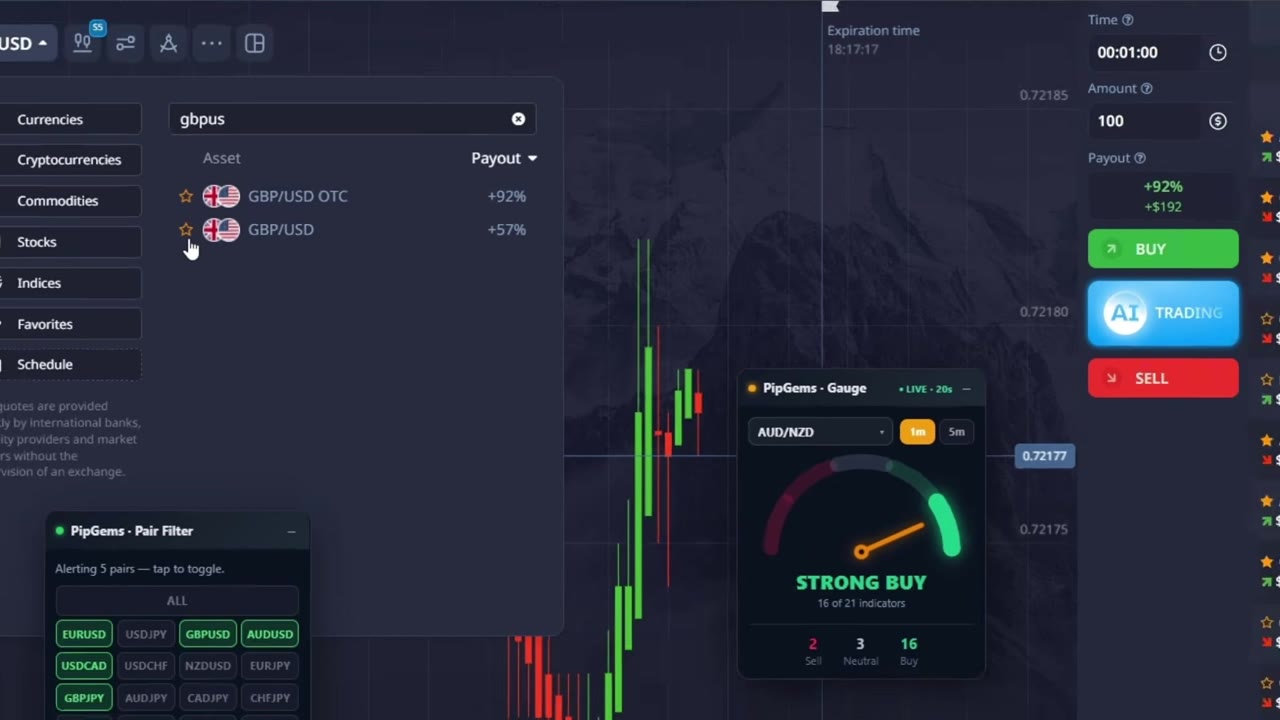
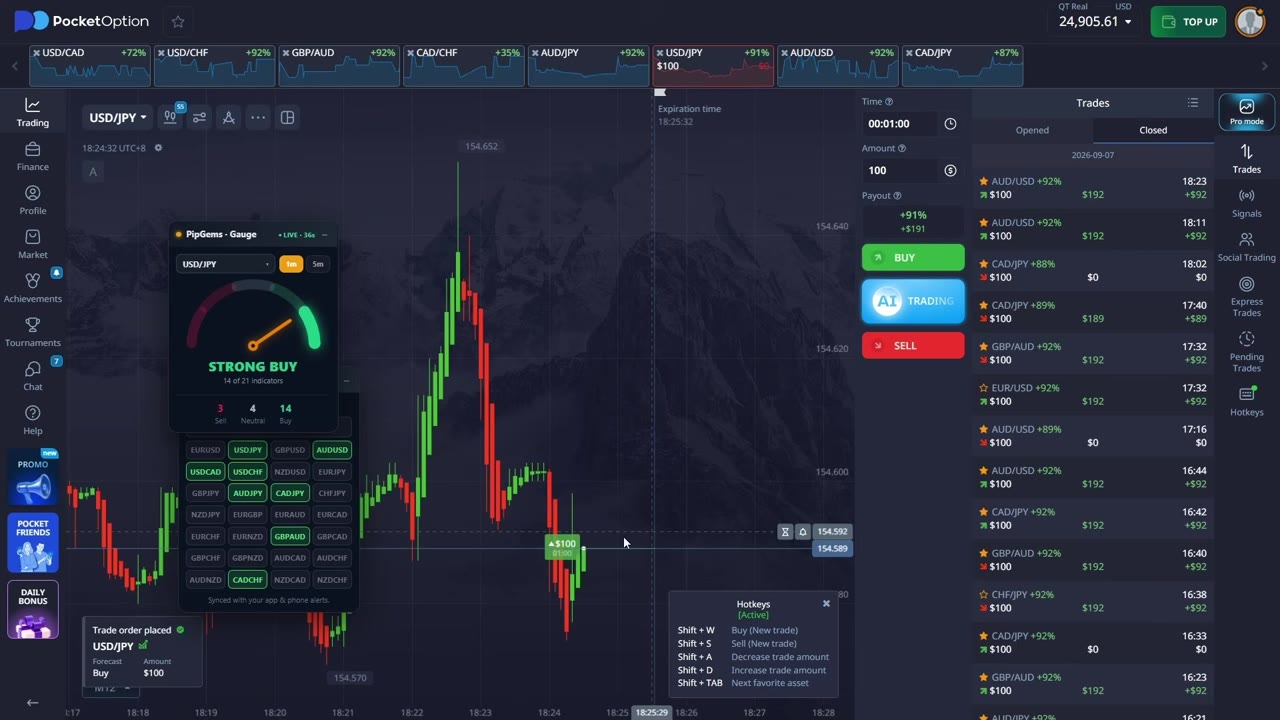
The pair filter. Ten pairs are lit in the grid out of roughly thirty. The rule stated in the video is to match those against the pairs Quotex is currently paying well on, so alerts only arrive for assets actually worth trading. In the frames, the open pairs pay 93%, 85% and 82%.
The alert throttle. Set to at most every 1 minute, with options for every signal, 2 and 5 minutes. On ten pairs this is what stops the phone becoming unusable.
The gauge bubble. A floating 21-indicator dial that sits over the broker app, with arrows to flick between pairs. It is optional — the agreement count is already on the card — and it is most useful for checking a pair you have not been alerted on.
One nice touch: the settings sync with the web version, so changing the throttle on the phone changes it on the desktop too.
The number that needs care
The gauge count is self-explanatory: 15 of 21 is a headcount, and you can see the dial that produced it. The heatmap percentage is different, and it is worth being precise about what it is.
It is a historical base rate for that pair at that hour, over a lookback window. In the session the window is set to a year. It is not a probability for the trade in front of you, and the video's phrasing — "the heat map confirms a 71% probability for this hour" — is looser than the number can support.
The specific thing missing is sample size. A 71% figure built on 400 past signals and one built on 25 look identical on the card. There is no way to tell them apart, and they deserve completely different levels of trust.
For scale, here is what the same question looks like when it is measured properly. We ran 23 years of hourly candles across 19 markets and published the sample size and significance next to every cell:
| Measured hour-of-day, EUR/USD | Up-rate | Samples |
|---|---|---|
| 02:00 UTC — strongest hour | 54.7% | 5,902 |
| 20:00 UTC — weakest hour | 45.5% | 5,902 |
| Honest range across all markets | 45–60% | ~6,000 each |
Those two things are not measuring the same quantity — raw candle direction is not the same as signal outcomes, and a good signal should beat the raw base rate. But the distance between 54.7% across 5,902 samples and 71% across an unstated number is the distance between a figure you can lean on and a figure you should treat as a hint. Both hours in this session, 71% and 65%, sit above the entire measured range for raw hourly direction.
Our own research post says it plainly: testing 24 hours across many pairs guarantees some cells look brilliant by chance. That is a warning about our data too, and it applies here.
The trade we would not have taken
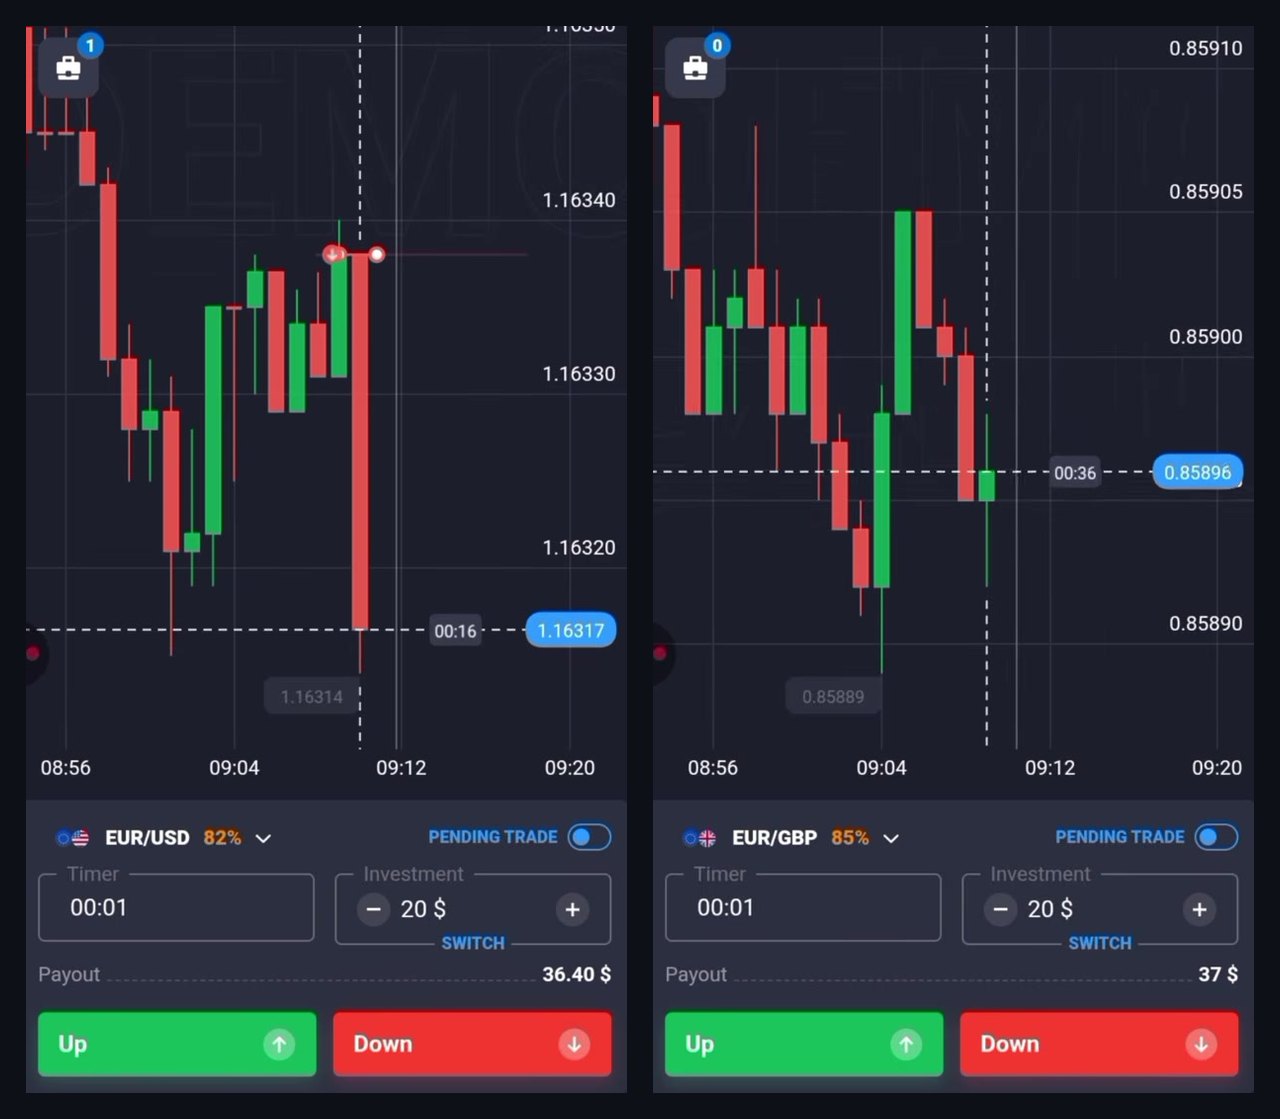
Both trades in the session closed green. The second one is unremarkable in a good way: the gauge agreed, the heatmap read 65%, the trend was clearly down, and the PUT worked.
The first is the one worth talking about. The gauge said disagrees, 15 of 21 — meaning the indicator panel actually leaned towards a call — and the trade was taken as a put anyway. The reasoning given on camera is: "we do not depend on the indicator, it's just an optional filter."
It won. That does not make it a good decision, and the two facts are independent.
Here is the problem in one sentence: a filter you honour when it agrees and override when it does not has been switched off without being removed. The occasions a confirmation tool disagrees with you are the only occasions it is doing any work at all. If the gauge is genuinely optional, the honest version is to turn it off and stop reading it. If it is not optional, then "disagrees 15/21" is a skip, including on the trades you want to take.
There is a defensible middle: decide in advance that the gauge governs one class of setups and not another, and write that rule down before the session. What is not defensible is deciding per-alert, in the moment, based on how much you like the look of the chart.
What the session gets right
- The pair filter is synced to payouts. Alerts only arrive for assets worth trading. This is the single highest-value habit in short-expiry trading and we went through the arithmetic in the payout filter post.
- The throttle is set before the trading starts. Ten pairs without a throttle is a phone you cannot use.
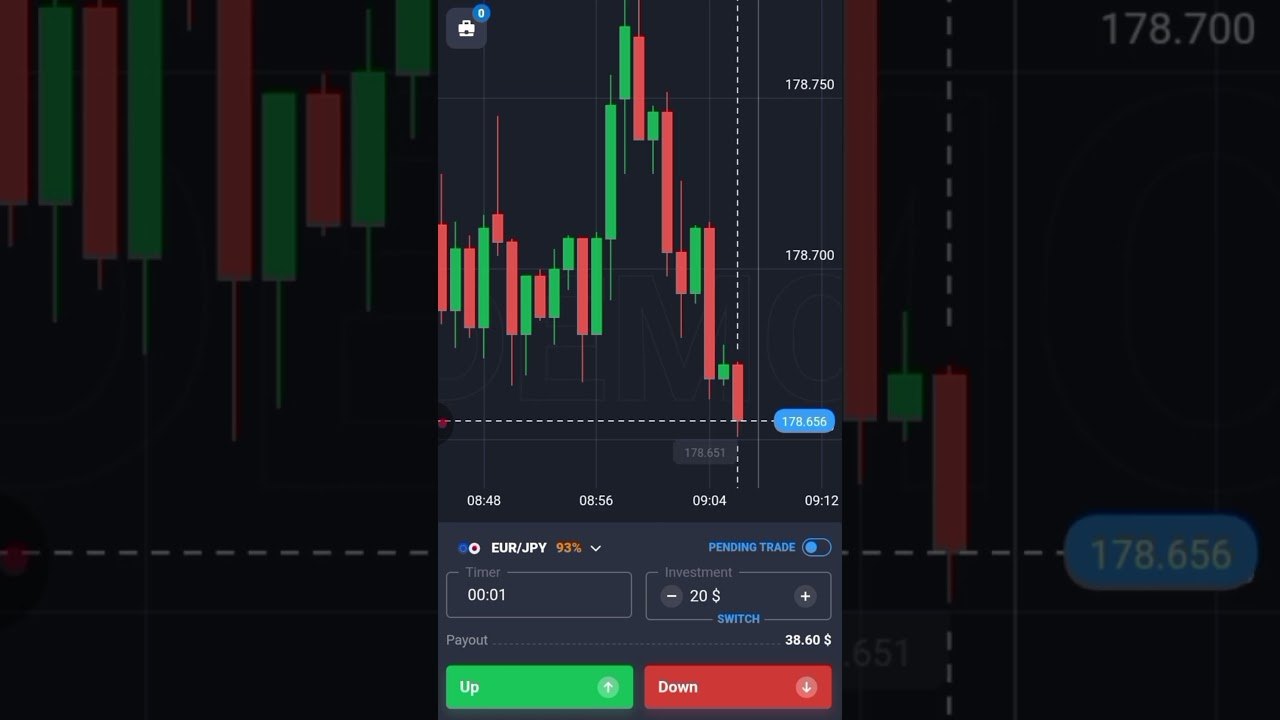
- The stake is flat. $20 on every trade, no increasing after a loss.
- It runs on a demo account. The DEMO watermark is visible through both charts, and that is the correct place to be establishing whether an hour bias is real.
- The block is time-boxed. One hour, then stop — which is a far better session structure than trading until something goes wrong.
How we would use the heatmap
As a ranking tool, not a permission slip. When two alerts arrive close together and you can only take one, the higher hourly figure is a reasonable tiebreaker. Using it to justify a trade the gauge is arguing against is asking it to do a job it cannot do.
The strongest combination on the card is the boring one: gauge agrees, heatmap above average, payout high. All three lined up is a smaller number of trades than most people want to take, and that is rather the point.
Why 4 and not 5
The app deserves real credit here. Surfacing its own gauge disagreement on the alert card is the opposite of what this category normally does, the pair filter and throttle are sensible controls rather than decoration, and the session runs on demo with a flat stake and a fixed time box.
Two things hold it back. The heatmap percentage is presented without a sample size, which makes a well-supported figure indistinguishable from a thin one — adding n to that line would cost nothing and would settle the question. And the session's one clear teaching moment, an alert the gauge openly contradicted, was resolved by overriding the gauge rather than skipping the trade. Two winning trades on one demo hour is a demonstration of a workflow, not evidence about it.
The session
PipGems is our own app, so read this as our tool in our video — including the criticism, which we would rather publish ourselves. Trading carries substantial risk and you can lose your capital. Nothing here guarantees a result, historical base rates do not predict individual trades, and past performance does not predict future performance. Practise on a demo account first.