The Only Setup That Costs Nothing and Never Expires
Every indicator on your chart is a calculation performed on past price. Support and resistance skips the calculation and reads the price directly. That is why this method has outlived every indicator fashion of the last twenty years — there is no setting to optimise, no file to download, nothing to expire or repaint, and it works identically on Pocket Option, on a broker platform, or on a printed chart.
A support level is a price where buyers have repeatedly stepped in and stopped a fall. A resistance level is where sellers have repeatedly stopped a rise. They matter for an unglamorous reason: enough traders remember what happened at that price to act on it again. The level is not magic — it is a record of where decisions were made before.
The Chart Setup on Pocket Option
- Platform: Pocket Option (fixed-time trades) — demo account while you learn to draw levels
- Candles: Japanese candlesticks, 1-minute or 5-minute. Longer candles give stronger, cleaner levels
- Trade duration: 2–5 minutes on 1-minute candles; scale up proportionally on 5-minute
- Indicators: none. Just the horizontal line drawing tool
- Pairs: major pairs during their active session — levels formed in dead hours mean little
- Stake: fixed, 1–2% of balance per trade
Open the drawing tools, pick the horizontal line, and that is your entire toolkit. Zoom out until you can see several hours of price, then look for prices that price has visited and turned away from more than once.
How to Draw a Level That Is Actually Worth Trading
- Two touches minimum, three is better. One turn at a price is a coincidence. Two is a level. Three makes it worth a trade.
- Draw through the zone, not the exact tick. Levels are areas a few pips wide, not precise numbers. Line up the wicks and bodies as best you can and accept the level is a band.
- Recent beats ancient. A level touched in the last hour matters more on a short expiry than one from yesterday.
- Fewer lines, better lines. If your chart has eight lines, none of them mean anything. Two or three good levels per pair is plenty.
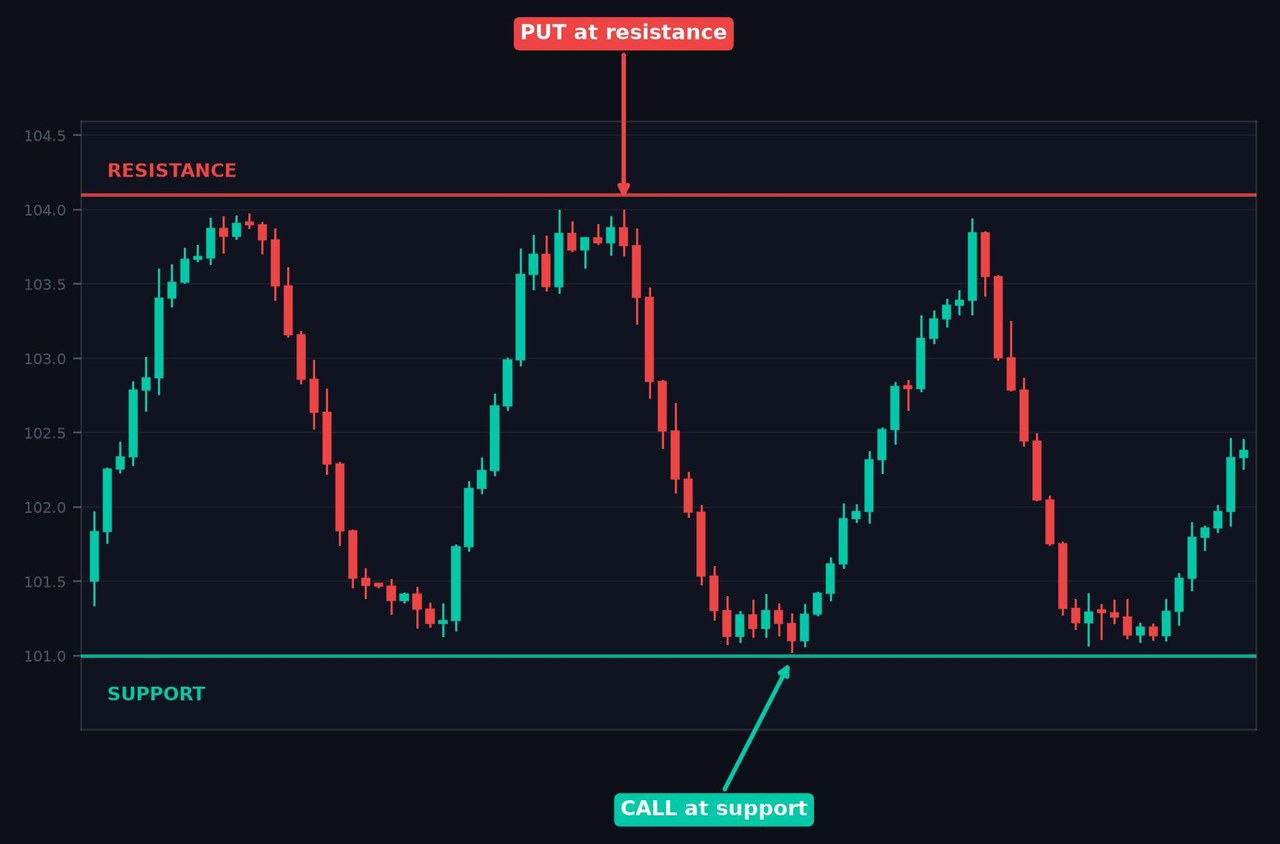
The chart above shows the cleanest case: a market moving sideways between two levels it has respected three separate times. Each approach to resistance is a potential PUT and each approach to support is a potential CALL. This is the setup beginners should hunt for, because the level has already proved itself repeatedly before you risk anything.
Trade 1: The Bounce
This is the higher-probability trade of the two and the one to start with.
- Price approaches an established level.
- Wait for rejection. Do not enter as price arrives — you have no idea yet whether it will hold. Watch for a candle that pushes into the level and closes back away from it, ideally leaving a wick poking through. A long wick into resistance with a small red body is a textbook rejection.
- Enter at the open of the next candle: PUT after rejection at resistance, CALL after rejection at support.
- Set the expiry to land before price would reach the opposite level — you are trading the move away from the level, not all the way across the range.
The discipline that matters here is the wait. The difference between traders who make this work and traders who do not is almost entirely whether they enter on the approach or on the rejection.
Trade 2: The Breakout Retest
Levels break — that is normal, and it is tradeable if you handle it correctly. The mistake is chasing the breakout candle itself, which is where most losses in this method come from. The patient version waits for the retest.
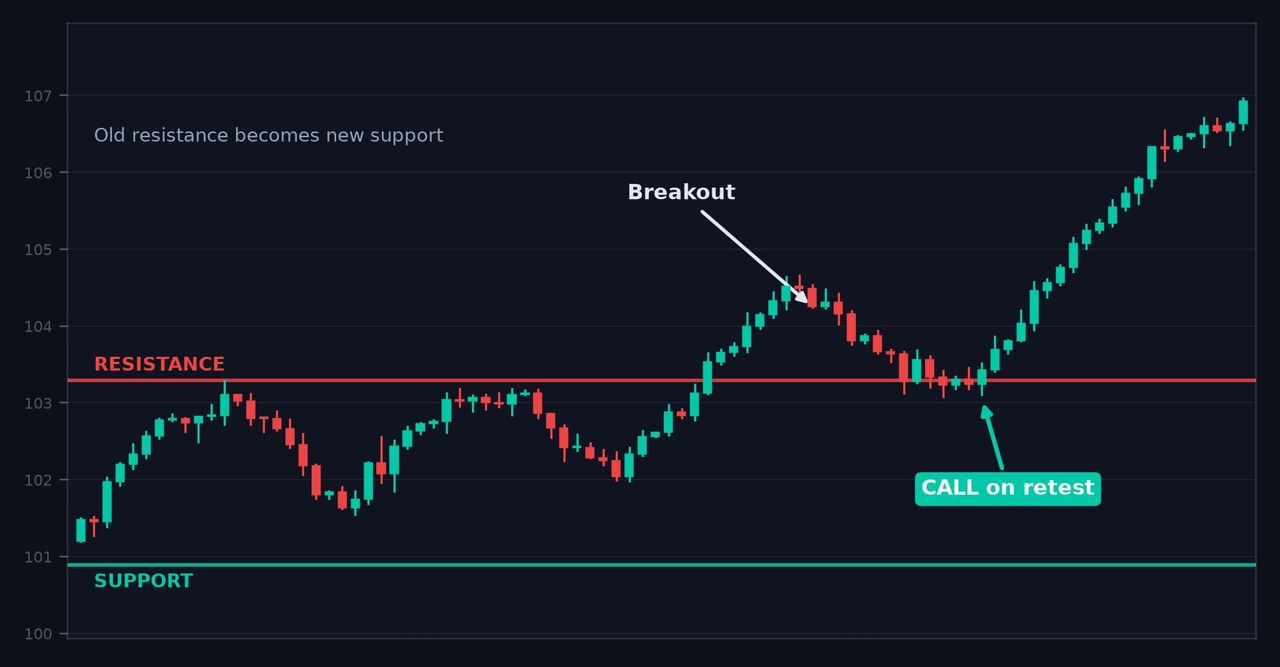
- Price closes decisively through a level — a full-bodied candle, not a wick poking over.
- Price pulls back to that same level, which now acts in the opposite role: broken resistance becomes support, broken support becomes resistance. This role reversal is the single most useful idea in price action.
- The retest holds — price touches the old level and turns away from it again.
- Enter in the breakout direction on the candle after the hold.
In the chart above, price spends time capped by resistance, breaks above it with conviction, then drifts back down to the same line. Instead of falling through, it stops there and turns up — the old ceiling is now a floor. That retest is the CALL entry, and it is a far safer entry than buying the breakout candle at its high.
What Makes a Level Fail
Being honest about failure conditions is what separates a usable method from a slogan:
- News. A scheduled economic release will run straight through levels as if they are not there. Check the calendar and stay flat around high-impact news.
- Repeated testing weakens the level. Counter-intuitively, the fourth or fifth touch is weaker than the second. Each test consumes the orders sitting there. A level that has been hammered repeatedly is a level about to break.
- Strong trends. In a hard trend, counter-trend levels get sliced through. Trade bounces off levels that agree with the larger direction and be far more selective against it.
- Dead sessions. Thin, low-volume hours produce levels that nobody is defending.
The Payout Maths
Pocket Option fixed-time payouts generally sit around 85–92%. A win at 87% returns $8.70 on a $10 stake; a loss costs the full $10. That means break-even sits near a 53–54% win rate. Price action does not automatically clear that bar. Only taking rejections at levels with three or more touches, in an active session, with no news pending, is what gets you there — and even then, verify it with your own logged results rather than assuming.
Risk Management Rules
- Fixed stake at 1–2% of balance. Never increase it after a loss.
- No entry without a rejection candle. The approach is not the signal.
- Maximum three levels drawn per chart — if everything is a level, nothing is.
- Check the economic calendar before each session and sit out high-impact releases.
- Set a daily loss cap and stop when you reach it.
- Practise drawing levels on demo for a couple of weeks. The skill being learned here is reading the chart, and it takes reps.
The Verdict
An easy 4.5 out of 5 — the highest rating we give to any free method, and it earns it on durability. There is nothing to buy, nothing to install, nothing that can expire or repaint, and no lag: you are reading price itself rather than a calculation performed on it. Every indicator strategy on this site is ultimately trying to approximate what a well-drawn level tells you directly. It also transfers everywhere — learn it on Pocket Option and you can use it on any platform, any timeframe, for as long as you trade.
Half a star comes off for the one real drawback: it is subjective. Two traders will draw slightly different lines on the same chart, and there is no setting that makes the skill appear. It takes genuine screen time before your levels are consistently useful, and during that learning period your results will be worse than a mechanical indicator system would give you. Push through it — this is the one free method still worth knowing in five years.
#PocketOption #SupportAndResistance #PriceAction #FreeStrategy #NoIndicators #BinaryOptions #Breakout #TradingStrategy #BeginnerTrading
Frequently Asked Questions
Can you trade Pocket Option without any indicators?
Yes. Support and resistance trading uses only horizontal lines drawn on the chart with the built-in drawing tool. No indicators, downloads or paid tools are needed, which is why the method never expires or repaints.
How do you draw support and resistance levels correctly?
Look for a price that has stopped a move at least twice, and preferably three times. Draw the line through the zone rather than one exact tick, prioritise recent levels over old ones, and keep no more than two or three lines on the chart at a time.
What is a breakout retest?
When price closes decisively through a level, that level switches roles: broken resistance becomes support and broken support becomes resistance. A retest is when price returns to the old level and turns away from it in the new role, which is a safer entry than chasing the breakout candle itself.
Why do support and resistance levels fail?
Levels commonly fail during high-impact news releases, in strong trends when traded counter-trend, in thin low-volume sessions, and after repeated testing, since each test consumes the orders resting at that price.
This content is for educational purposes only and is not financial advice. Trading involves substantial risk; you can lose some or all of your capital. No result is guaranteed and past performance does not indicate future results. Trade only what you can afford to lose.
Want to add a confirmation layer on top of your levels? A momentum tool like the RSI and Bollinger Bands combination pairs well with a rejection at a level, and RSI divergence can warn you when a level is likely to hold.