When Price and Momentum Disagree
Most traders use RSI the obvious way: above 70 is overbought, below 30 is oversold. That reading is the least useful thing RSI does, and it is the reason so many people conclude the indicator "does not work". Its genuinely valuable signal is divergence — the moments when price and momentum tell contradictory stories.
Price making a new high tells you the market went further. RSI failing to make a new high at the same time tells you it got there with less force than before. That gap is information you cannot get from the price line alone: the move is still going, but fewer participants are pushing it. Trends usually weaken before they turn, and divergence is one of the few ways to see the weakening in advance.
Everything here uses the standard RSI built into Olymp Trade for free. There is nothing to download and no setting to buy.
The Chart Setup on Olymp Trade
- Platform: Olymp Trade (fixed-time trades) — demo account while you train your eye
- Candles: Japanese candlesticks, 1-minute or 5-minute. Divergence on very fast candles is mostly noise
- Trade duration: 3–5 minutes on 1-minute candles
- Indicator: RSI, period 14 — the default, with the 70 and 30 lines visible
- Pairs: majors during an active session, where swings are clean enough to compare
- Stake: fixed, 1–2% of balance
Add RSI from the indicators panel, confirm the period is 14, and leave it alone. Every meaningful decision in this strategy is about reading the indicator, not configuring it.
Bearish Divergence — The PUT Setup
Bearish divergence appears at the top of a rally and warns that the buying is thinning out.
- Price makes a higher high — a peak clearly above the previous peak.
- RSI makes a lower high at that same peak — it does not exceed its earlier reading.
- The two peaks must be separated by a real pullback. Two bumps a few candles apart are noise, not divergence.
- Wait for price to confirm. Divergence is a warning, not a trigger. Enter only once price actually turns — a bearish candle closing below the prior candle's low, or a break of the small swing low between the two peaks.
- Enter PUT on the open of the following candle.
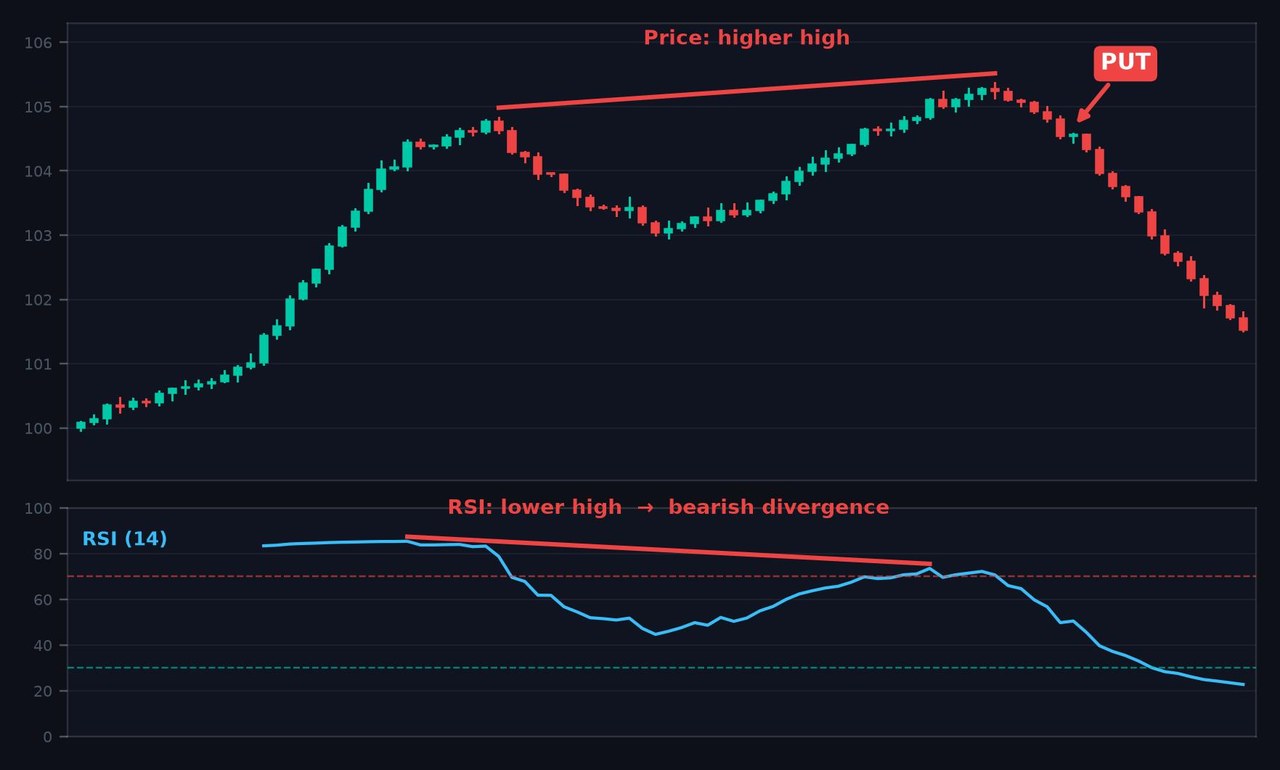
The chart above is a clean example. Price rallies to a peak, pulls back, then grinds up to a higher peak — visually it looks like strength continuing. The RSI pane tells the opposite story: the second peak reads noticeably lower than the first, around the low 70s versus the mid 80s. The second push covered more ground with less momentum behind it. Once price breaks down from that second peak, the PUT triggers, and the decline that follows is the move the divergence was warning about.
Bullish Divergence — The CALL Setup
The mirror image, appearing at the bottom of a sell-off.
- Price makes a lower low.
- RSI makes a higher low — the selling is losing force even as price drops further.
- A genuine bounce separates the two lows.
- Wait for price confirmation: a bullish candle closing above the previous candle's high, or a break of the swing high between the lows.
- Enter CALL on the next candle open.
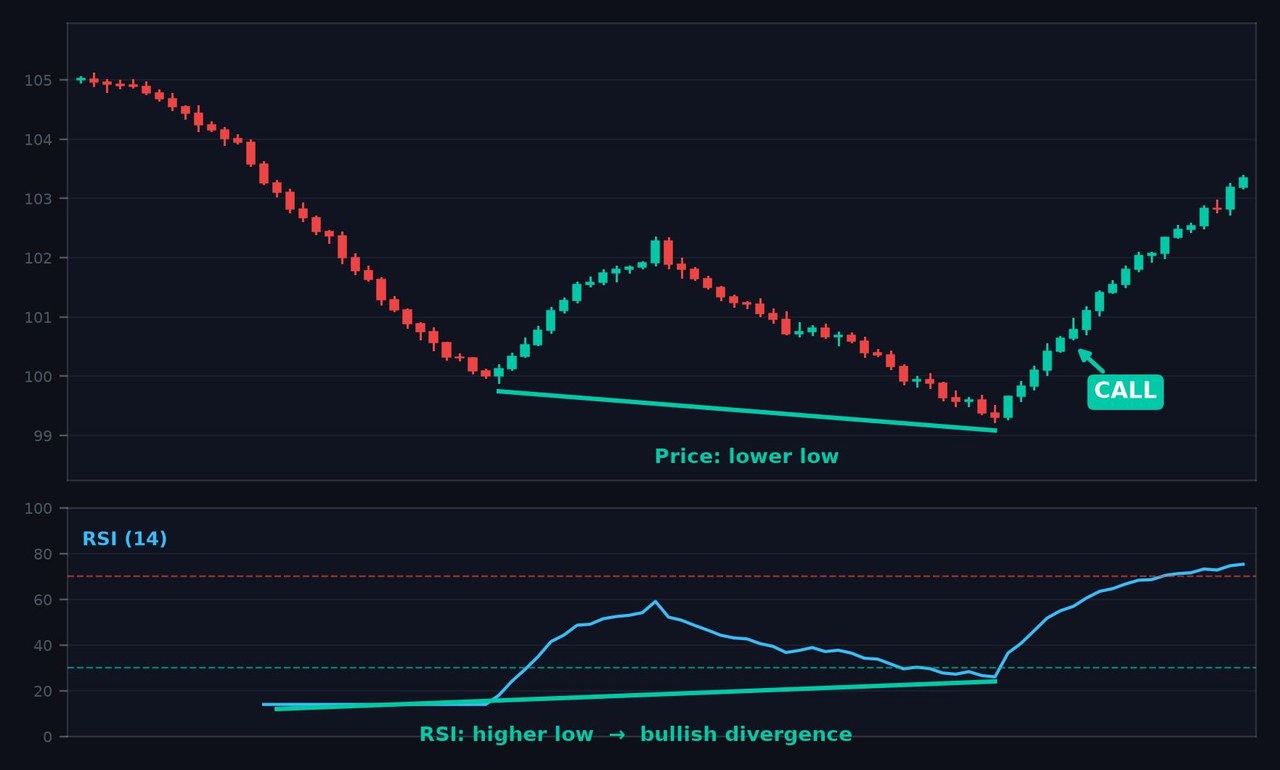
Here price sells off, bounces, then slides to a new low beneath the first one. RSI does the opposite — its second trough sits clearly above the first, in the mid 20s rather than the mid teens. Sellers pushed price lower but with visibly less conviction. Price confirms with a green candle taking out the prior high, and the recovery that follows carries well past a 3–5 minute expiry.
The Rule That Makes or Breaks This Strategy
Divergence tells you a trend is weakening. It does not tell you the trend is over, and it never tells you when. This distinction is where most traders lose money with it. A strong trend can print divergence three or four times and keep going, and each of those is a losing counter-trend trade for anyone who entered on the divergence alone.
The fix is non-negotiable: never enter on divergence by itself. Treat it as an alert that raises your attention, then require price to actually turn before you commit. That single rule converts this from a chronic early-entry trap into something workable.
The Payout Maths
Olymp Trade fixed-time payouts commonly sit around 80–90% depending on the asset. At 82%, a $10 win returns $8.20 while a $10 loss costs $10, putting break-even near a 55% win rate. Counter-trend reversal trading is one of the harder places to sustain that. Check the payout before you enter — a lower payout raises the win rate you need, and on a marginal setup that can be the reason to skip it entirely.
Honest Weaknesses
- It is early by nature. Divergence often appears well before the actual turn. Without price confirmation you will be repeatedly right about direction and wrong about timing — which on a fixed expiry pays exactly the same as being wrong.
- Strong trends produce repeated failed divergences. The stronger the trend, the more divergence signals it generates and the more of them fail.
- It is subjective. Which peaks count? How far apart must they be? Two traders will mark different divergences on the same chart. There is no mechanical definition.
- You are trading against the trend. Every divergence trade is counter-trend, which is the harder side of any market by default.
- Fast candles are mostly noise. On 5- and 10-second charts, apparent divergences form and vanish constantly. Stay at 1-minute or slower.
Risk Management Rules
- Fixed 1–2% stake. Counter-trend trading is precisely where increasing stakes to recover does the most damage.
- Price confirmation is mandatory. No confirmation, no trade — without exception.
- Require a real pullback between the two peaks or troughs.
- Prefer divergence that forms at a support or resistance level — two independent reasons for a turn beats one.
- Cap the number of divergence trades per session; forcing marginal ones is the common failure pattern.
- Log at least 50 signals on demo before risking real funds.
The Verdict
3.5 out of 5 — a genuinely valuable concept held back by real difficulty. What it does well is rare: it gives you a look at momentum weakening before price reflects it, using an indicator you already have for free. Traders who can read divergence reliably see reversals forming while everyone watching only the price line is still trading the old direction. That skill is worth developing, and it improves your chart reading well beyond this one setup.
The rating stops at 3.5 because the honest weaknesses are substantial and stack up: it is subjective, it is early, it is counter-trend, and strong trends will generate a series of failed signals that punish anyone who trusts divergence on its own. It is not a beginner's first strategy. If you are starting out, learn support and resistance first, then add divergence as a confirmation layer once you can already read structure. Used that way — with mandatory price confirmation, at a level that matters, with a fixed stake — it is a useful edge. Used alone, it is an expensive way to be right too soon.
#OlympTrade #RSI #RSIDivergence #FreeStrategy #ReversalTrading #BinaryOptions #TradingStrategy #Momentum #PriceAction
Frequently Asked Questions
What is RSI divergence?
RSI divergence occurs when price and the Relative Strength Index disagree. Bearish divergence is price making a higher high while RSI makes a lower high; bullish divergence is price making a lower low while RSI makes a higher low. It signals that momentum behind the move is weakening.
What RSI settings should you use on Olymp Trade?
Use the default period of 14 with the 70 and 30 levels visible. RSI is built into Olymp Trade for free. The skill in this strategy is reading the indicator rather than changing its settings.
Can you enter a trade on divergence alone?
No. Divergence signals that a trend is weakening, not that it has ended, and it gives no timing. Always wait for price confirmation, such as a candle closing beyond the previous candle's range or a break of the swing point between the two peaks, before entering.
Which timeframe works best for RSI divergence?
One-minute and five-minute candles work best. On very fast timeframes such as 5-second or 10-second charts, apparent divergences form and disappear constantly and are mostly noise.
This content is for educational purposes only and is not financial advice. Trading involves substantial risk; you can lose some or all of your capital. No result is guaranteed and past performance does not indicate future results. Trade only what you can afford to lose.
Looking for a setup with clearer, more mechanical rules? Try the RSI + Bollinger Bands combination, which uses the same indicator with unambiguous entry conditions.