Two Free Indicators, One Job: Finding Exhaustion
Most short-expiry setups fail for the same reason — they enter in the middle of a move, where price can go either way. This one only looks at the edges. It pairs Bollinger Bands, which measure how far price has stretched from its own average, with the Relative Strength Index (RSI), which measures how one-sided the recent buying or selling has been. Both are built into Quotex for free, and neither needs a downloaded file.
The idea is simple. Bollinger Bands answer "is price unusually far from normal?" RSI answers "is the move behind it running out of participants?" A trade is only taken when both say yes at the same time. That double condition throws away the vast majority of candles, which is the point — you are hunting for a handful of stretched moments per session, not trading every bar.
The Chart Setup on Quotex
- Platform: Quotex (fixed-time trades) — practise on the demo account first
- Candles: Japanese candlesticks, 1-minute timeframe
- Trade duration: 3 minutes (three candles — enough room for a bounce to develop)
- Indicator 1 — Bollinger Bands: Period 20, Deviation 2 (the platform default)
- Indicator 2 — RSI: Period 14, with the levels drawn at 70 and 30
- Pairs: major pairs such as EUR/USD or GBP/USD during active hours; OTC pairs work too but behave differently
- Stake: a fixed amount you do not change — 1–2% of your balance per trade
To add them, open the indicators panel, search for Bollinger Bands, leave the period at 20 and deviation at 2, and apply. Then add RSI, confirm the period is 14, and apply. That is the whole configuration — there is nothing to tune, and resisting the urge to tune it is part of the discipline.
The Entry Rules
A valid signal needs three things at once. If any one is missing, there is no trade:
- Price touches or pierces a band. For a PUT, the candle must reach or close outside the upper band. For a CALL, it must reach or close outside the lower band.
- RSI agrees. At that same moment RSI must be above 70 for a PUT, or below 30 for a CALL. A band touch with RSI sitting at 55 is not a signal — it is just a normal candle in a trend.
- The next candle rejects. Wait for the candle after the touch to start turning back toward the middle band. A bearish candle after an upper-band touch, or a bullish candle after a lower-band touch, is your trigger. Enter at the open of the candle that follows.
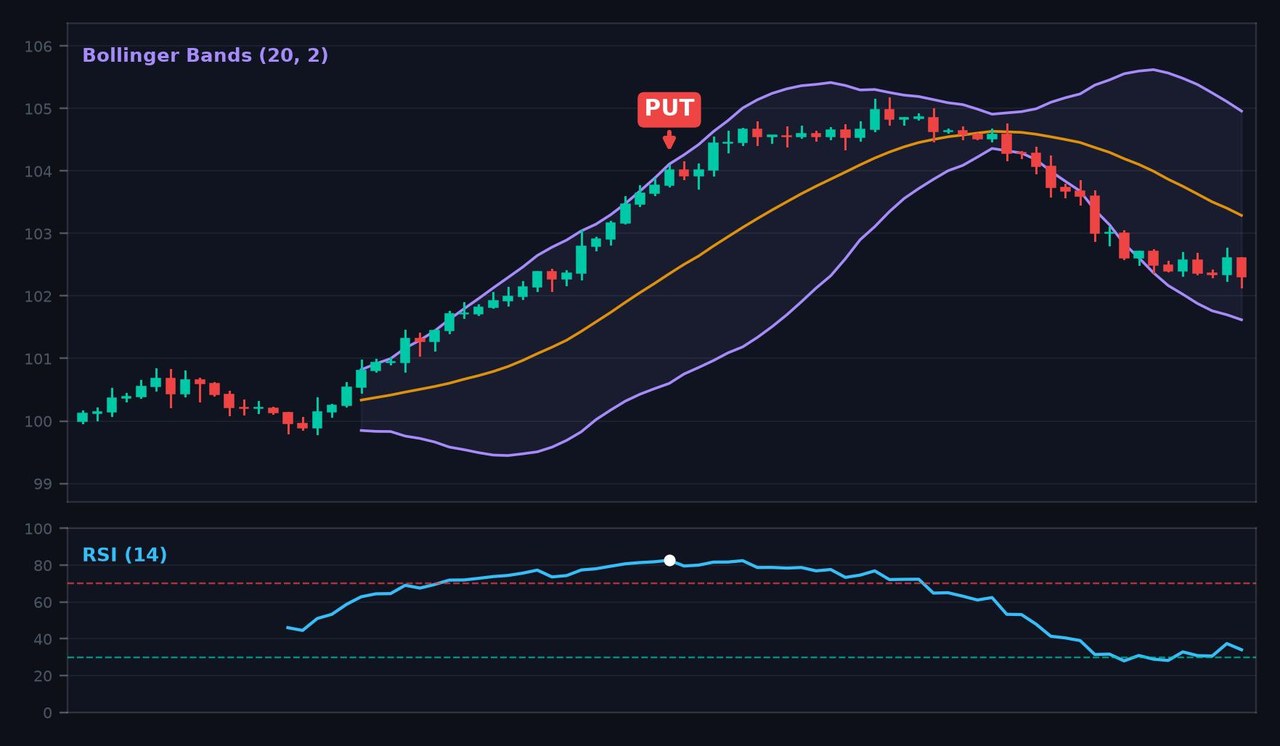
The chart above is the textbook version of the PUT. Price has run up and pushed through the upper band, and the RSI pane below confirms the move is stretched — it is up in the low 80s, well above the 70 line. Note that price had been riding near the upper band for a while before this; the signal is only valid once RSI actually crosses into overbought territory and the following candle turns over. Immediately after, price falls back through the middle band, which is exactly the reversion this setup is built to capture.
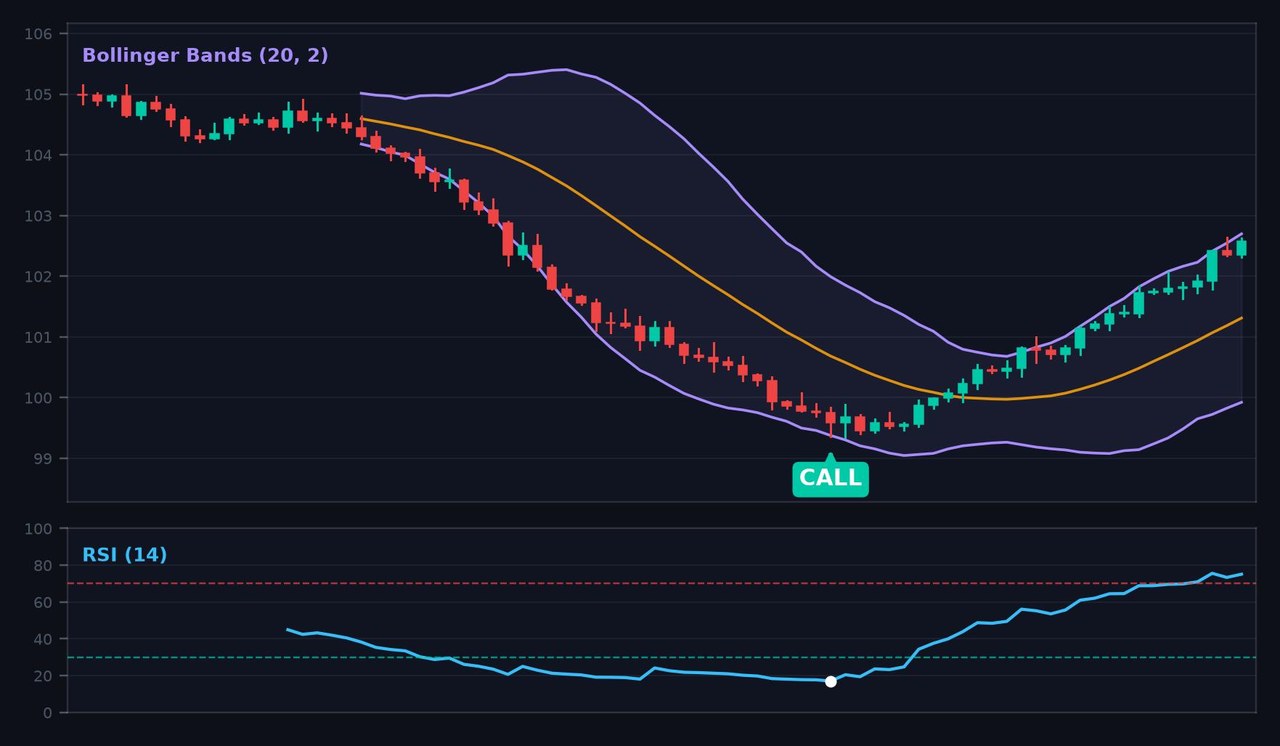
The CALL is the mirror image. Price sells off, hugs and then breaks the lower band, and RSI drops under 30. The candle that follows stops making new lows and closes green — that is the rejection you enter on. Price then climbs back toward the middle band over the next several candles, which comfortably covers a 3-minute expiry.
Why the Middle Band Matters
The middle Bollinger line is a 20-period simple moving average, and it is your realistic target. This is a mean-reversion setup: you are betting that a stretched price snaps back toward its average, not that a new trend begins. If you find yourself hoping for a huge run in your favour, you have misread the strategy. Set the expiry so it lands around the time price would plausibly reach the middle band — on 1-minute candles, three minutes is usually about right.
This also tells you when to skip. If the middle band is steeply sloped, the market is trending hard, and mean reversion is the wrong tool. The best signals appear when the middle band is relatively flat and the bands are wide — a market that has stretched but has no strong directional commitment.
The Payout Maths You Cannot Ignore
Quotex fixed-time trades typically pay somewhere around 85–92%. That asymmetry decides everything. At an 85% payout, a $10 win returns $8.50 profit while a $10 loss costs the full $10. To simply break even you need roughly a 54% win rate; at 92% you need about 52%. Neither Bollinger Bands nor RSI hands you that number — your selectivity does. Taking only the setups where all three conditions line up is the difference between a strategy and a coin flip with a fee attached.
Honest Weaknesses
- Strong trends destroy it. In a powerful move, price can walk along the outer band for many candles while RSI stays pinned above 70 or below 30. Every touch looks like a signal and every one fails. The flat-middle-band filter exists precisely for this — use it.
- RSI can stay extreme far longer than you expect. "Overbought" does not mean "about to fall". It means buying has been one-sided recently, which in a trend is normal, not exceptional.
- Waiting for rejection costs you part of the move. Entering on the confirmation candle rather than the touch means a later, worse price. That is the trade-off for filtering out a large share of false signals, and on balance it is worth it.
- OTC pairs behave differently. Synthetic weekend pricing does not always respect the same rhythm as the live market. If you trade OTC, watch the pair for a while before risking anything on it.
- Fewer signals than you want. Done properly this produces a handful of trades per session. The temptation to loosen the rules to trade more is the single fastest way to break it.
Risk Management Rules
- Risk a fixed 1–2% of your balance per trade and never raise the stake to recover a loss.
- Skip any signal that appears while the middle band is sloping steeply — that is a trending market.
- Require all three conditions. Two out of three is not a setup.
- Set a daily loss limit and a daily trade cap, and honour both.
- Log every trade for at least 50 signals on demo before considering real funds. You need your own win rate, not someone else's.
The Verdict
A solid 4 out of 5. This earns its rating for reasons that have nothing to do with hype: both indicators are free and built in, the rules are unambiguous enough that two traders would take the same entries, and the three-condition filter genuinely removes most of the noise that kills simpler band-touch systems. The confirmation candle is what lifts it above the average "buy the lower band" advice floating around.
It loses the fifth star for one honest reason — it is a mean-reversion tool, and mean-reversion tools have a well-known failure mode. Put this in a trending market without the flat-band filter and it will hand you a run of losses. Used selectively, on stretched-but-directionless conditions, with a fixed stake and a real log, it is one of the better free setups you can run on Quotex.
#Quotex #RSI #BollingerBands #FreeStrategy #BinaryOptions #1MinuteStrategy #MeanReversion #TradingStrategy #NoIndicatorsNeeded
Frequently Asked Questions
What are the best RSI and Bollinger Bands settings on Quotex?
Use the platform defaults: Bollinger Bands with a period of 20 and deviation of 2, and RSI with a period of 14 using the 70 and 30 levels. Both are built into Quotex for free and need no adjustment.
Is the RSI and Bollinger Bands strategy free to use?
Yes. Both the Relative Strength Index and Bollinger Bands are standard indicators included in the Quotex platform at no cost. No downloads, custom files or paid tools are required.
When should you avoid this strategy?
Avoid it in strongly trending markets. When the middle Bollinger line is steeply sloped, price can ride the outer band for many candles while RSI stays overbought or oversold, producing repeated failed signals. It works best when the middle band is relatively flat.
What win rate do you need at an 85% payout?
At an 85% payout you need roughly a 54% win rate just to break even, because a loss costs the full stake while a win returns only 85% of it. At a 92% payout the break-even point is around 52%.
This content is for educational purposes only and is not financial advice. Trading involves substantial risk; you can lose some or all of your capital. No result is guaranteed and past performance does not indicate future results. Trade only what you can afford to lose.
Prefer a trend-following approach instead? Compare this with the SuperTrend + Keltner Channel setup, or see how price-action levels work without any indicator at all in our support and resistance guide.