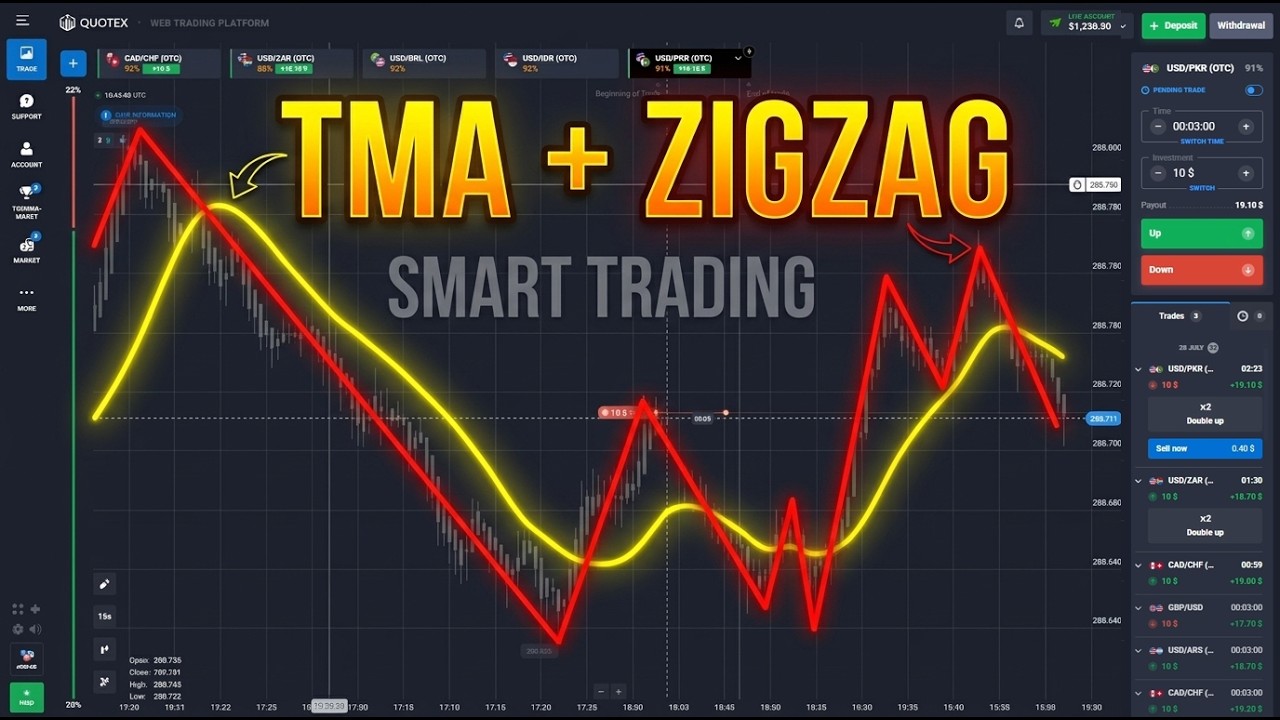
Why This Pairing Is Called Unusual
Most short-expiry setups stack a trend tool with an oscillator — something slow plus something fast. This one does the opposite: it pairs two lagging tools. ZigZag only confirms a swing after price has already reversed, and the Triangular Moving Average is double-smoothed, so it turns later than an EMA of the same length. On paper that sounds like the worst possible combination for a 15-second chart.
In practice it is what makes the setup readable. Because neither line reacts to noise, anything they do show has survived a filter. You are not reacting to every tick — you are waiting for structure to form and for the smoothed trend to agree with it. The trade-off, which we will come back to honestly, is that both tools tell you about the recent past rather than the next candle.
The Chart Setup on Quotex
- Platform: Quotex web trading platform
- Candles: 15 seconds (the 15s button in the timeframe tray)
- Trade duration: 3 minutes (00:03:00) — roughly 12 candles of room
- Indicators: only two —
- ZigZag, drawn red: connects confirmed swing highs to swing lows
- TMA (Triangular Moving Average), drawn yellow: the smoothed trend line
- Stake: fixed $10 per trade throughout
- Pairs traded: majors — AUD/JPY, GBP/USD, EUR/USD, USD/JPY, CAD/JPY at 75–86% — and OTC pairs such as CAD/CHF, USD/IDR, USD/ARS, USD/PKR at 87–93%
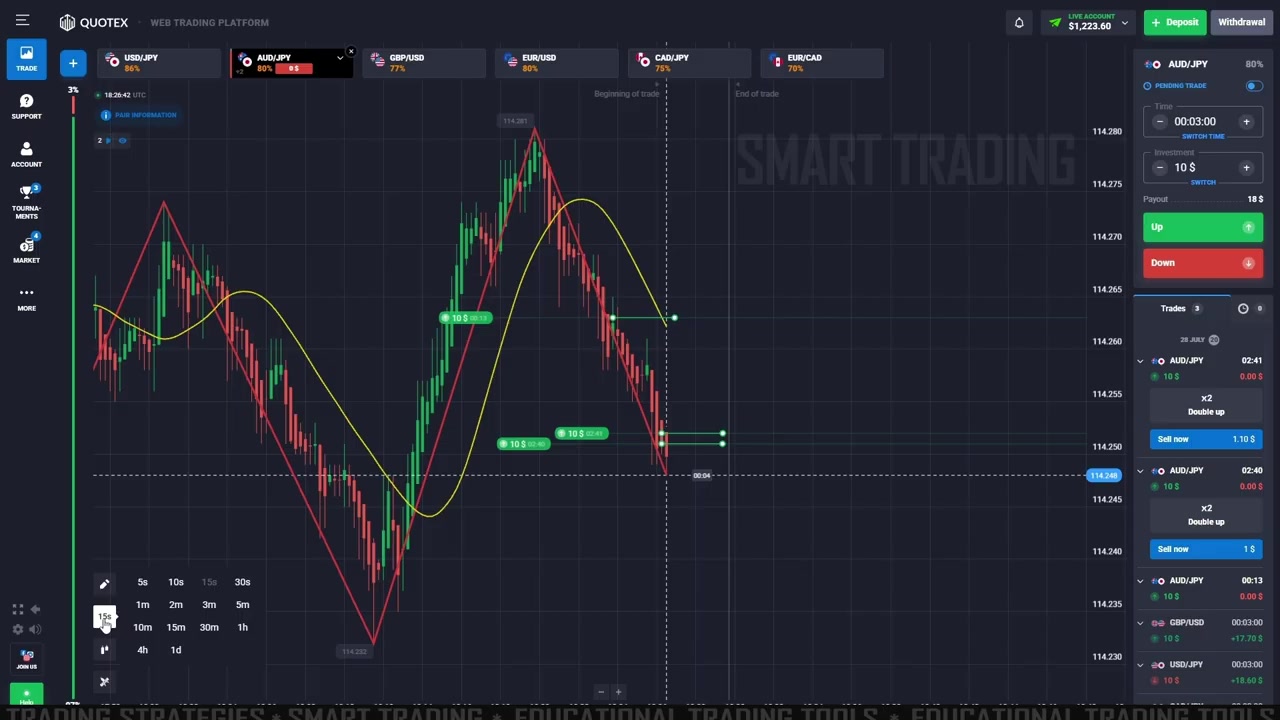
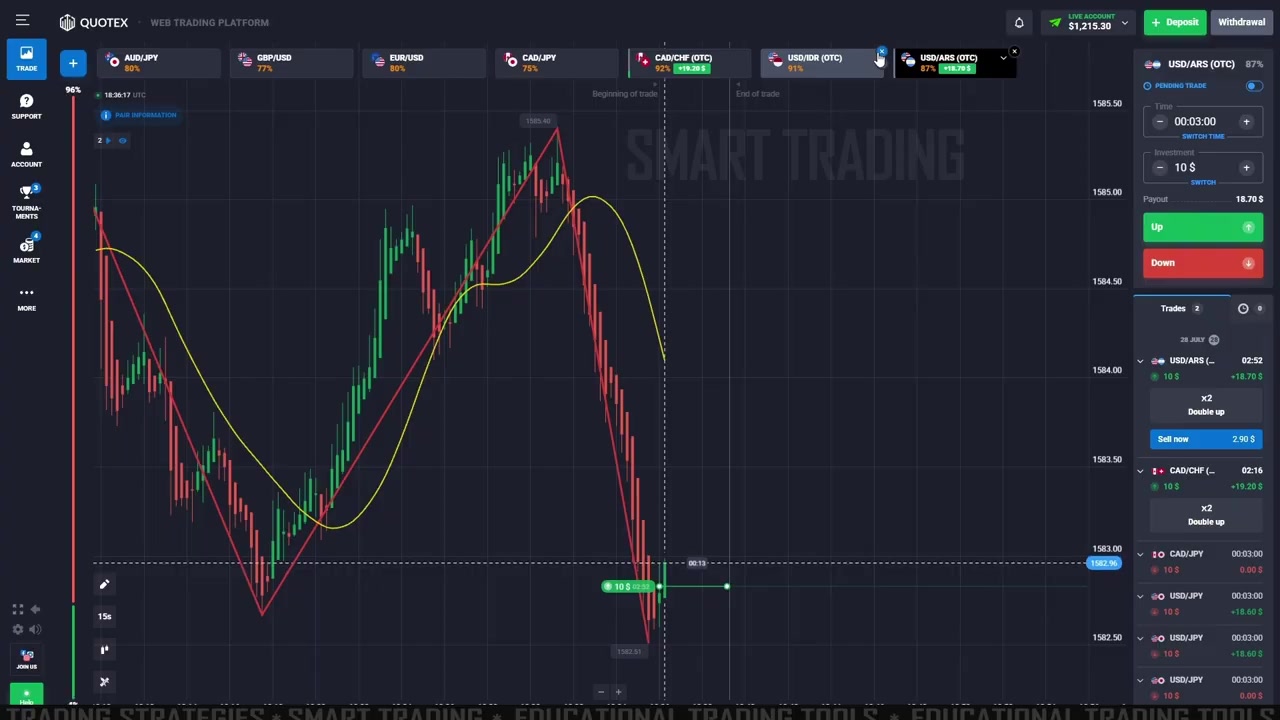
Look at how little is on that chart. The red ZigZag reduces a few hundred candles into four or five legs; the yellow TMA rolls underneath and over the top of them. Everything else — no oscillator, no bands, no arrows — is deliberately absent. On a 15-second chart, the temptation is always to add another confirmation tool, and every one you add gives you another reason to hesitate at the moment you need to click.
How the Two Lines Are Read Together
The read is a sequence, not a single signal:
- ZigZag establishes the leg. A red line running down into a fresh low tells you the current swing is bearish; a leg running up tells you it is bullish.
- TMA has to agree. For a DOWN trade the yellow line should have rolled over and be sloping down, with price trading below it. For an UP trade it should have turned up with price above it. If the ZigZag says one thing and the TMA is still pointing the other way, you skip.
- Enter in the direction of the agreement with a 3-minute expiry, keeping the stake fixed.
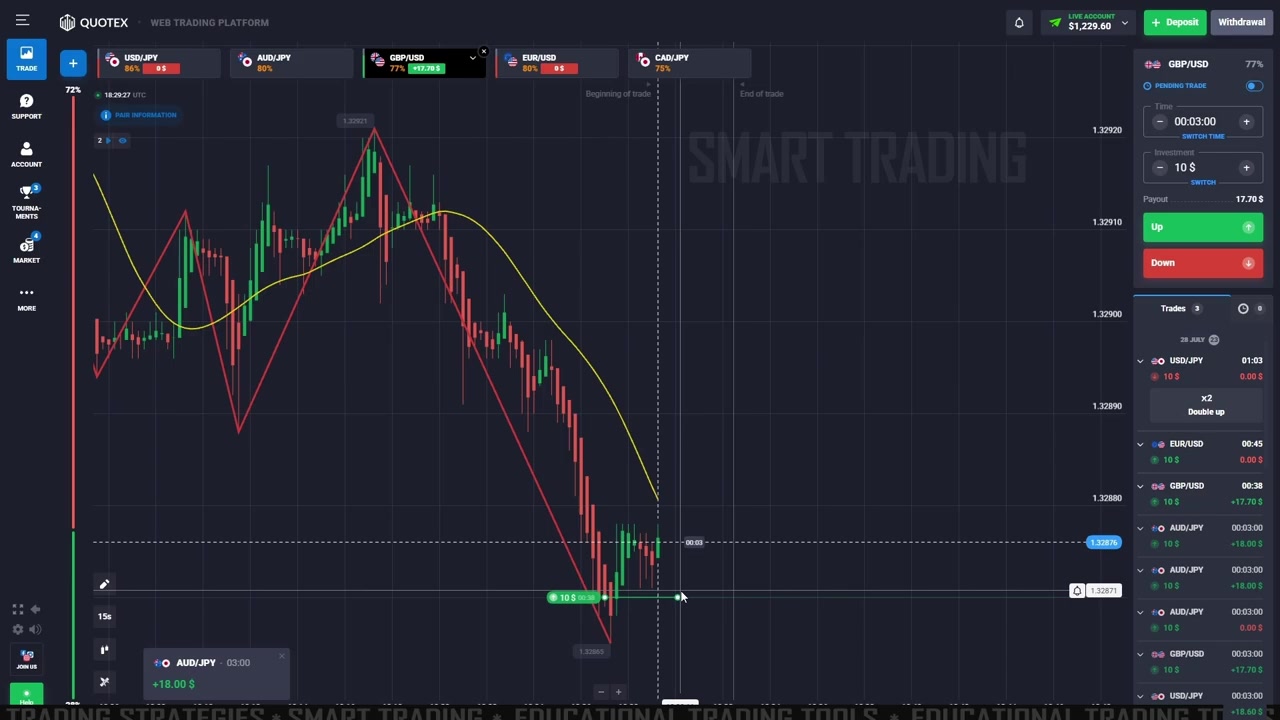
The GBP/USD frame above is the cleanest version of the setup. The ZigZag has drawn a long, uninterrupted leg down — no small counter-legs inside it — and the TMA has rolled from flat into a clear decline with price holding below it. Both tools point the same way, so the DOWN entry is taken with the structure rather than against it. The toast in the corner shows the previous AUD/JPY trade closing at +$18.00.
The mirror case on an OTC pair: the ZigZag turns up off a low and the TMA curls up beneath price. Notice the payout badges on the OTC tabs — 87% to 93%, noticeably better than the 75–80% on the majors. That gap matters more than most traders realise, and we come back to it in the maths below.
Watch the Full Session
See both lines added from scratch, every entry called out, and the trades running to expiry across majors and OTC pairs:
The Payout Maths You Should Do First
Before judging any fixed-time setup, work out what win rate simply keeps you level. A win returns your stake plus the payout; a loss costs the whole stake. At a 90% payout you need to win 52.6% of the time to break even. At 80% that rises to 55.6%, and at 75% it is 57.1%.
That is why the session leans on OTC pairs at 87–93%. Choosing a 92% pair over a 77% one lowers your break-even bar by roughly four percentage points before you have read a single candle — the easiest edge available, and it costs nothing but pair selection.
The Caveat Nobody Mentions: Both Lines Move
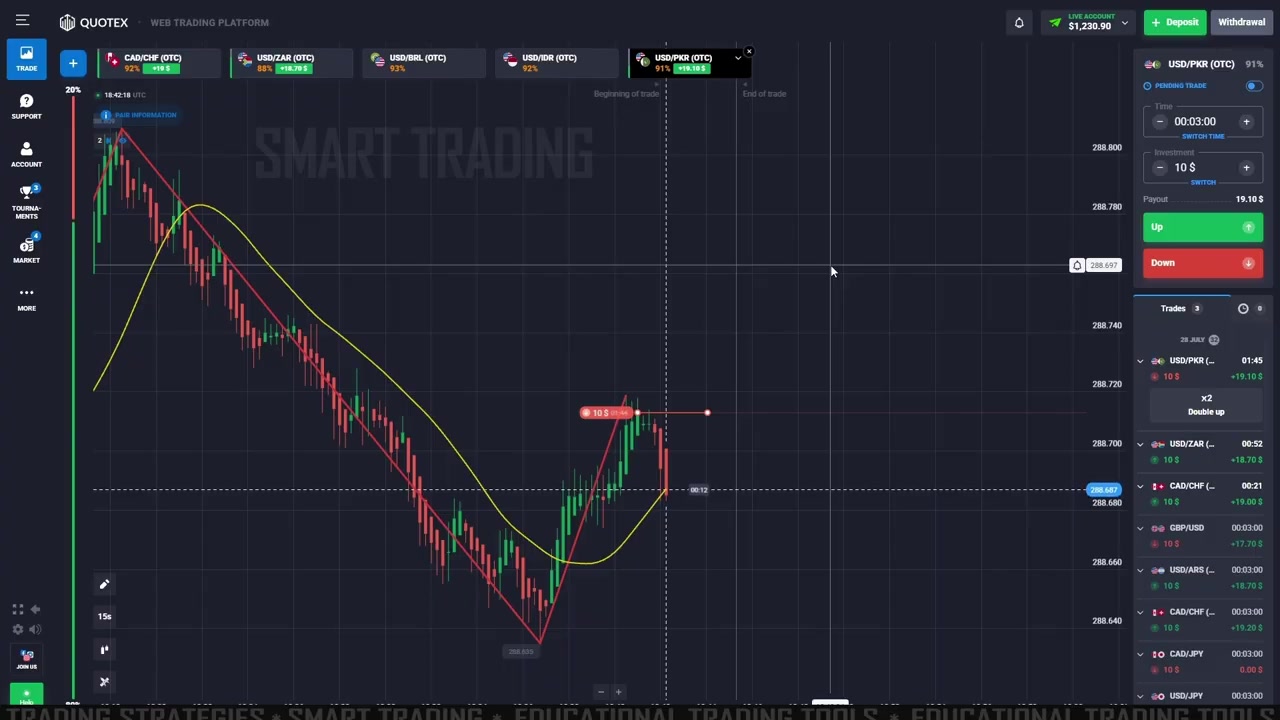
This is the frame worth studying hardest, and it is why the setup earns 4.5 rather than 5. A DOWN position is open — the red marker on the chart — and price is climbing straight into it while the ZigZag leg turns up.
ZigZag repaints its most recent leg by design. The line you are looking at right now is provisional: as long as price keeps extending, the current leg stretches and the last pivot can move. What looks like a confirmed swing while you are deciding can be redrawn a few candles later into something else entirely. On a historical chart, ZigZag looks flawless because every leg has already settled — that is survivorship, not skill.
The TMA has the same character in gentler form. Double smoothing means it is telling you about candles that have already closed, so on a 15-second chart it can still be sloping down for several bars after price has genuinely turned.
The practical defence is discipline, not another indicator: only take a leg that is already several candles old, and treat the newest pivot as unconfirmed until the TMA has visibly followed it. This is exactly the trade the video leaves on screen going the wrong way, and showing it is more useful than another highlight reel.
Honest Weaknesses
- The last ZigZag leg is provisional. The strategy's core signal is the one thing on the chart that can change after you have read it.
- Two lagging tools means late entries. By the time both agree, part of the move has happened. On a 3-minute expiry that lateness is sometimes the whole difference.
- 15-second candles are noisy. Twelve candles inside one trade is not much room for a bad wick to recover from.
- OTC pricing is broker-generated. The best payouts sit on OTC pairs, but those quotes are not an open exchange market, so behaviour there does not transfer one-for-one to the live session.
- Payout ≠ edge. Even at 93%, a loss still costs more than a win pays. The pair selection lowers the bar; it does not clear it for you.
Risk Management Rules
- Keep the stake fixed — the session uses a flat $10 the whole way. Never raise it to recover a loss.
- Skip any setup where the ZigZag and the TMA disagree, however tempting the candles look.
- Prefer the higher-payout pair when two charts show the same quality of setup.
- Set a hard daily loss cap before you start and stop when you reach it.
- Practise the whole routine on a demo balance until the read is automatic. Our PipGems AI Chart Scanner can also grade a setup with a written reason and a confidence level, which is a useful second opinion while you are still learning to skip the marginal ones.
The Verdict
A solid 4.5 out of 5. What earns it: the chart is genuinely minimal, the read is a single sentence you can hold in your head mid-trade, and pairing two slow tools filters out most of the noise that ruins 15-second setups. It also uses tools available on Quotex itself, and the session is honest enough to leave a trade on screen that is going the wrong way.
The missing half-star is the repaint. The ZigZag leg that forms your signal is provisional, and no amount of confidence in the pattern changes that. Treat the newest pivot as a hypothesis, wait for the TMA to confirm it, respect the payout maths when picking pairs, and keep the stake flat — do that and this is one of the more disciplined two-line setups on the platform. Take every leg the moment it appears and the repaint will collect its fee.
Want the same read as an alert on MetaTrader instead of by eye? The TMA + ZigZag indicator plots both lines and fires when they agree.
#Quotex #ZigZag #TMA #TradingStrategy #15SecondCandles #FixedTime #BinaryOptions #OTCTrading #TechnicalAnalysis
Watch the session
This content is for educational purposes only and is not financial advice. Trading involves substantial risk; you can lose some or all of your capital. No result is guaranteed and past performance does not indicate future results. Trade only what you can afford to lose.