"Pocket Option 3 Lines"
"Easy Pocket Option Strategy"
"3 Moving Average Trend Trading"
The Pocket Option 3 Lines Easy Strategy
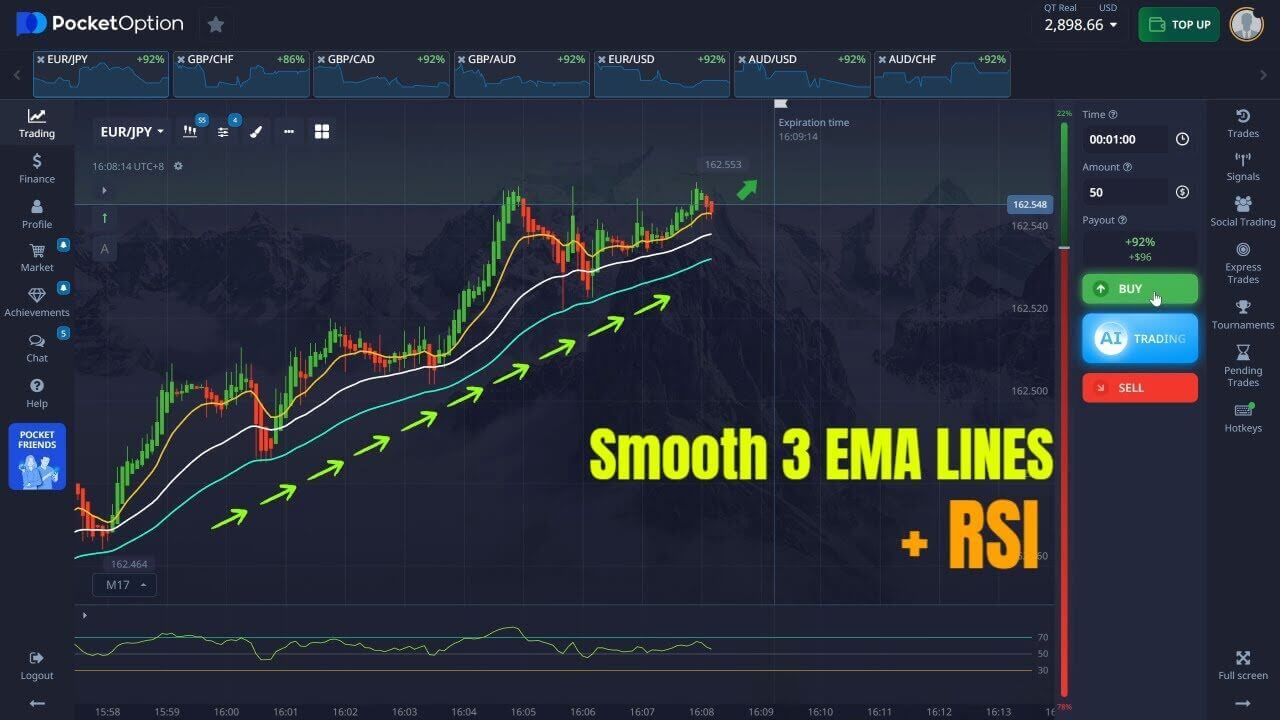
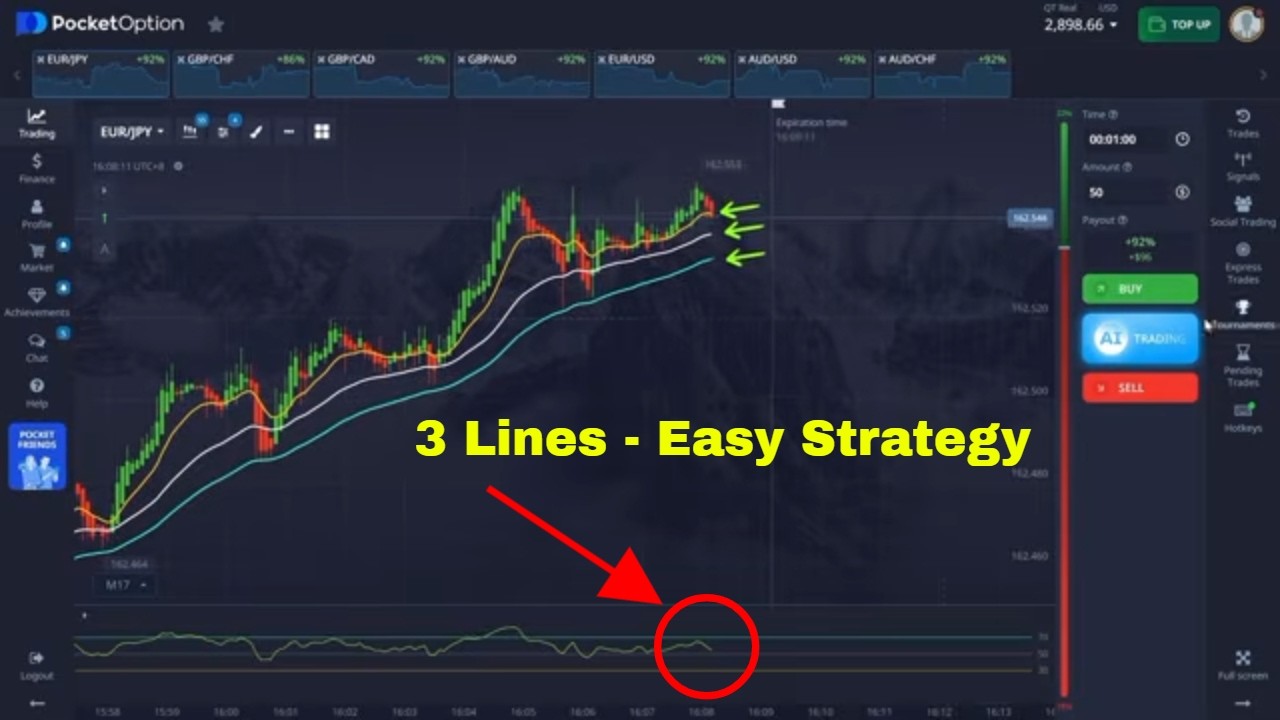
This is one of the simplest ways to read direction on Pocket Option. Instead of crowding the chart with dozens of tools, you only watch three moving average lines stacked together as a ribbon, with one momentum oscillator at the bottom for confirmation. When the three lines fan out in the same direction, the trend is clear — and that is when you look for a trade.
The three lines work as a fast, medium, and slow moving average. On the chart they show up as a yellow line (fast), a white line (medium), and a cyan/teal line (slow). The order of the lines tells you everything you need to know about the trend.
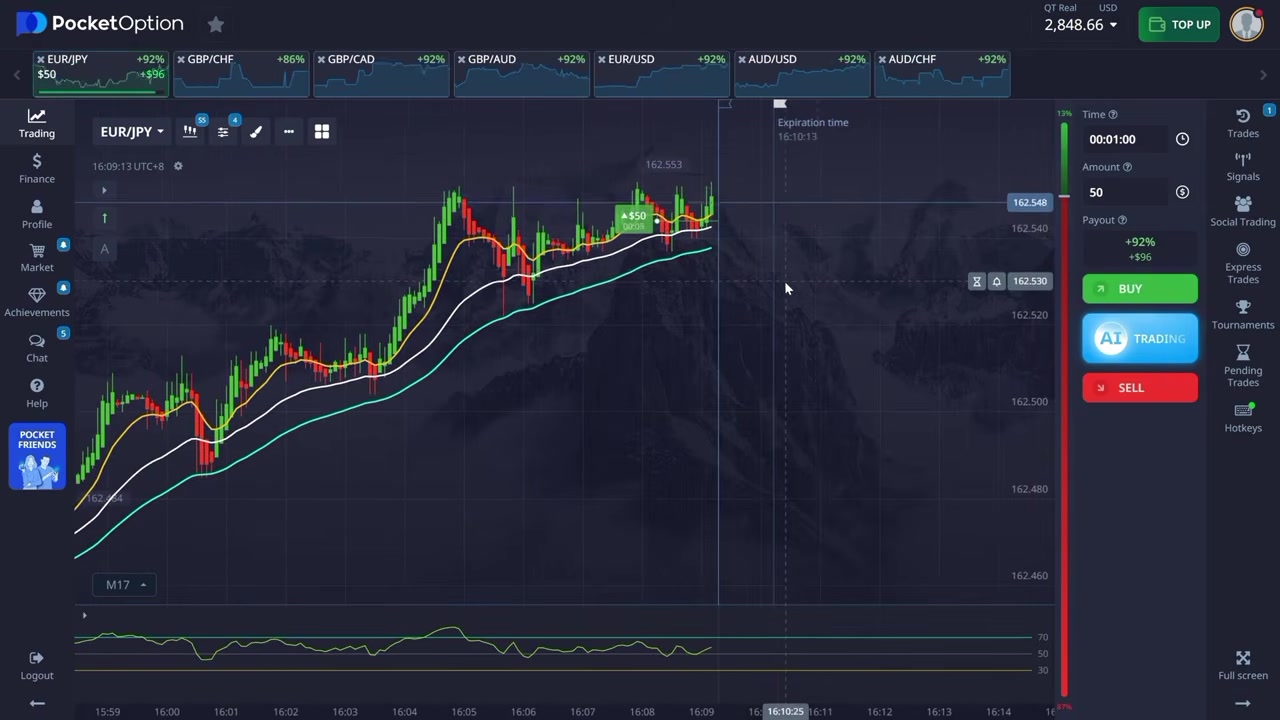
Chart Setup
- Three moving averages — add three moving averages with fast, medium, and slow periods so they form a ribbon (for example a fast line near price and a slower line further away). Give each a different colour so they are easy to read at a glance.
- Momentum oscillator — add one oscillator below the chart on a 70 / 50 / 30 scale (such as RSI) to confirm momentum. Above the 50 midline favours buys; below it favours sells.
- Candle time frame — use a short 5-second candle so the lines react quickly to price.
- Trade duration — set the expiry to 1 minute, which matches the speed of this setup.
Tradable Assets
This strategy works on Pocket Option currency pairs and OTC assets. Pairs like EUR/JPY, EUR/USD, GBP/CAD, GBP/CHF, AUD/USD and AUD/CHF — which often run with high payout rates — are good candidates because they trend smoothly enough for the ribbon to stay ordered.
How to Read the Signals
Buy (Higher) Setup
- The three lines are stacked bullish — yellow above white above cyan — and all three are sloping up.
- Price is trading above the ribbon, then pulls back to the fast (yellow) line and bounces.
- The oscillator is holding above the 50 midline, confirming upward momentum.
- When these line up, look for a Higher / Buy trade.
Sell (Lower) Setup
- The three lines are stacked bearish — cyan above white above yellow — and all three are sloping down.
- Price is trading below the ribbon, then pulls back up to the fast line and rejects.
- The oscillator is holding below the 50 midline, confirming downward momentum.
- When these line up, look for a Lower / Sell trade.
Trade Execution Tips
- Only trade when the three lines are clearly separated. When they tangle together the market is ranging — stand aside.
- Wait for price to come back to the fast line rather than chasing a candle that has already run far from the ribbon.
- Let the oscillator agree with the line order before you commit. Mixed signals are a reason to skip the trade.
- Limit your number of trades per session and keep a fixed stake. Trading this setup well takes patience and discipline more than speed.
Watch the Full Strategy Video
Risk Disclaimer
This content is for educational purposes only. Trading involves risk. Past results do not guarantee future outcomes. Always practice responsible money management, limit your daily trades, and never risk money you cannot afford to lose.
#PocketOption #3LinesStrategy #MovingAverage #TrendTrading #BinaryOptions #Forex #OTCAssets #TradingStrategy