The Signal Comes to You — You Still Decide
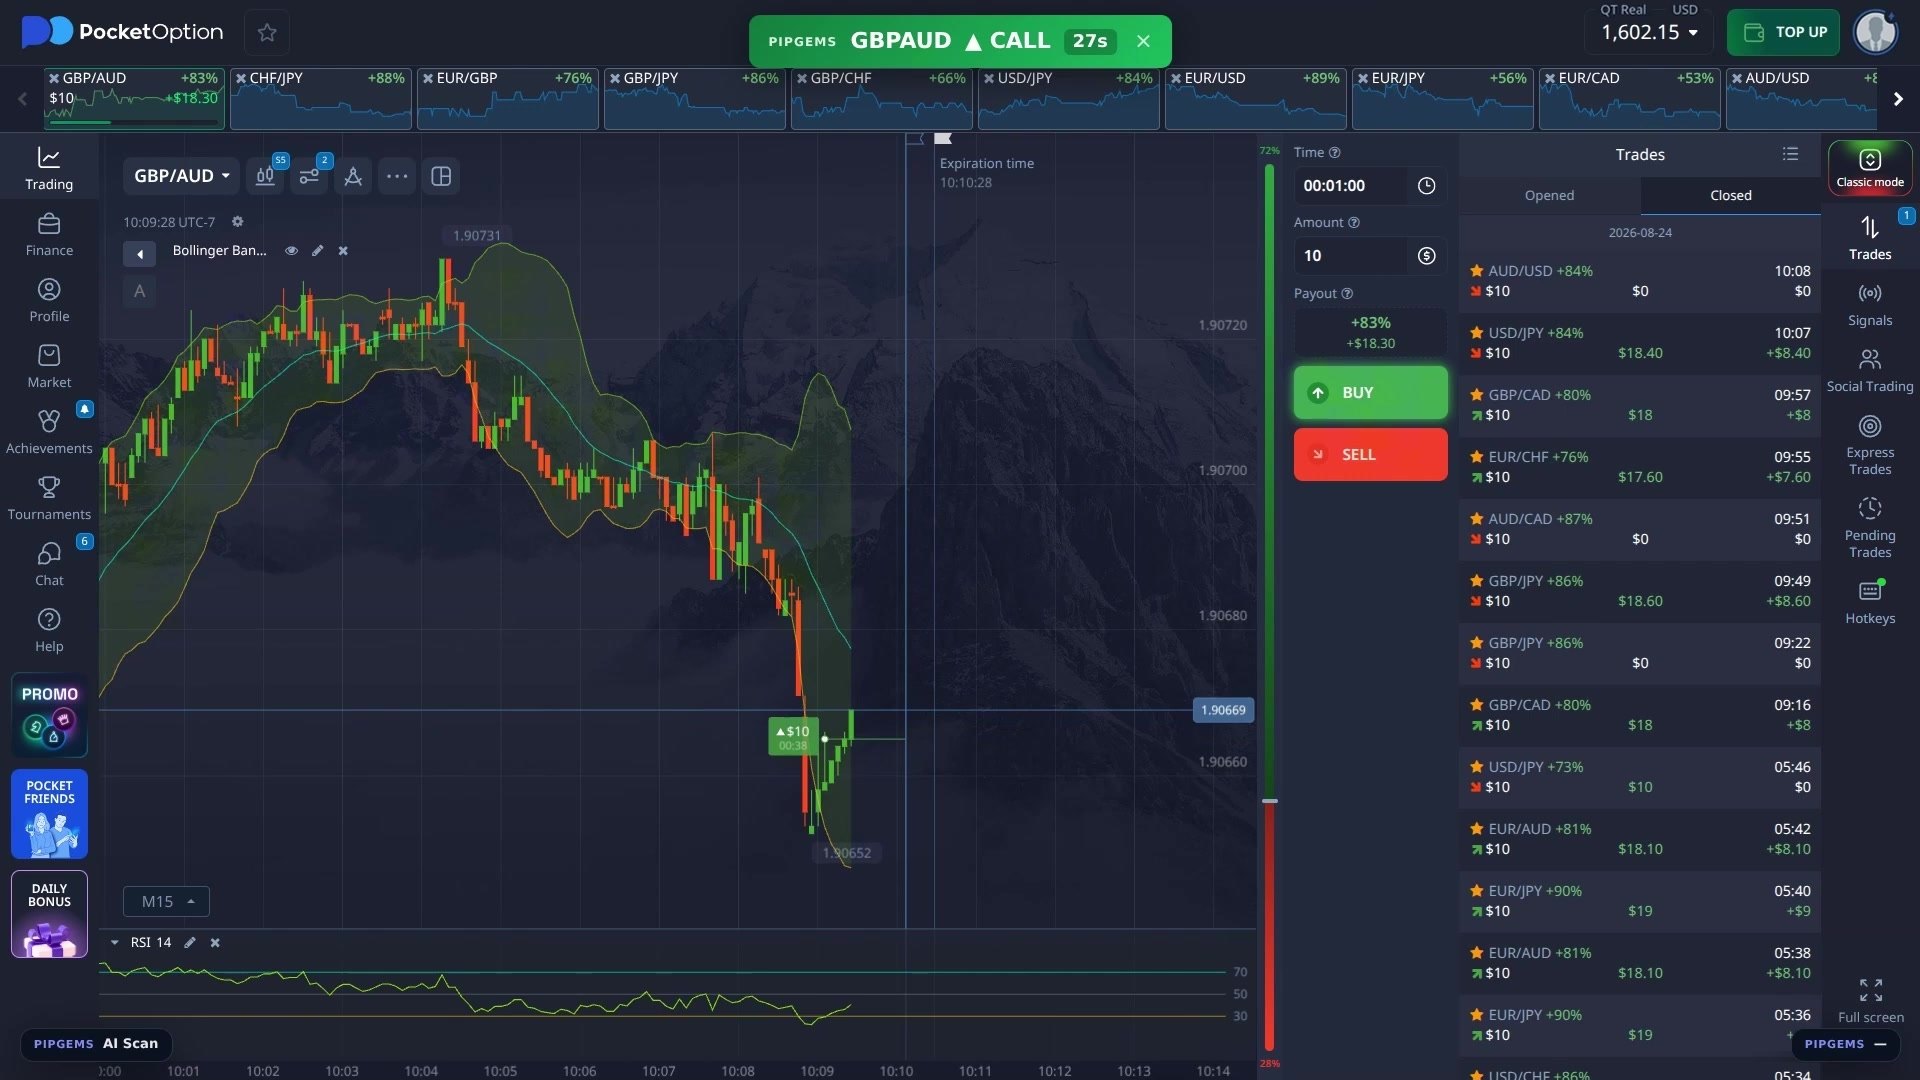
The banner across the top of that chart is the whole idea. PIPGEMS · GBPAUD · CALL · 27s — the pair, the direction, and a countdown, sitting on top of the Pocket Option page. No second tab, no switching back and forth to see whether a signal fired while you were looking at the chart.
What makes this worth writing about is the part that comes after the alert. The signal is not the trade. The chart underneath still has Bollinger Bands and RSI 14 on it, and those are there to give you a reason to refuse a signal. An alert that fires while price is mid-band and RSI is flat is a different proposition from one that fires at a band edge with RSI turning.
That is a healthier way to use a signal service than the usual one, which is to take everything it sends and hope.
The setup in the video
- Platform: Pocket Option
- Signals from: PipGems, delivered by its browser extension as a banner on the broker page
- Chart: 5-second candles (the S5 badge on the chart toolbar)
- Confirmation indicators: Bollinger Bands and RSI 14 — two indicators, nothing else
- Trade duration: 1 minute
- Stake: flat $10 on every trade
- Pairs: whatever the signal names — GBP/AUD, GBP/CAD, GBP/JPY, EUR/CHF, AUD/CAD, AUD/USD, USD/JPY appear in the session
Where the Signals Come From
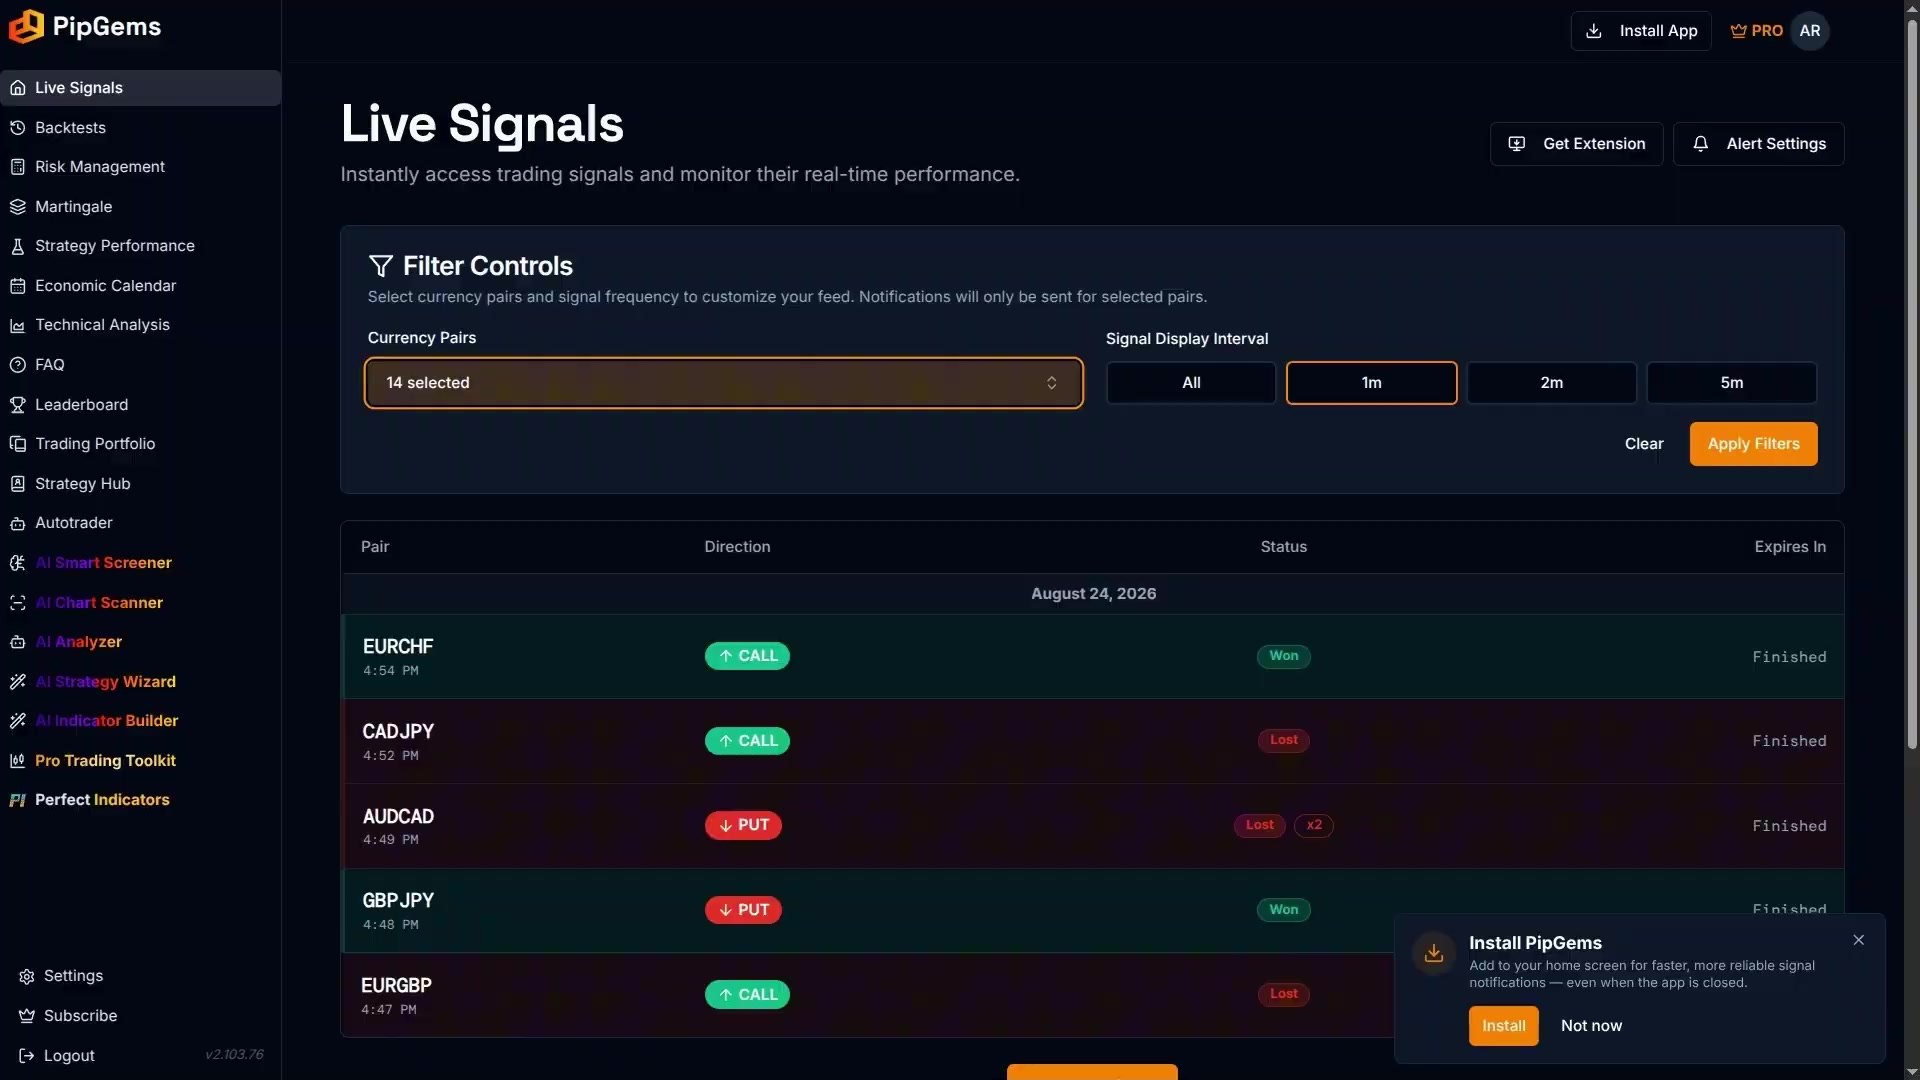
Inside the app, the Live Signals page is a plain table: pair, direction, status, expiry. There is a filter above it for which currency pairs you want and how often you want to be told — the session in the video runs on 14 selected pairs at a 1-minute display interval.
Two details are worth pointing out because most signal services hide both. The status column records Won and Lost on past signals, in public, including the losses. And the filter means you are not obliged to drink from the firehose — narrowing to pairs you actually watch is the difference between a tool and a nuisance.
The Session, With the Losses Left In
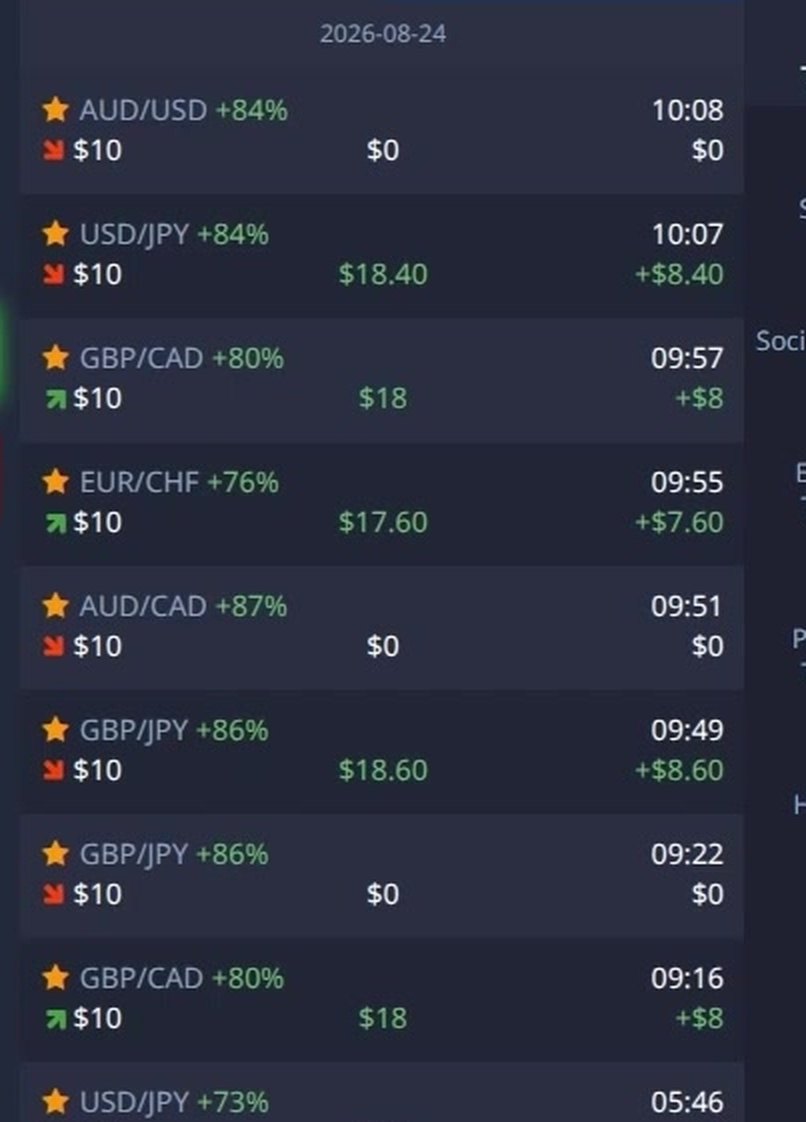
This is the closed-trades panel from the broker, not a screenshot of a spreadsheet. Every trade in the block, in order:
- 09:16 — GBP/CAD, 80% — won, +$8.00
- 09:22 — GBP/JPY, 86% — lost, −$10.00
- 09:49 — GBP/JPY, 86% — won, +$8.60
- 09:51 — AUD/CAD, 87% — lost, −$10.00
- 09:55 — EUR/CHF, 76% — won, +$7.60
- 09:57 — GBP/CAD, 80% — won, +$8.00
- 10:07 — USD/JPY, 84% — won, +$8.40
- 10:08 — AUD/USD, 84% — lost, −$10.00
Five wins, three losses. Net +$10.60 on $80 staked.
Read that properly rather than as a win. Eight trades is a tiny sample — small enough that one more loss would have cut the profit almost in half, and two would have erased it. What the block does show is the shape of an honest session: the losses are not clustered at the start where they could be explained away, and the account still finished ahead.
Why 62.5% is the number that matters
The payouts here run from 76% to 87%, averaging about 84%. At an 84% payout a winning $10 trade returns $8.40 while a loser costs the full $10, so break-even is:
100 ÷ 184 = 54.35% of trades must win.
The session won 62.5%. That is genuinely above the line — but the gap is eight percentage points on an eight-trade sample, which is well inside what luck produces. Judge a signal service over a few hundred trades against its own break-even number, never over a morning.
Watch the full session
Ten minutes, every alert and every trade including the ones that lost:
Honest Weaknesses
- Eight trades proves nothing. It is a demonstration, not evidence. Any method can produce 5–3 over a morning, and so can a coin.
- You are trusting somebody else's logic. The alert tells you the pair and direction, not why. If you cannot see the reason on your own chart, you cannot tell a good signal from a stale one — which is exactly what the Bollinger and RSI filters exist to fix, and why skipping them defeats the point.
- One-minute expiries are hostile. Over sixty seconds price is close to a coin flip plus the spread, and the payout maths is working against you the whole time.
- The payout varies more than you would think. 76% and 87% appear in the same session. At 76% you need 56.8% correct; at 87%, 53.5%. Same signals, different bar to clear.
- Signals arrive faster than judgement. With 14 pairs selected, alerts come often enough that "just take it" becomes the path of least resistance. The filter settings matter as much as the strategy.
- The extension only displays. It draws a banner and nothing else — it never clicks, fills or places anything on the broker page. That is a feature, not a limitation, but it does mean every trade is still your decision and your responsibility.
Risk Management Rules
- Flat stake — $10 in this session, the same on every trade. Never raise it to win a loss back.
- Cap the number of trades for the day and stop when you reach it. Alert-driven trading makes overtrading effortless.
- Skip the alert when the chart does not agree. A signal you refuse costs nothing.
- Filter down to a handful of pairs you actually watch rather than all of them.
- Check the payout on the pair before you take the trade, and know the win rate it demands.
- Run it on a demo account long enough to see a losing streak before you fund anything.
The Verdict
4.5 out of 5. What earns it: the delivery is genuinely good — the alert appears on the broker page with a live countdown, so nothing is missed and no tab-switching is needed; the app publishes Won and Lost on past signals rather than only the winners; the pair filter puts you in control of the volume; and the session in the video is shown with its three losses intact, which is rarer in this niche than it should be.
The missing half point is not about the tool. It is that a signal service can hand you an entry but not the judgement to refuse one, and on one-minute expiries that judgement is most of the edge. The Bollinger and RSI filters on the chart are the right answer to that, and they only work if you are willing to let alerts pass.
If you would rather see the same band-and-RSI read marked on a MetaTrader chart with its own alerts, that is our RSI + Bollinger Alert indicator, part of the lifetime library. For the mobile version of this signal overlay, see the floating overlay on Pocket Option mobile.
Frequently Asked Questions
What is shown in the banner on the chart?
The PipGems browser extension draws a banner across the top of the Pocket Option page carrying the pair, the direction and a live countdown — for example "PIPGEMS GBPAUD CALL 27s". It means you do not have to keep a second tab open to see whether a signal has fired.
Does the extension place trades for me?
No. It is display-only. It draws its own banner and never clicks, fills or submits anything on the broker page, so every entry remains your own decision.
What indicators are on the chart, and why?
Bollinger Bands and RSI 14, on 5-second candles. They are not there to generate signals — the app does that. They are there to give you a reason to refuse one, so an alert that fires with price mid-band and RSI flat can be skipped.
What were the actual results in the video?
Eight trades between 09:16 and 10:08 at a flat $10 stake: five wins and three losses, for a net of +$10.60 on $80 staked. That is a 62.5% win rate on a very small sample, and the losses are shown rather than edited out.
What win rate do these payouts need to break even?
The payouts in the session ranged from 76% to 87%, averaging about 84%. At 84% the break-even rate is 54.35%, calculated as 100 divided by 184. At 76% it rises to 56.8% and at 87% it falls to 53.5%, so the pair you take the signal on changes the bar before the signal does.
This content is for educational purposes only and is not financial advice. Trading involves risk. Past results do not guarantee future outcomes. Always practice responsible money management, limit your daily trades, and trade only what you can afford to lose.