What is RSI Bollinger Alert?
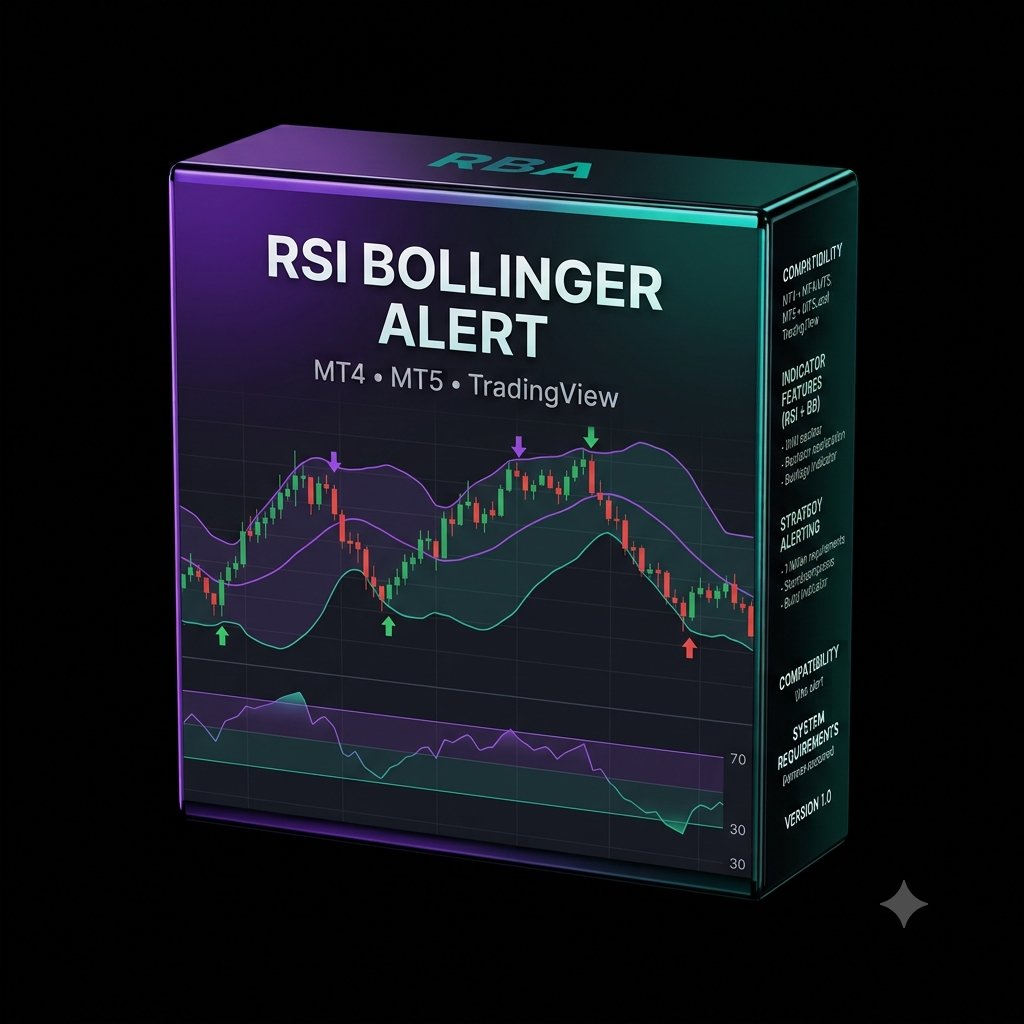
RSI Bollinger Alert is a two-in-one reversal signal indicator for MetaTrader 4 and MetaTrader 5. It combines a Bollinger Bands re-entry (period 20, deviation 2.0 by default) with RSI confirmation (period 14), so a band touch only becomes a signal when momentum agrees.
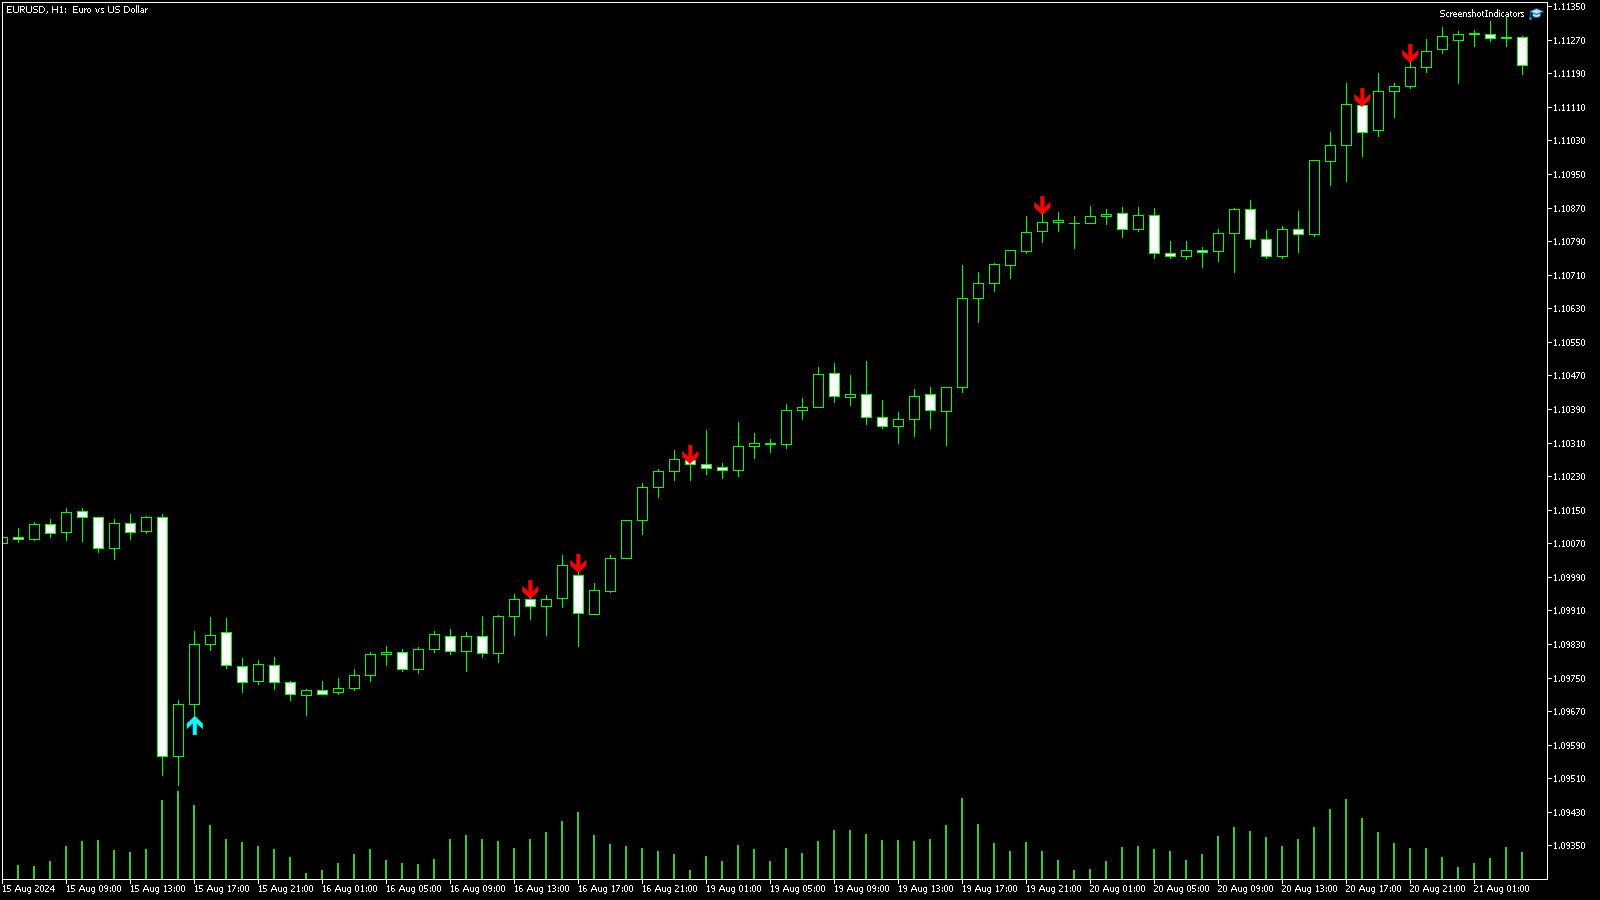
How the Signals Work
- BUY / CALL arrow: price closes back above the lower Bollinger Band while the RSI is still in the lower half of its range — an oversold stretch snapping back.
- SELL / PUT arrow: price closes back below the upper Bollinger Band while the RSI is still in the upper half of its range — an overbought stretch snapping back.
- Non-repaint: signals confirm on the closed candle, so an arrow stays put once it prints — what you see in history is what you would have traded live.
Built-In Alerts
The moment a valid signal appears, RSI Bollinger Alert can notify you four different ways — each one can be switched on or off in the settings:
- 📢 Popup alert inside MetaTrader
- 🔊 Sound alert so you hear every signal
- 📱 Mobile push to the MetaTrader app on your phone
- ✉️ Email alert straight to your inbox
MT4 & MT5 Versions Included
You get both versions — MetaTrader 4 (.ex4) and MetaTrader 5 (.ex5) — so the exact same signals work on whichever MetaTrader platform you trade.
Adjustable Settings
Tune the indicator to your own style — the RSI period and buy/sell levels, the Bollinger period and deviation, plus arrow codes, offset, and each alert toggle.
How to Use RSI Bollinger Alert
Drag RSI Bollinger Alert from the Navigator panel onto your chart. This is a mean-reversion tool — it catches price snapping back after stretching too far — so it performs best in ranging or gently-trending markets. M5–M30 is popular for binary/FTT reversal trading; H1 for forex range plays.
Key Settings
| Setting | Default | What it does |
|---|---|---|
| Bollinger Period / Deviation | 20 / 2.0 | Defines the bands — a wider deviation (2.5) means rarer, deeper stretches |
| RSI Period | 14 | The momentum confirmation |
| RSI Buy-Below / Sell-Above | 50 / 50 | Buys need RSI under this, sells above it — tighten to 40/60 for deeper-oversold/overbought signals only |
Trading the Arrows
- Aqua arrow (BUY / CALL): price just closed back inside the bands after an oversold stretch — enter on the next candle open.
- Red arrow (SELL / PUT): price closed back under the upper band after an overbought stretch.
- Signals confirm on the closed candle — arrows never repaint or move.
- Tip: skip signals during strong one-way trends (price can ride a band for hours) — reversal tools want a market that breathes both ways.
Note: This indicator is a decision-support tool for educational purposes. No indicator guarantees results — always confirm with your own analysis and use responsible money management.