A Second Opinion, Not a Signal Service
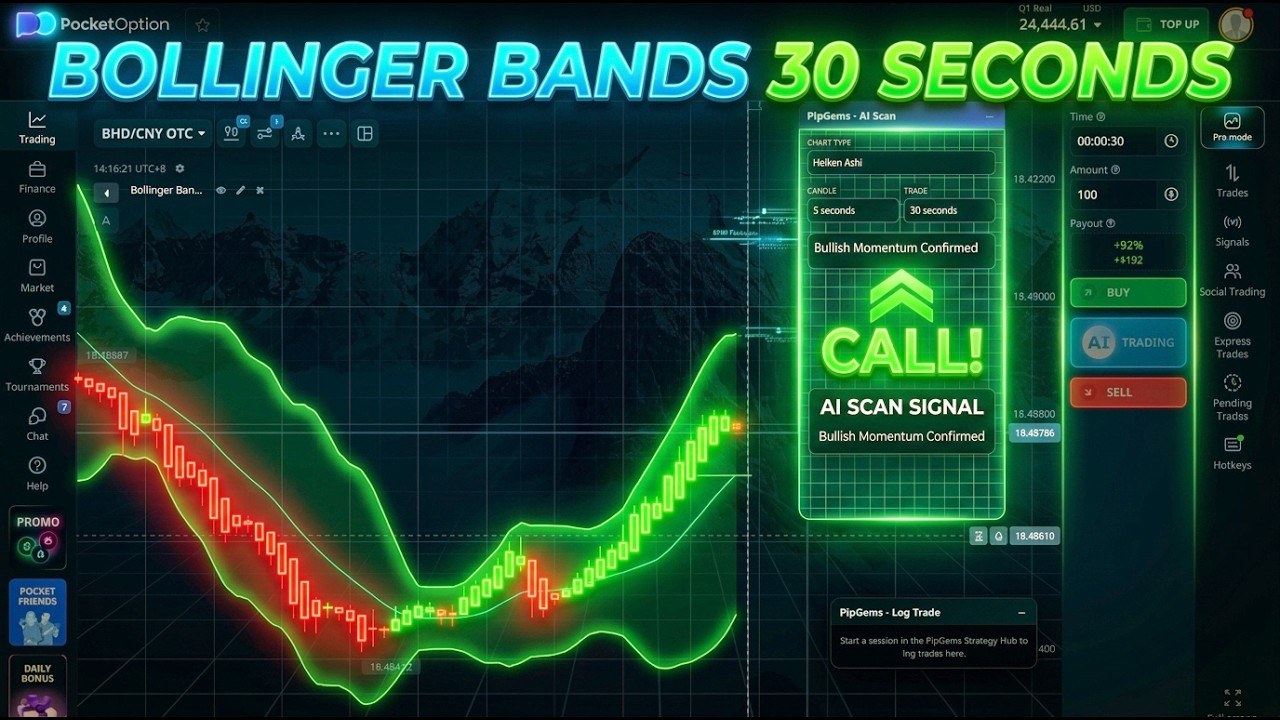
Most tools sold as "AI signals" push alerts at you on their own schedule. The PipGems AI Chart Scanner works the other way round: it sits in a panel on the broker page and does nothing until you press Scan Chart. It then reads what is on screen — the candles, the bands, the recent wicks — and answers with one of three verdicts: CALL, PUT or WAIT, a confidence label, and three or four lines explaining the read.
That distinction matters more than it sounds. You are not subscribing to a feed; you are asking a question about the chart in front of you and getting a written second opinion. Whether that is worth having is the whole subject of this post.
The Setup
- Platform: Pocket Option, OTC pairs at 92% payout
- Chart type: Heiken Ashi (set in the scanner, matched on the broker chart)
- Candles: 5 seconds | Trade duration: 30 seconds
- Indicator: Bollinger Bands, period 12, deviation 3 — the only one on the chart
- Stake: flat $100, unchanged all session
- Tool: PipGems Pro + the Signal Companion browser extension (Chrome, Brave, Edge, Opera)
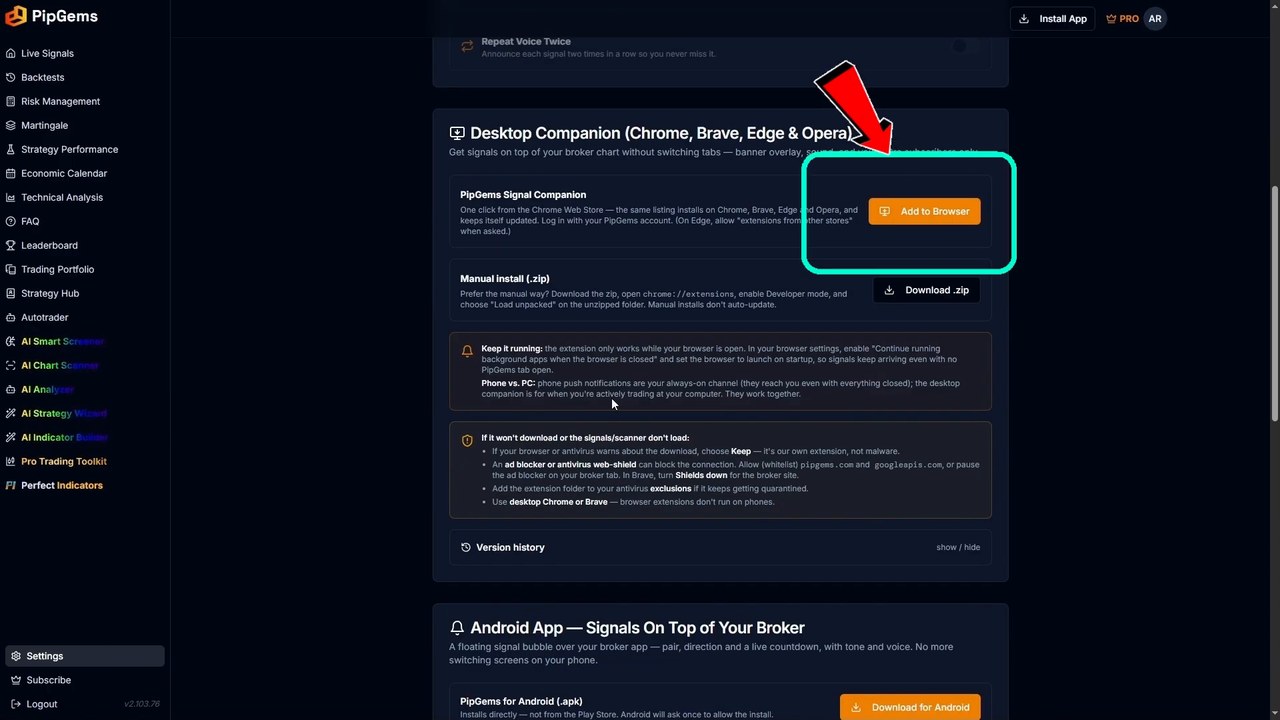
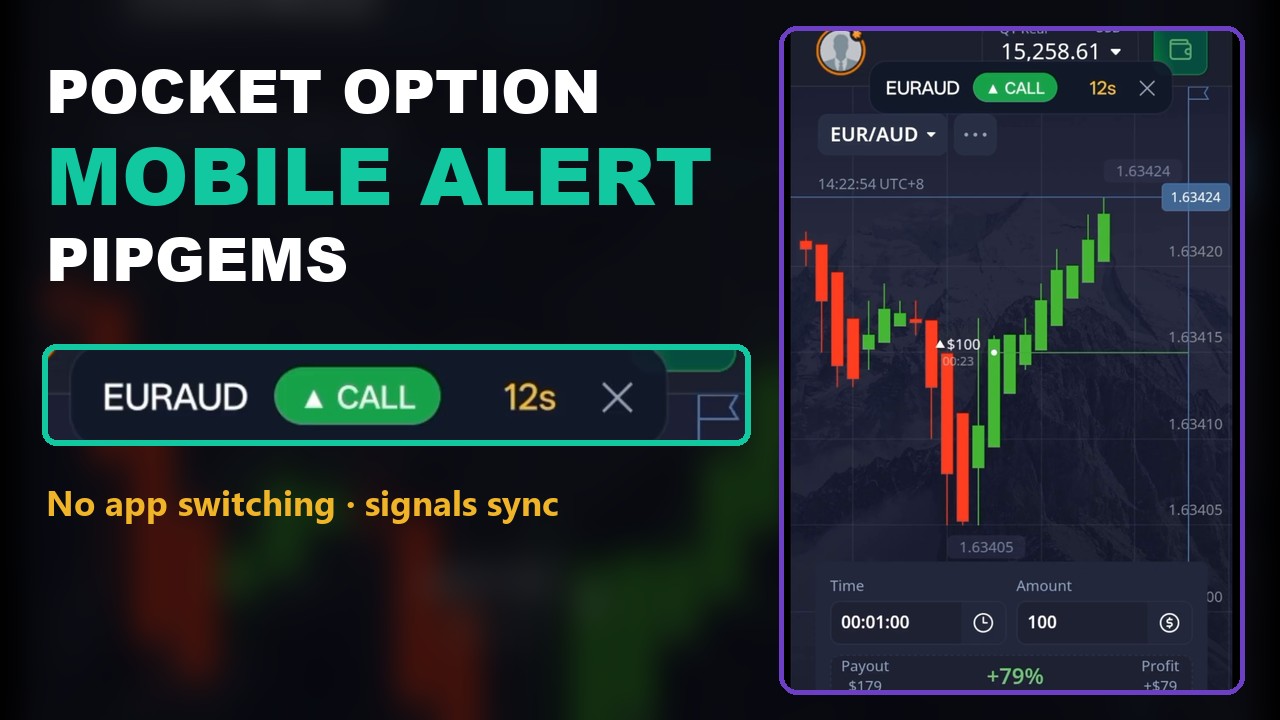
Install is one click from the Desktop Companion section of the PipGems site — the same listing works on Chrome, Brave, Edge and Opera, with a manual .zip option if you prefer unpacked extensions. One detail the page is honest about: the extension only works while the browser is open. If you want alerts with everything closed, that is what the phone push notifications are for.
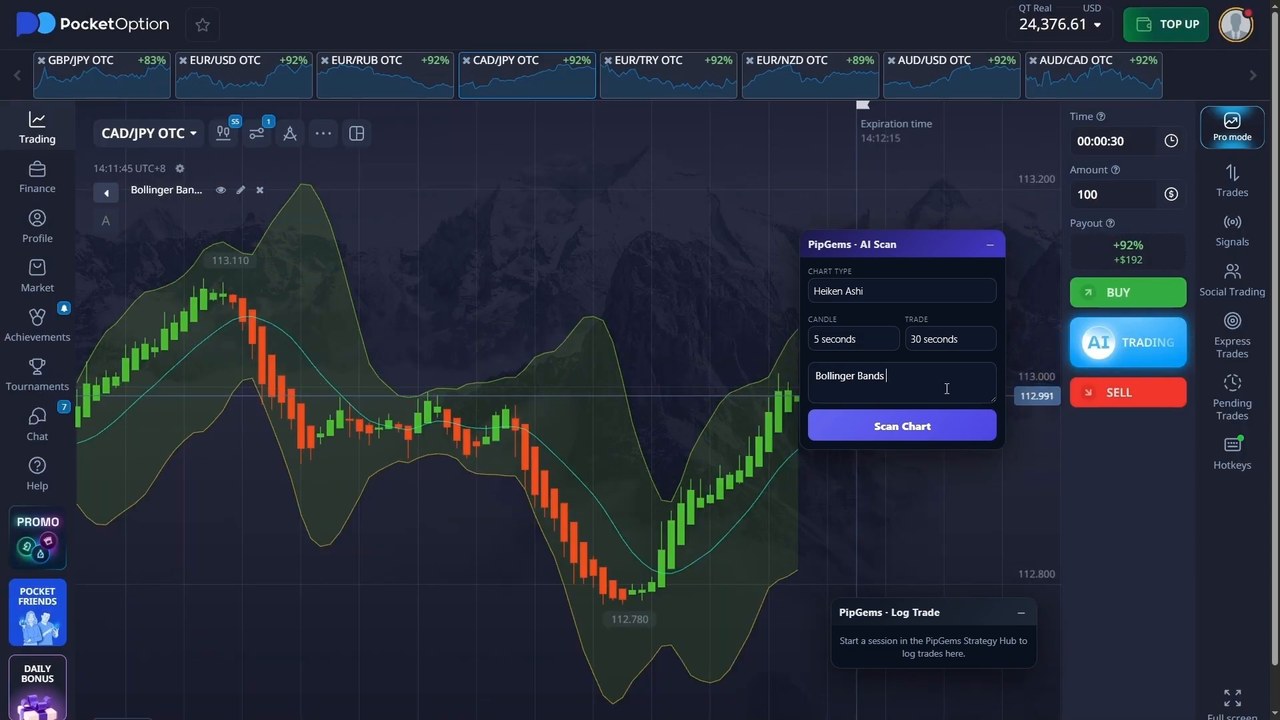
After logging in, the panel appears on the Pocket Option tab. Three fields decide everything: chart type (Heiken Ashi), candle and trade length (5 seconds / 30 seconds), and a free-text note telling the scanner what is on the chart — here, "Bollinger Bands with a period of 12 and a deviation of 3". That note is not decoration: the scanner reads the chart in the context you give it, so a wrong note gets you a confident answer about the wrong indicator.
What the Scanner Actually Reads
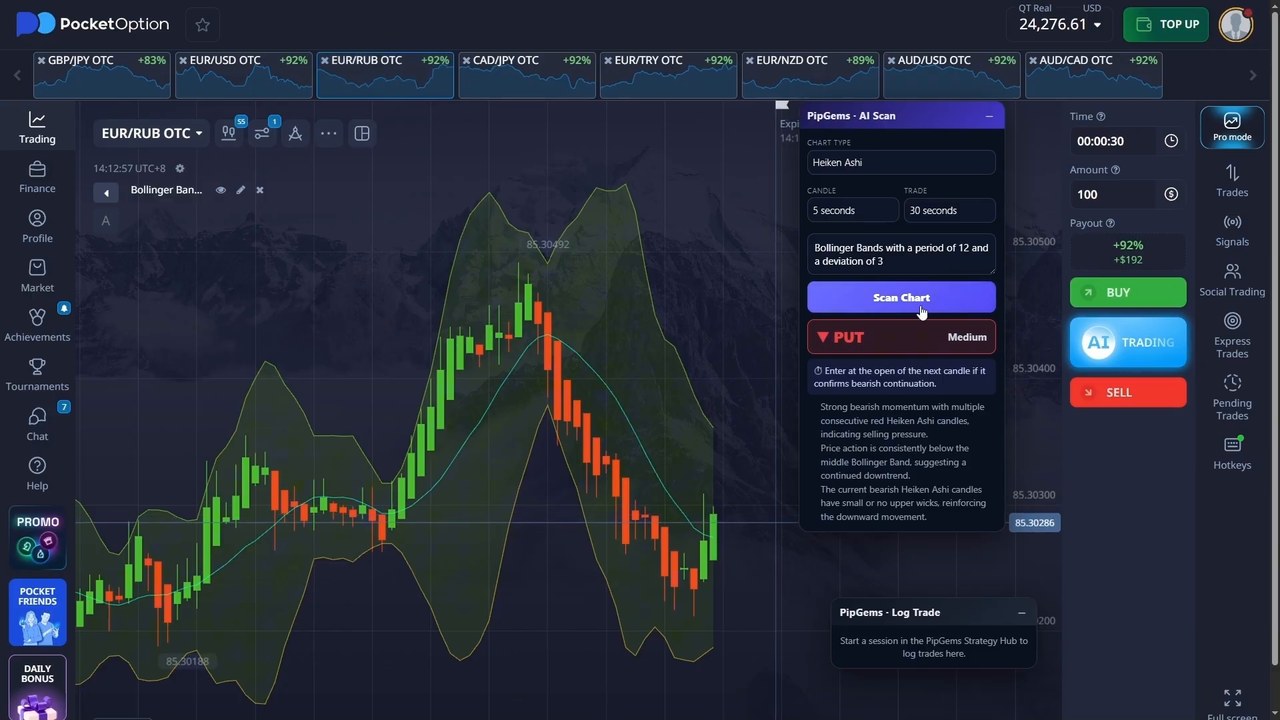
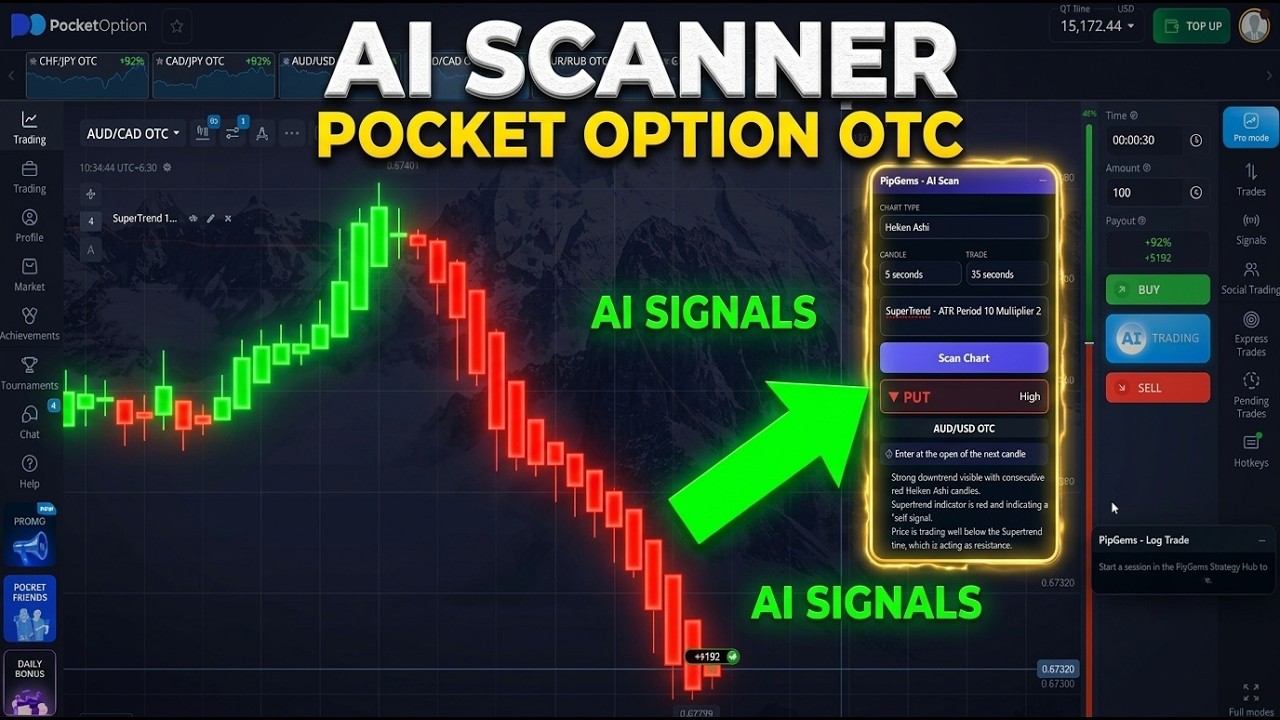
A returned signal is not a bare arrow. The PUT above comes with its reasoning: consecutive bearish Heiken Ashi candles, price holding below the middle band, and current candles showing small or no upper wicks. Read enough of these and the pattern behind them is clear — three things are being combined:
- Heiken Ashi colour runs. A sequence of same-colour candles is treated as momentum; a first opposite-colour candle after a long run is treated as a possible shift.
- Position relative to the bands. Riding the outer band means trend continuation; a touch and pull-back from it means exhaustion. Consistently on one side of the middle band is the trend filter.
- Wick behaviour. Missing wicks in the trend direction read as strength; growing wicks against it read as pressure building the other way.
None of that is exotic — it is what a discretionary trader would say out loud. The tool's value is that it says it in two seconds, in writing, before you click.
The Verdict Worth Paying For Is "WAIT"
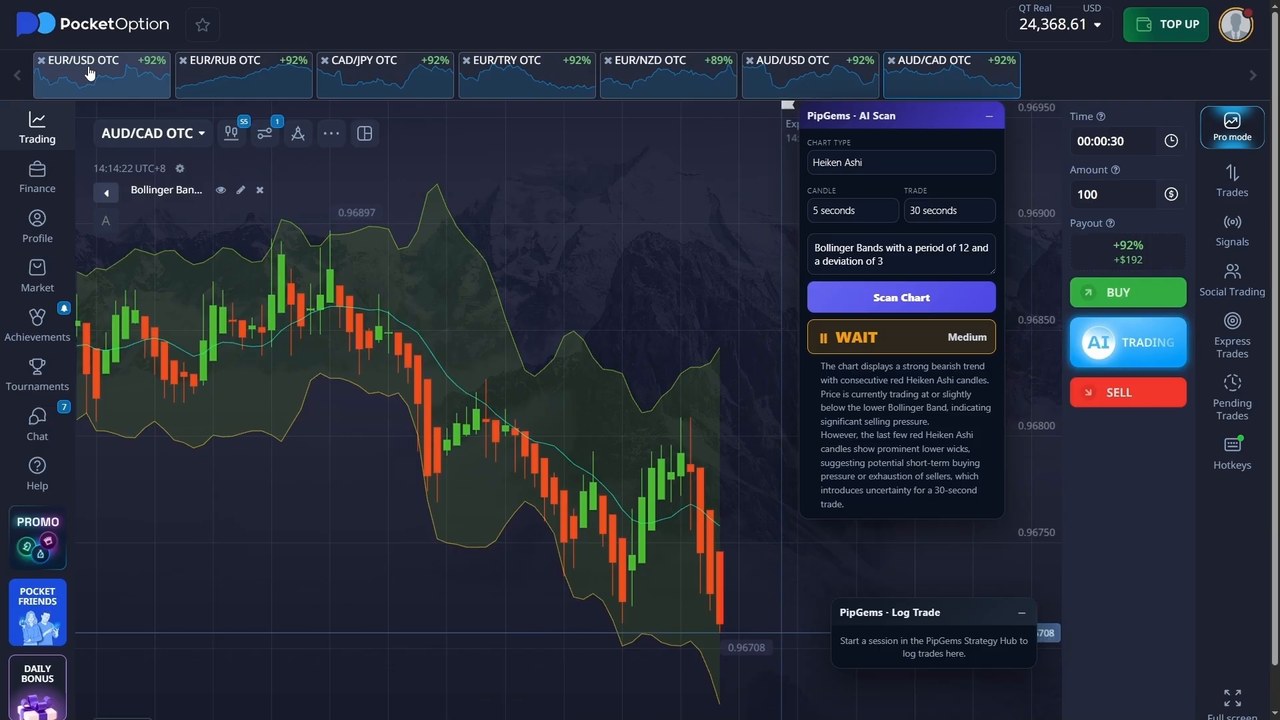
Here the chart is in a clean downtrend at the lower band — exactly the picture that tempts a put. The scanner returns WAIT instead, and says why: the last few candles are showing prominent lower wicks, which suggests short-term buying pressure or seller exhaustion, "which introduces uncertainty for a 30-second trade."
A tool that only ever produces CALL and PUT is a tool that will happily send you into chop. On a 30-second expiry the difference between a trend and the end of one is a couple of candles, so an explicit no-trade answer is the most valuable output on the panel. It is also the one most people will ignore.
The Payout Maths
At the 92% payout on these OTC pairs, break-even sits at a 52.1% win rate (100 ÷ 192). That is as forgiving as fixed-time trading gets — and it is worth knowing before you take the same setup to a pair paying 78%, where break-even jumps to 56.2%. Same scanner, same signal, different arithmetic.
The Session, Honestly
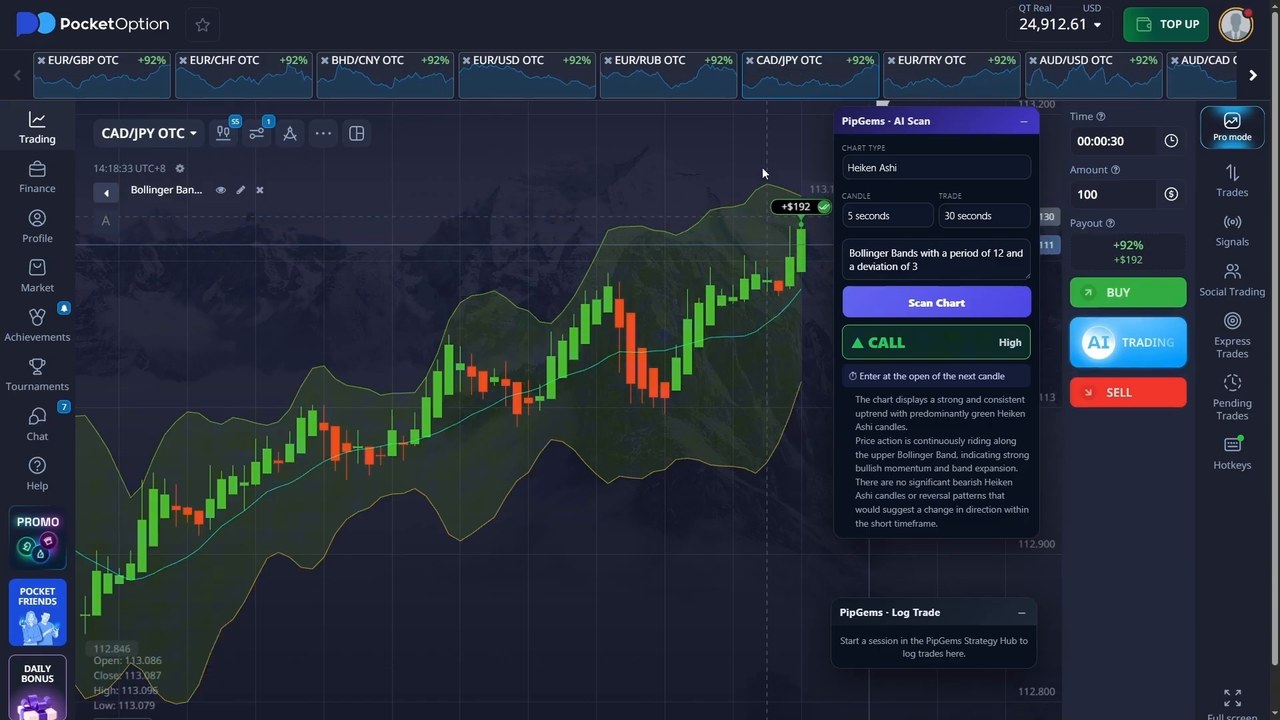
Every entry is a flat $100 at 92%, so each win returns $192 and each loss costs the stake. Across the session the balance moves from $24,376.61 to $24,912.61 — a net +$536, which at that stake and payout is 8 winning trades against 2 losing ones from ten entries.
Three things belong next to that number:
- Ten trades is not evidence. At a 52% break-even, a 10-trade sample tells you almost nothing about an edge. It shows the workflow running, no more.
- Both losses came on Medium confidence reads. Tempting to conclude "only take High" — but with this few trades that is a coincidence you would be over-fitting to. Worth logging over a hundred scans; not worth turning into a rule today.
- These are OTC pairs. Weekend OTC pricing is generated by the broker, so nothing here transfers automatically to live-market pairs.
Watch the Full Setup and Session
Installing the extension, syncing the account, setting the chart and the indicator, and every scan and entry:
Honest Weaknesses
- It is entirely manual. Nothing scans in the background — you pick a pair, press Scan, read, decide, then repeat on the next pair. The session hops across eight OTC pairs doing exactly this. For 30-second trades that is a lot of clicking, and a slow reader will miss the entry the scan was describing.
- Each scan is a snapshot. It reads the chart as it looks right now. Scan the same pair ten seconds later and you can get a different verdict — which is honest behaviour, but it means the tool is a second opinion, not a system you can follow mechanically.
- Confidence labels are unproven. "Medium" and "High" come with no published hit rate behind them. Treat them as the model's own hedging, not as a measured probability.
- It costs money and needs the browser open. Pro subscription, extension running, tab alive. Close the browser and you are back to reading the chart yourself.
- Stacking is a risk you add, not one the tool manages. The session at one point holds several $100 tickets on the same pair simultaneously. They happened to land; the scanner has no concept of your total exposure, so position sizing stays entirely your job.
- Free-text context can be wrong. Tell it "Bollinger Bands 12, 3" while a different indicator is on the chart and it will still answer confidently. Garbage in, confident garbage out.
Risk Management Rules
- Flat stake, fixed before the session — never raised to chase a loss back.
- Limit the number of trades per day and stop at a preset loss limit, without exception.
- One open ticket at a time per pair until you have logged enough sessions to know your own numbers.
- Honour the WAIT verdicts. Skipping them is the fastest way to turn this into a coin flip.
- Run it on a demo account first, and keep your own trade log — the scanner does not track your results for you.
The Verdict
3.5 out of 5. What it does well is real: the setup takes about two minutes, the reasoning is written out instead of hidden behind an arrow, and the WAIT verdict genuinely keeps you out of the chop that eats 30-second traders. As a way to slow yourself down and get a structured read before clicking, it earns its place.
What holds it back is that it is a manual, snapshot-based opinion wearing the clothes of a signal service. It does not watch the market, does not know your exposure, does not track whether its own confidence labels mean anything, and needs a paid plan plus an open browser to say anything at all. Useful assistant, not an edge — and the ten-trade session in the video should be read as a demonstration, not a result.
#PipGems #AIChartScanner #PocketOption #BollingerBands #HeikenAshi #30SecondTrades #BinaryOptions #TradingTools #OTCTrading
Frequently Asked Questions
What settings does this PipGems AI Chart Scanner setup use?
Heiken Ashi chart type on 5-second candles with a 30-second trade duration, Bollinger Bands set to period 12 and deviation 3, and a flat $100 stake on Pocket Option OTC pairs paying 92%.
How does the AI Chart Scanner decide on a signal?
It reads the chart you are looking at and combines three things: runs of same-colour Heiken Ashi candles as momentum, price position relative to the middle and outer Bollinger Bands as trend or exhaustion, and wick behaviour as strength or building pressure. It returns CALL, PUT or WAIT with a confidence label and a written explanation.
What does the WAIT verdict mean?
WAIT means the scanner sees conflicting evidence - for example a clean downtrend but with long lower wicks suggesting buying pressure - and considers the next 30 seconds too uncertain to trade. On short expiries it is the most useful output the tool produces.
What win rate does a 92% payout need to break even?
About 52.1%, calculated as 100 divided by 192. On a pair paying 78% the same setup would need roughly 56.2%, so the payout on the pair changes the maths before the strategy does.
What was the result of the session in the video?
Ten entries at a flat $100 stake moved the balance from $24,376.61 to $24,912.61, a net gain of $536 - eight winning trades and two losing ones. Ten trades on OTC pairs demonstrates the workflow and is far too small a sample to prove an edge.
This content is for educational purposes only. Trading involves risk. Past results do not guarantee future outcomes. Always practice responsible money management and only trade money you can afford to lose.
Want the same scanner without a desktop? See the floating overlay on Pocket Option mobile, or the Signal Companion extension overview. Prefer indicators that make their own decisions? The ADX + Bollinger Bands setup needs no subscription at all.