Two Indicators, Two Different Jobs
Most two-indicator setups fail because both indicators are answering the same question. This one does not. Bollinger Bands answer where price is sitting inside its recent range. ADX answers whether the move has any strength behind it. Location and strength are independent, and that is exactly why the pair is worth running together.
The whole method comes down to one sentence: a stall at the outer band with a flat strength line is a reversal read; a band edge with a rising strength line is not a ceiling at all — it is a trend. Get that distinction wrong and the outer band becomes the most expensive line on your chart.
Both indicators come built into the Quotex platform. Nothing to download, nothing to install, no MT4 bridge and no robot.
The Setup
- Platform: Quotex (fixed-time trades, OTC pairs)
- Chart: candlesticks, 15-second timeframe
- Trade duration: 1 minute (four candles per trade)
- Bollinger Bands: period 13, deviation 3
- ADX: smoothing 10, DI length 11 (moved to 12 / 13 later in the session)
- Stake: flat $50 per entry — the size never changes
- Pairs traded: AUD/CAD, AUD/CHF, AUD/JPY and EUR/USD OTC at 87–91% payouts
Why Deviation 3 and Not the Default 2
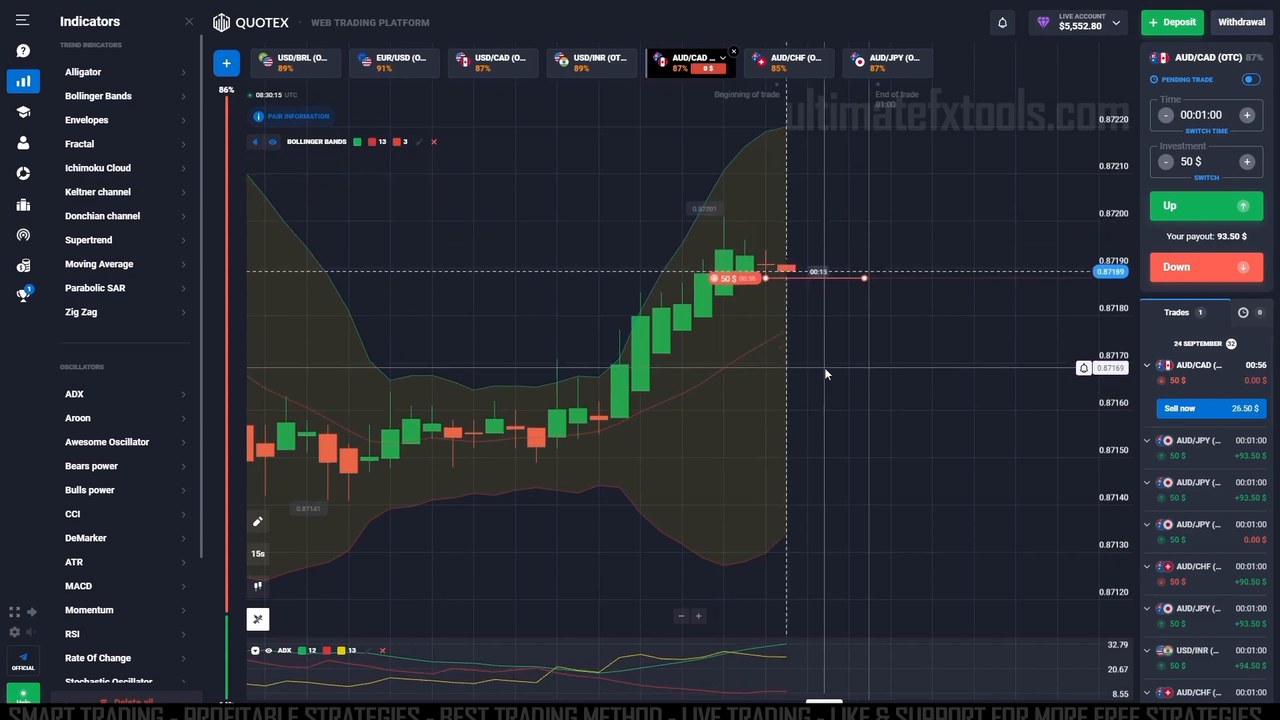
This is the setting people change first and regret. On the standard deviation 2, price tags the outer band constantly — a touch carries almost no information, and on 15-second candles you would be handed a "signal" every minute or two. Pushing deviation to 3 widens the envelope so that reaching the outer band becomes genuinely rare. Fewer touches, but each one means price has actually stretched away from its own average rather than simply drifting.
Period 13 instead of 20 pulls the middle line closer to recent price, which matters when four candles make up an entire trade. Shorter memory, wider walls: the combination is deliberate, not arbitrary.
The ADX Settings — and Why They Moved Mid-Session
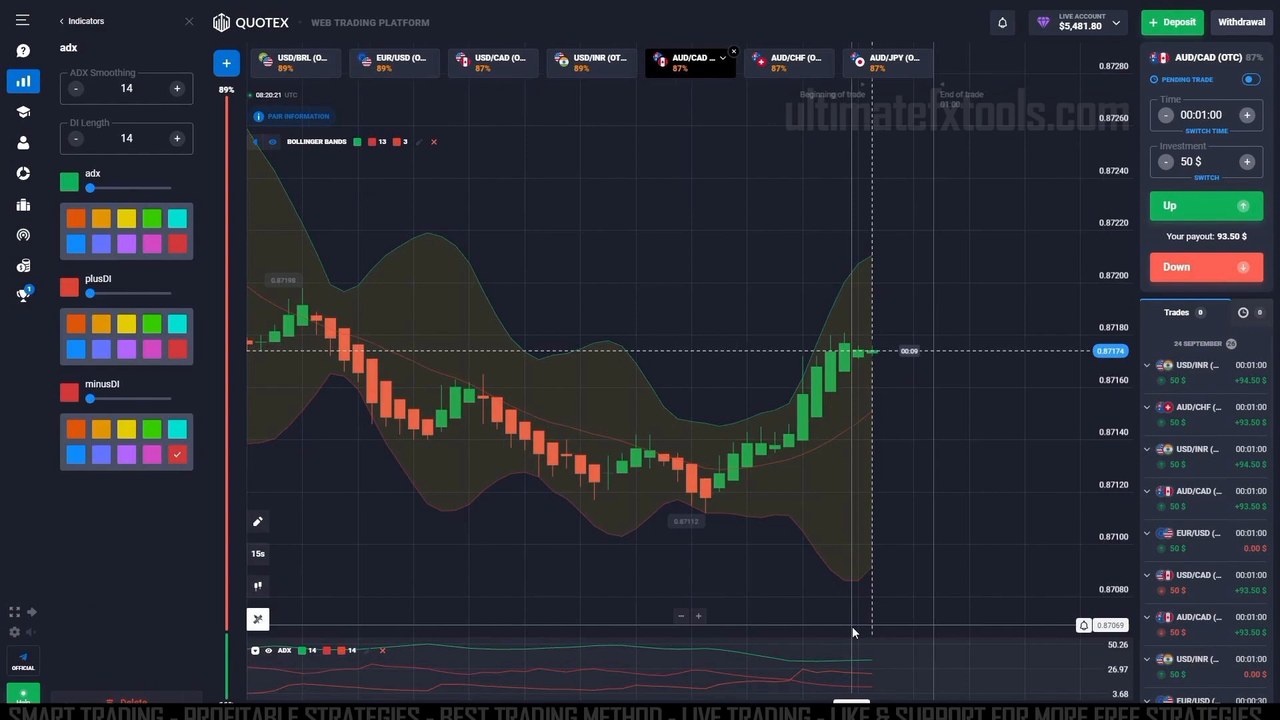
The session opens with ADX on its default 14 / 14, runs most of the trades on smoothing 10, DI length 11, and finishes on 12 / 13. That is worth being honest about rather than presenting one perfect number:
- Lower values (10 / 11) react sooner. On a 15-second chart that is the point — a strength line that confirms three candles late is useless when the trade only lasts four.
- Higher values (12 / 13, or the default 14) smooth the line and cut the false flickers, at the cost of confirming later.
- Pick one and keep it for a whole session. Changing settings after a losing trade is how a method turns into guesswork. Test the change on a demo account, not mid-run.
Reading the Two Together
Four combinations cover almost everything the chart will show you:
- Outer band + flat or falling ADX → the reversal read. Price has stretched, but nothing is driving it. This is the setup the method is actually built for: a stall at the band, then an entry back toward the middle line.
- Outer band + rising ADX → stand aside. The band is not resistance here; it is the shape a trend makes. This is where the method gets caught, and it is the single most important filter on the page.
- Middle band + rising ADX → continuation. Price pulling back to the middle line while strength holds is the trend catching its breath, not turning.
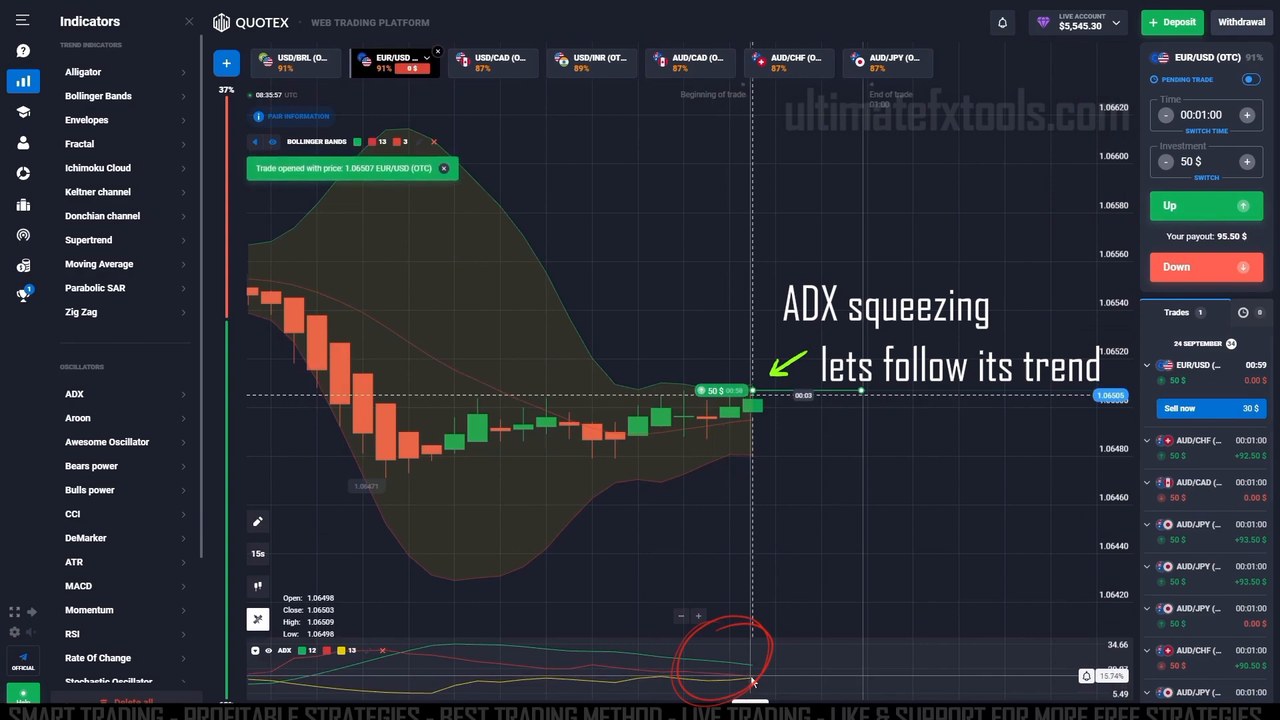
- ADX compressing while price grinds → follow the direction the bands are leaning. The session marks this on screen directly — a squeezing strength line ahead of a move, taken as a call in the direction the bands already point.
The Trap That Costs Money
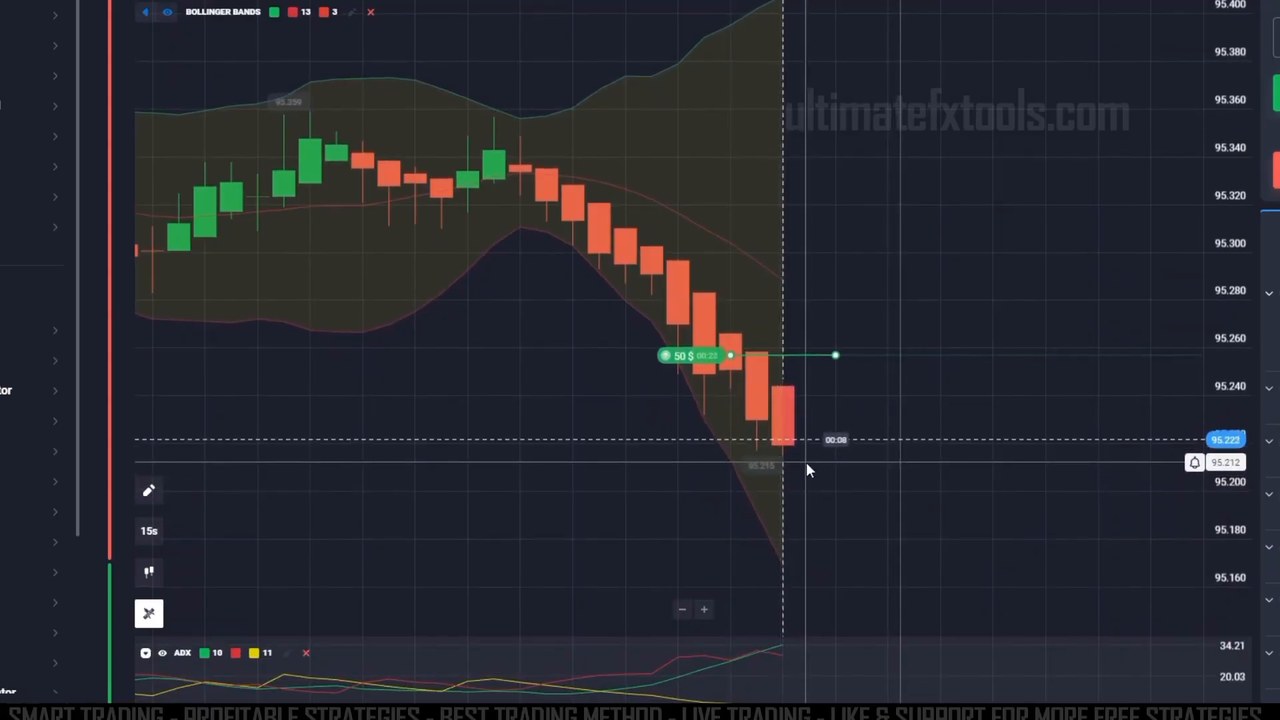
Look at that sequence. Price is pinned to the lower band, candle after candle. Every one of those touches looks like an oversold reversal, and every one of them would have been a losing call. Nothing about the band tells you which version you are in — only the strength line does.
This is why the ADX pane sits under the chart rather than being skipped as clutter. The band tells you price is stretched. ADX tells you whether being stretched matters. A trend can stay stretched far longer than a 1-minute expiry can wait.
Execution Rules
- Enter at the open of the next candle after the condition is met — not halfway through a candle that is still forming.
- 1-minute expiry on 15-second candles, so every trade resolves in four candles. Consistent expiry means comparable results.
- Flat $50 on every entry. No increasing the stake after a loss, no pressing after a win.
- Take the pair with the better payout when two charts show the same picture — 91% and 87% are not the same trade.
- When the band and the strength line disagree, skip it. A skipped setup costs nothing.
The Payout Maths Behind Your Break-Even
Fixed-time trades pay less than they risk, so the win rate you need is not 50%. At the payouts traded in this session:
- 87% payout → break-even sits at roughly a 53.5% win rate
- 91% payout → roughly 52.4%
- Drop to a 70% payout pair and the same method suddenly needs 58.8% to stand still
That last line is the argument for filtering pairs by payout before you filter them by chart. The strategy did not get worse on the low-payout pair — the maths did.
The Session, Honestly
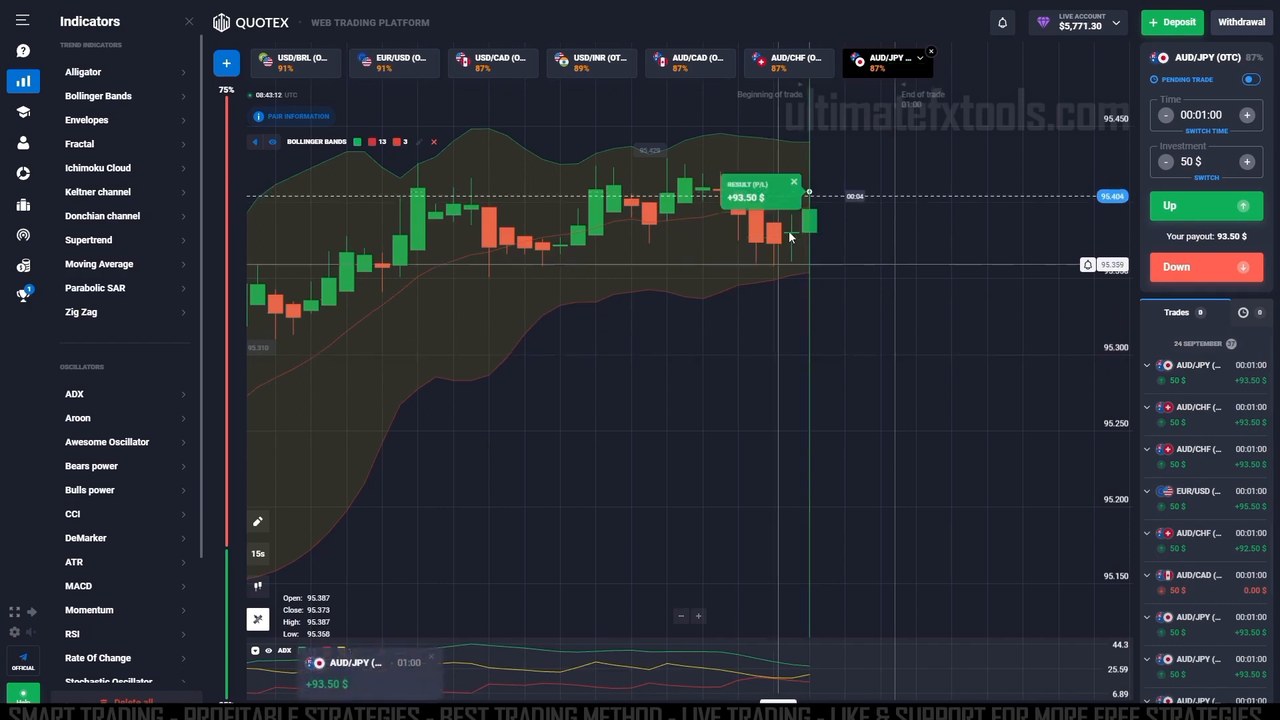
Across the stretch shown in the video there are 11 entries at a flat $50: 9 green and 2 red (an AUD/CAD put and an AUD/JPY call), moving the balance from $5,481.80 to $5,771.30. Every trade is on screen, including both losses — nothing was cut.
Three caveats belong next to that number, and they matter more than the number does:
- Eleven trades is a small sample. At an ~88% average payout the break-even line is near 53%; 9 of 11 clears it comfortably, but a single session demonstrates a method, not an edge. Fifty sessions logged in a spreadsheet is evidence — one is a story.
- These are OTC pairs. Weekend OTC pricing behaves differently from live-market pricing. Do not assume a hit rate transfers between them.
- The settings changed mid-session. The result is not a clean test of one configuration, which is precisely why the advice above is to lock the settings before the session and log the outcome.
Watch the Full Session
The indicator setup from scratch, every entry, both losses, and the settings change — all of it in one unedited run:
Honest Weaknesses
- Trends break it. The band-riding sequence above is the method's worst case, and it will happen every session. The ADX filter reduces the damage but never removes it.
- 15-second candles punish hesitation. Four candles is the whole trade. If you are still deciding when the second candle closes, you are already trading a different setup.
- Deviation 3 means waiting. Genuine touches are rare by design. Traders who cannot sit still tend to loosen the setting back toward 2, and the signal quality goes with it.
- ADX has no fixed threshold here. The read is directional — rising, flat, compressing — not "above 25". That takes screen time to judge, which is exactly what a demo account is for.
Risk Management Rules
- Flat stake, decided before the session starts. Never raise it to recover a loss.
- Limit the number of trades per day and stop at a fixed loss limit, honoured without exception.
- Favour pairs paying 85%+ so the break-even maths stays in reach.
- Lock the indicator settings for the whole session and log the result before changing anything.
- Run at least a week on a demo account before a cent of real money touches this.
The Verdict
A solid 4.5 out of 5. What earns it: two indicators that answer genuinely different questions instead of confirming each other, both free inside Quotex; a setting choice (deviation 3) that trades signal frequency for signal quality on purpose; and an explicit rule for the situation that ruins most band strategies — the trending band ride — rather than pretending it does not happen.
The missing half star is the discretion involved. "Rising, flat or compressing" is a judgement call, not a line crossing a number, so two traders can look at the same ADX pane and take different trades. That is workable with screen time, but it means the method cannot be handed over as a checklist and expected to produce identical results. Learn the four combinations above, hold your settings still, and let the log tell you whether it works for you.
#Quotex #ADX #BollingerBands #BinaryOptions #TradingStrategy #15SecondCandles #FreeIndicators #OTCTrading #FixedTimeTrades
Frequently Asked Questions
What indicator settings does this Quotex strategy use?
Bollinger Bands with period 13 and deviation 3, plus ADX with smoothing 10 and DI length 11 (moved to 12 / 13 later in the session). The chart runs 15-second candles with a 1-minute trade duration and a flat $50 stake.
Why use Bollinger deviation 3 instead of the default 2?
On deviation 2 price tags the outer band constantly, so a touch carries little information - especially on 15-second candles. Deviation 3 widens the envelope so reaching the outer band is rare and means price has genuinely stretched away from its average.
How do Bollinger Bands and ADX work together?
Bollinger Bands show where price sits in its range and ADX shows whether the move has strength behind it. A stall at the outer band with a flat ADX is a reversal read, while a band edge with a rising ADX is a trend and should be skipped.
What win rate does this strategy need to break even?
It depends on the payout. At an 87% payout break-even is about a 53.5% win rate, at 91% about 52.4%, and at a 70% payout it rises to roughly 58.8%. Filtering for higher-payout pairs lowers the win rate you need.
What was the result of the session in the video?
Eleven entries at a flat $50 stake produced 9 winning and 2 losing trades, with the balance moving from $5,481.80 to $5,771.30. Eleven trades is a small sample on OTC pairs and demonstrates the method rather than proving a long-term win rate.
This content is for educational purposes only. Trading involves risk. Past results do not guarantee future outcomes. Always practice responsible money management and only trade money you can afford to lose.
Prefer a slower version of the same idea? The RSI + Bollinger Bands 1-minute setup uses the same bands with a different filter. For another two-indicator build, see SuperTrend + Keltner Channel, or browse every setup on the strategies hub. If you would rather have the scanning done for you, PipGems runs this class of read across pairs automatically.