Two Moving Averages That Are Not the Same Kind
Most moving-average setups pair two of the same type — EMA 5 against EMA 20, say — and the only difference between the lines is how many candles each one looks at. This Quotex setup does something less common: it pairs two different kinds of average, so the lines disagree for reasons other than length.
- EMA 17 (green) — an exponential moving average weights the most recent candles most heavily, so it turns quickly when price turns.
- TMA 12 (orange) — a triangular moving average is a smoothed average of an average. It weights the middle of its window most and the newest candle least, which makes it unusually smooth and unusually slow.
That is the whole idea. The EMA reacts, the TMA refuses to. When a short-lived spike happens the EMA bends and the TMA does not, and the gap between them is what you are reading.
Note the periods are almost the same — 12 and 17 — which would normally make two lines of the same type nearly identical. Here they behave very differently anyway, and that difference comes entirely from the maths, not the lookback.
The exact settings from the video
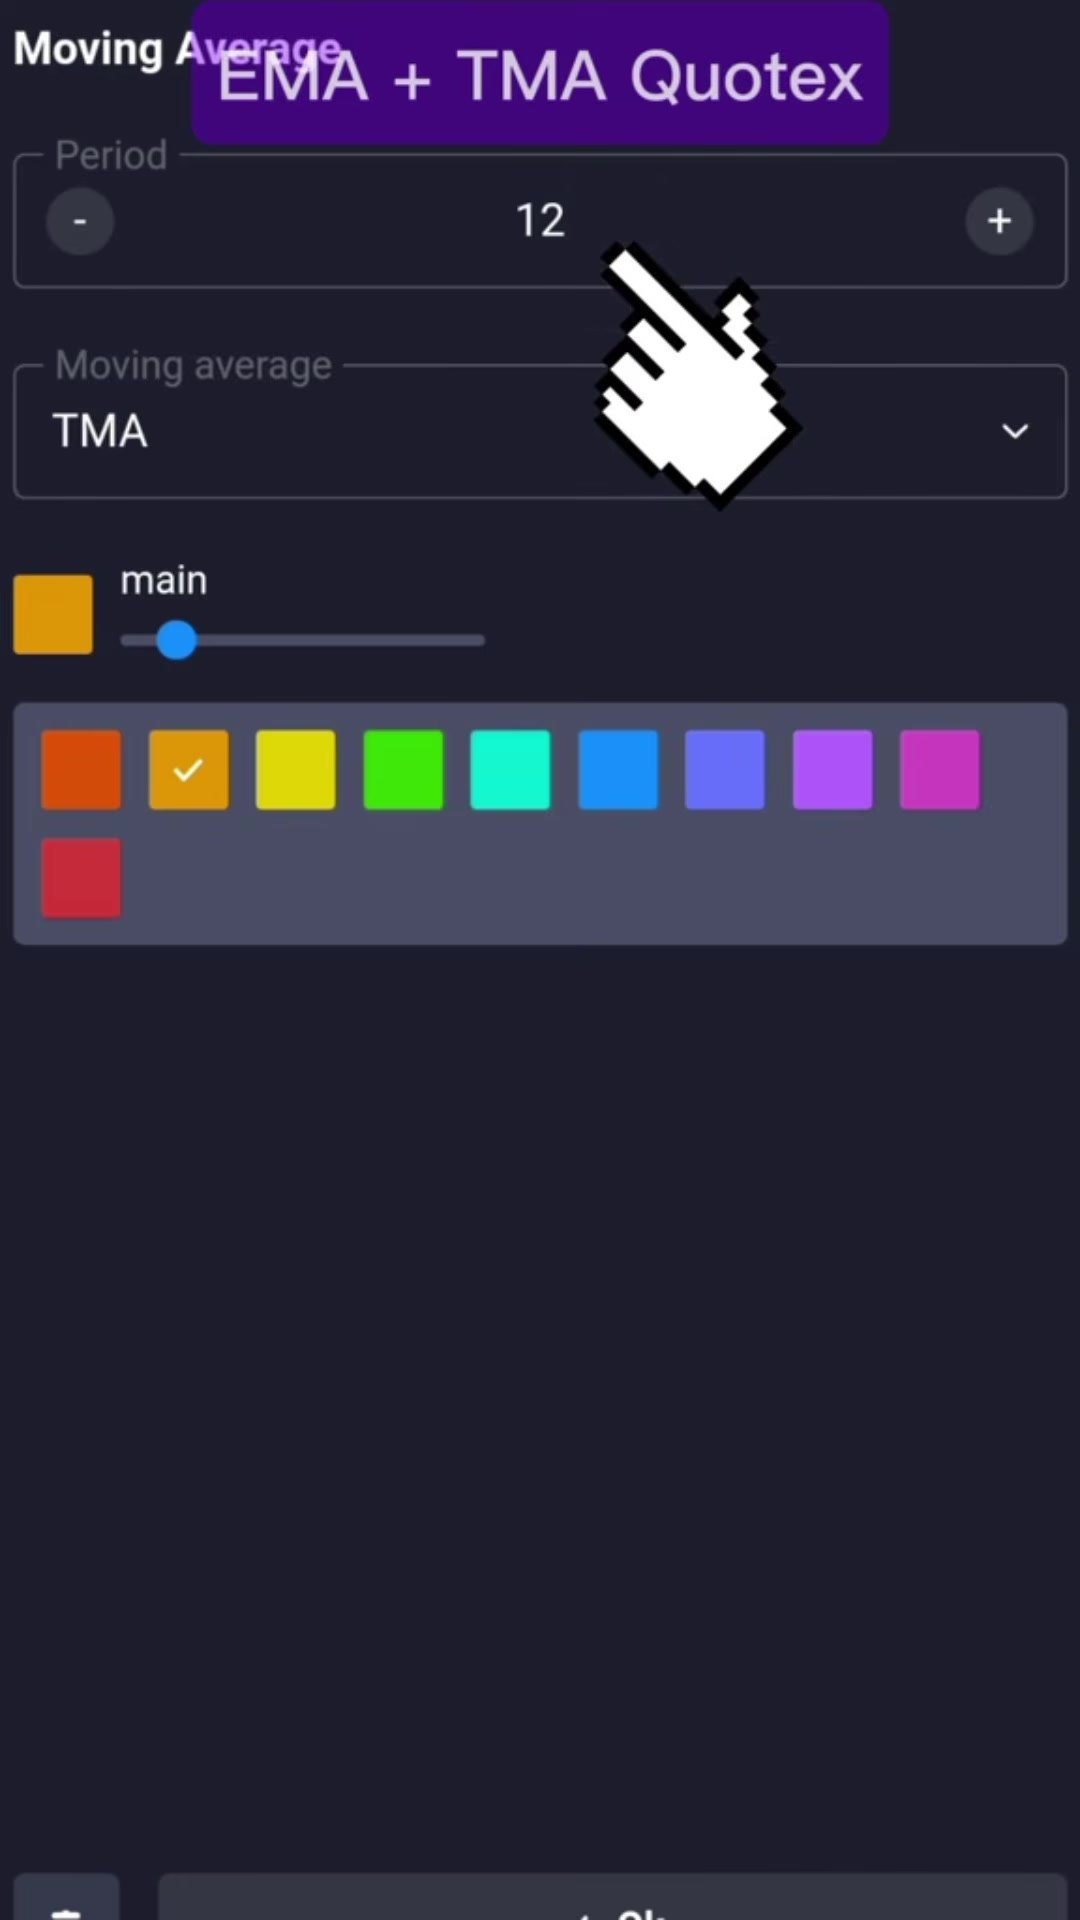
Both lines are added from the same Quotex indicator — add Moving Average twice and change the type in the dropdown:
- Moving Average 1: type TMA, period 12 (orange)
- Moving Average 2: type EMA, period 17 (green)
- Pair: EUR/JPY at an 82% payout
- Trade duration: 1 minute
- Stake: $50, returning $91.00 on a win
The Trade the Video Shows
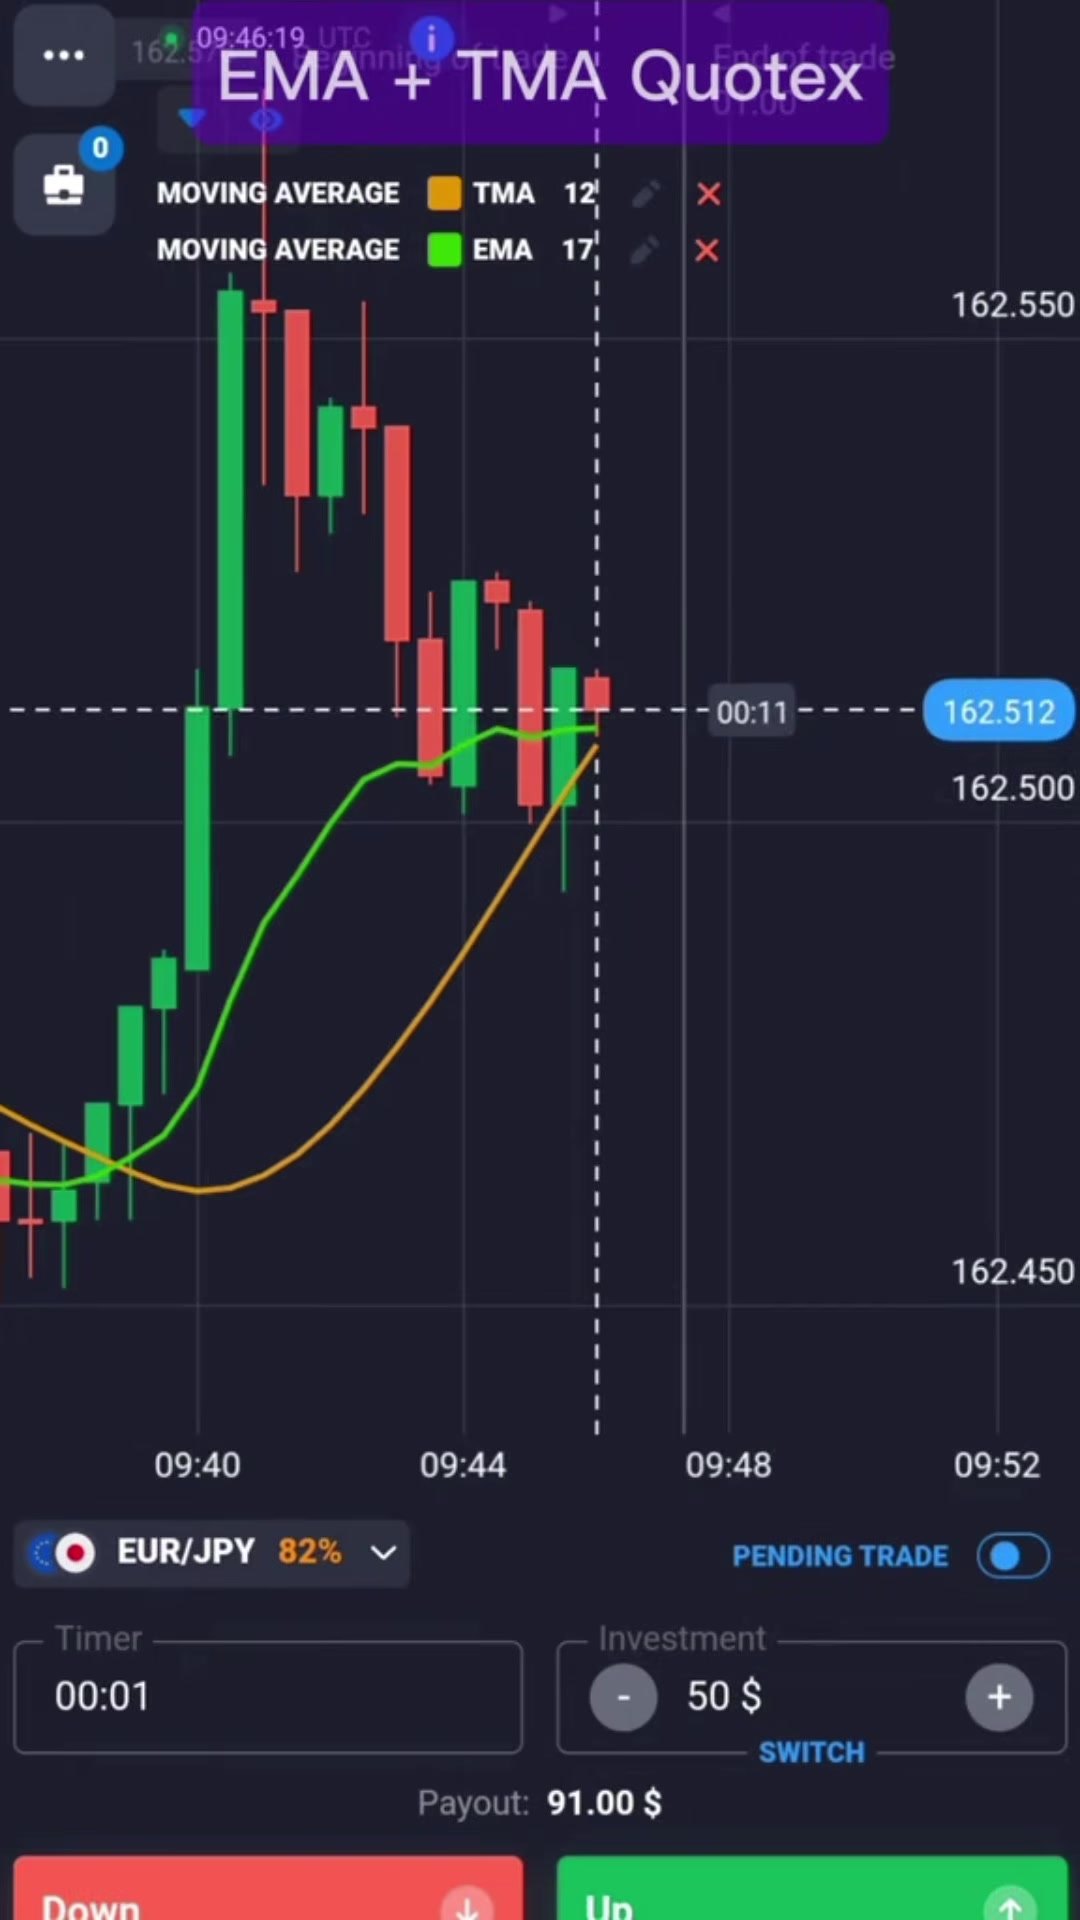
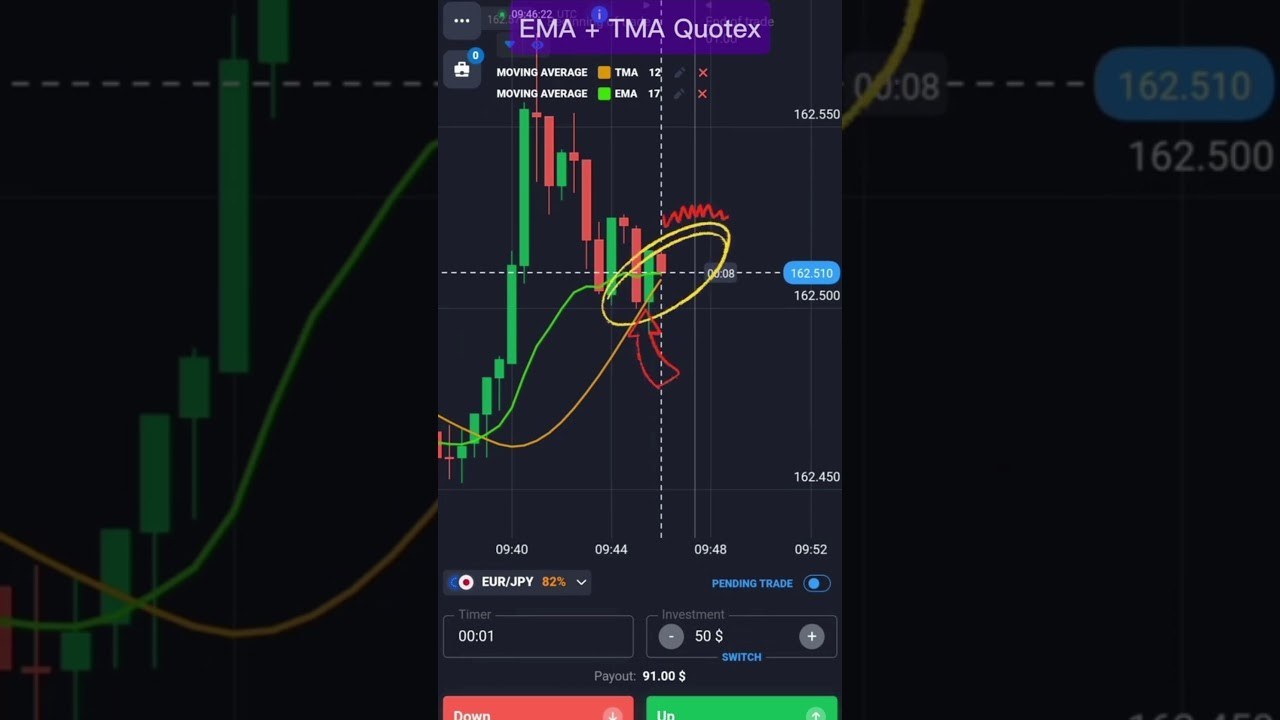
EUR/JPY had run up sharply and then rolled over, printing red candle after red candle from about 09:41. By 09:46 price had drifted back up into the two moving averages, which had converged — the slow orange TMA climbing to meet the flat green EMA.
That is the moment the video circles: price pulling back into the two lines during a move that is already going the other way. The entry taken is DOWN, at 162.510, with a one-minute expiry.
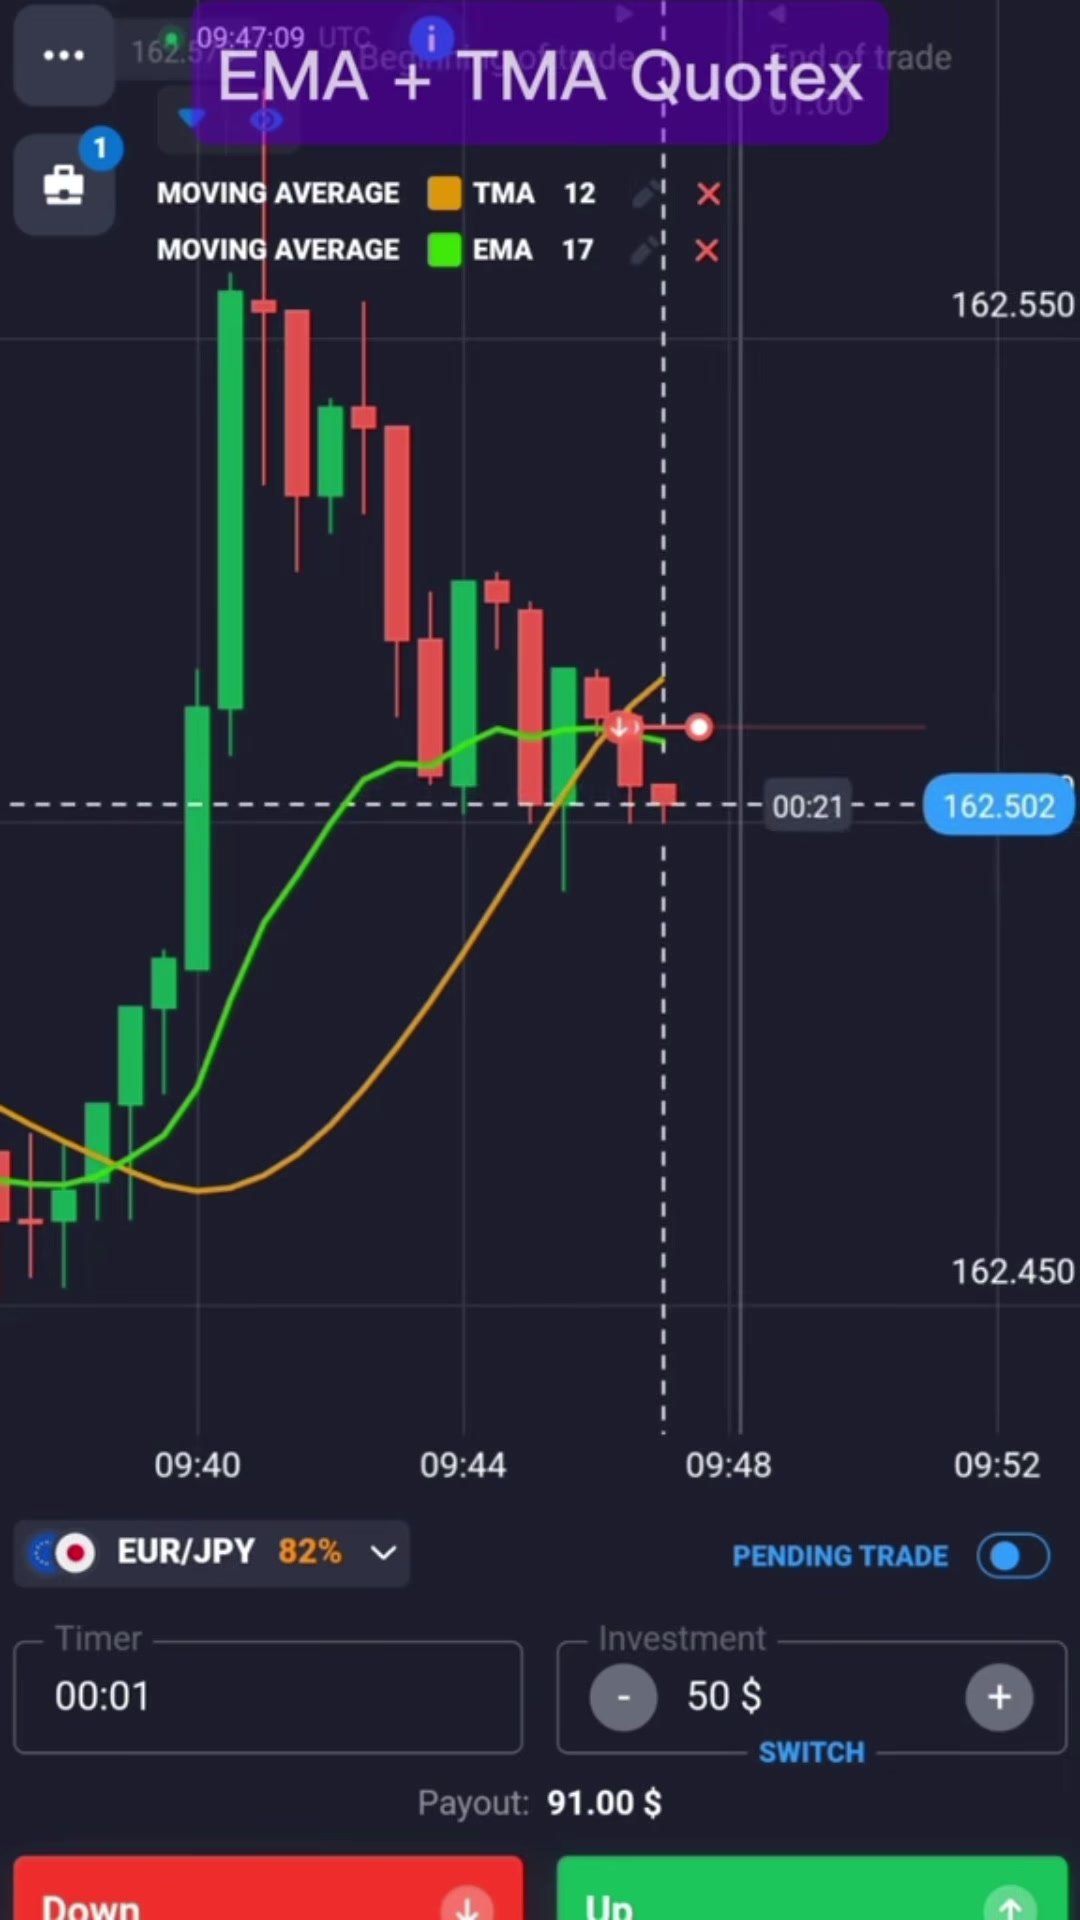
Twenty-one seconds later price is at 162.502 — eight points below the entry, so the position is in profit with the clock running down. The clip ends around the expiry without a settled result on screen, so we are not going to tell you it won.
The logic is a pullback trade rather than a crossover trade, which is worth being clear about because those two ideas often get confused. You are not waiting for the lines to cross and then following them. You are waiting for price to come back to the lines against the prevailing move, and betting the prevailing move resumes.
Watch the setup
Forty-five seconds, from adding the indicators to placing the trade:
The 82% Payout Changes the Maths
This is worth doing before you trade the setup, because the payout here is meaningfully worse than the ones you usually see quoted. At 82%, a winning $50 trade returns $41 profit while a losing one costs the full $50. Break-even is:
100 ÷ 182 = 54.95% of trades must win.
Compare that with a 92% payout pair, where break-even is 52.08%. Those three percentage points are not a rounding error — over a few hundred trades they are the difference between a method that pays and one that quietly does not. Check the payout on the pair before you decide the setup is working.
Honest Weaknesses
- The TMA lags badly, and that is by design. A double-smoothed average is always late. On a one-minute expiry, a line that is several candles behind price is describing history, not the next sixty seconds.
- A pullback into the lines is not proof the trend resumes. The same picture appears at the start of every genuine reversal. Nothing in the two lines tells you which one you are looking at.
- The 82% payout is a real handicap. Needing almost 55% correct is a high bar for a one-minute call on a currency pair.
- The clip is 45 seconds long and shows one trade. One entry proves the setup exists; it says nothing about how it performs over a session, and we will not pretend otherwise.
- Both lines read the same closing prices. They are not independent confirmations of each other — when price chops sideways they will agree, and both be wrong.
Risk Management Rules
- Flat stake, decided before the session, and never increased to win a loss back.
- Cap the number of trades you will take in a day and stop when you reach it.
- Work out the break-even win rate for the payout you are offered, and judge your session against that number rather than against a feeling.
- Skip the setup when price is not in a clear prior move — a pullback trade needs something to pull back from.
- Do not take a second entry on the same pair immediately after a loss on it.
- Run it on a demo account long enough to see how often the pullback keeps going instead of turning.
The Verdict
4 out of 5. What earns it: the pairing is genuinely thoughtful rather than two versions of the same line, both indicators are free inside Quotex with nothing to install, the settings are unambiguous, and the setup itself — a pullback into a moving-average cluster during an established move — is a sound piece of chart reading that works far beyond binary options.
What holds it back is the format rather than the method. Forty-five seconds is enough to show a setup and not enough to teach a rule you could follow on your own: how far the pullback should go, what counts as rejection, when to stand aside. That is the difference between this and a full tutorial, and it is why the honest weaknesses section above is longer than usual.
For a slower version of the same moving-average idea with two EMAs, see our 2 EMA Quotex strategy. If you would rather have a TMA read marked on a MetaTrader chart with alerts, that is what the TMA + ZigZag indicator does, and it ships in the lifetime library.
Frequently Asked Questions
What are the exact indicator settings?
Two Moving Average indicators on the same Quotex chart. The first is set to type TMA with a period of 12, shown in orange. The second is set to type EMA with a period of 17, shown in green. Both are added from the standard Moving Average indicator by changing the type in its dropdown.
What is the difference between a TMA and an EMA?
An EMA weights the newest candles most heavily, so it turns quickly when price turns. A TMA is a triangular moving average, effectively a smoothed average of an average, which weights the middle of its window most and the newest candle least. That makes it far smoother and considerably slower than an EMA of a similar period.
What is the entry shown in the video?
EUR/JPY had been falling for several minutes, then drifted back up into the two converged moving averages. A DOWN trade was taken at 162.510 with a one-minute expiry and a $50 stake. It is a pullback entry in the direction of the prior move, not a crossover entry.
What win rate does an 82% payout need to break even?
About 54.95%, calculated as 100 divided by 182. A winning $50 trade returns $41 while a loser costs $50. For comparison, a 92% payout only needs 52.08%, so the pair you choose changes the maths before the strategy does.
Is this setup enough to trade on its own?
No. The clip is 45 seconds long and shows a single entry, which demonstrates the setup rather than teaching a complete rule set. Treat it as a chart-reading idea to test on a demo account, and decide your own rules for how deep a pullback qualifies and when to stand aside.
Watch the session
This content is for educational purposes only and is not financial advice. Trading involves risk. Past results do not guarantee future outcomes. Always practice responsible money management, limit your daily trades, and trade only what you can afford to lose.