Two Indicators, One Question Each
Most mobile setups fail for the same reason: too many indicators on a screen the size of your hand. This one runs on two, and each answers a different question.
- Bollinger Bands (20, 2) — has price gone too far? The bands are a moving average with a channel two standard deviations wide. Price spends most of its time inside them, so a candle closing at or beyond a band is the signal that a move has stretched.
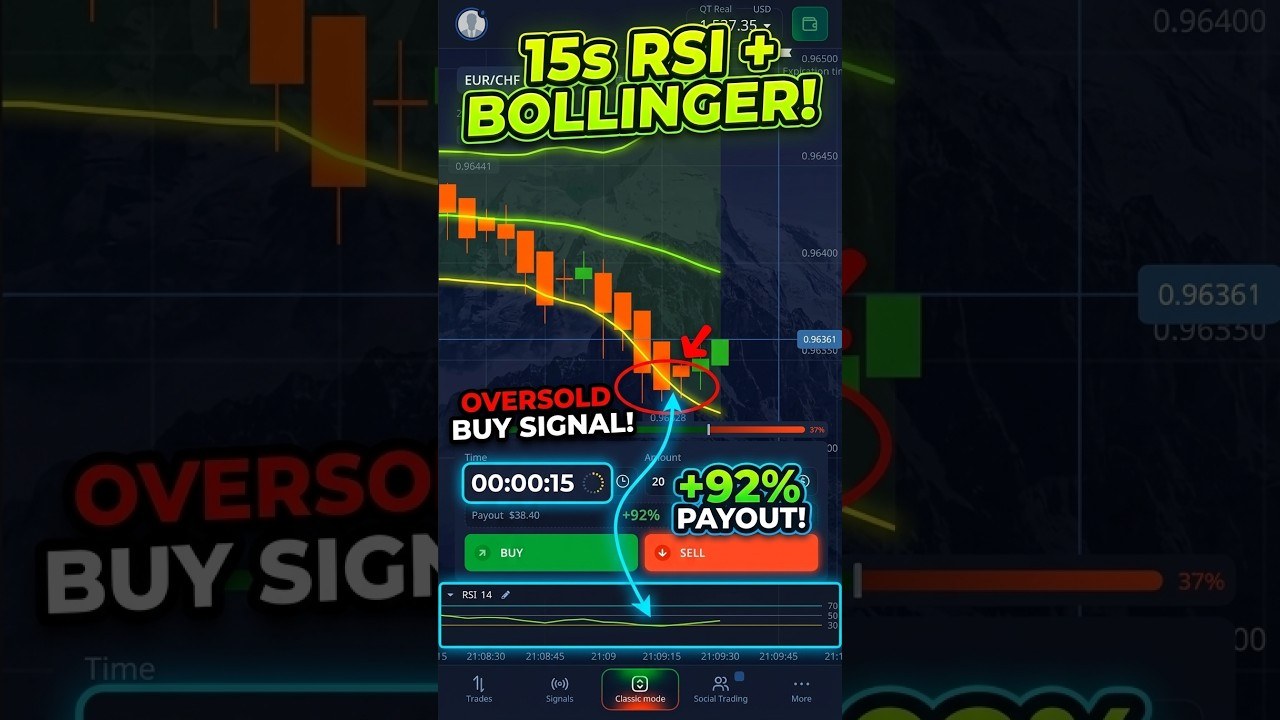
- RSI 14 — is the stretch running out of strength? Not as an overbought or oversold alarm, but as a direction check: RSI turning back from its extreme is what separates a genuine rejection from price simply riding the band.
Both are built into the Pocket Option app. Nothing to install, nothing to buy, and the whole thing runs on the phone.
The exact settings from the video
- Bollinger Bands: period 20, deviation 2
- RSI: period 14
- Chart timeframe: 5 seconds
- Trade duration: 15 seconds
- Pairs traded: AUD/CAD OTC and USD/CAD OTC
- Stake: flat $20, payout 92%
The Sell Setup
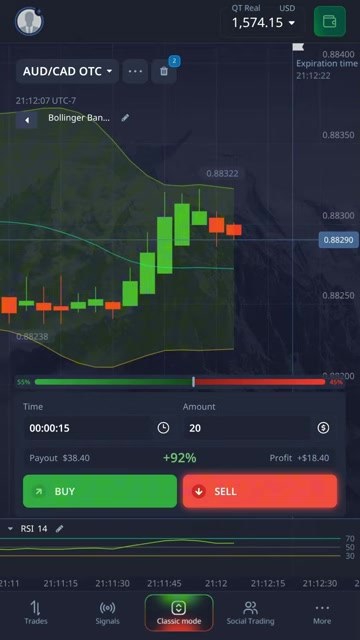
Two things have to line up before a sell:
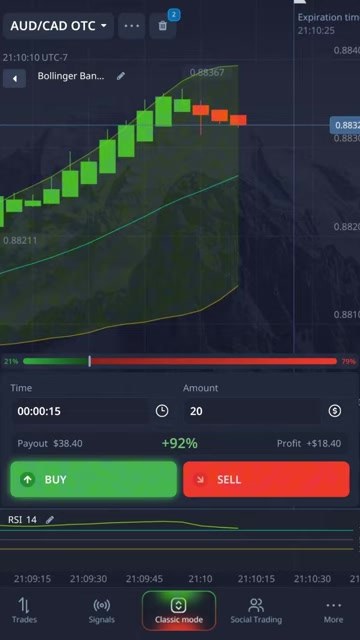
- Price pushes into or through the upper band.
- Consecutive red bars appear at the band — the rejection is visible, not assumed.
That second condition is the whole discipline of this method. A band touch on its own is worth nothing: in a strong move price will walk along the upper band for a minute at a time, and every touch would be a losing sell. Waiting for the red bars means you are trading a rejection that has already started rather than predicting one.
The Buy Setup
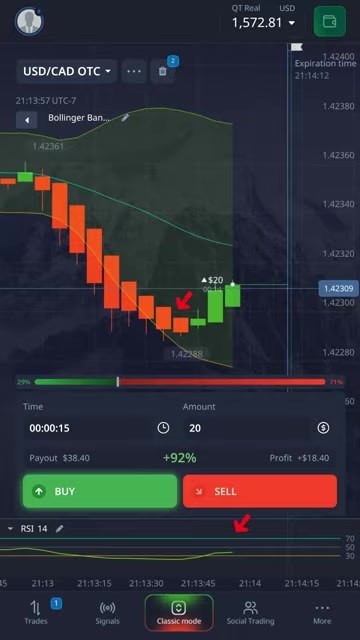
The mirror image, with RSI carrying more of the weight:
- Price reaches the lower band.
- RSI bounces up off the 30 line — the lift, not the level, is the signal.
An RSI sitting at 25 tells you the sell-off was strong. An RSI turning up from 25 tells you it is losing its grip. Only the second one is tradeable, and confusing the two is the most common way traders lose money with RSI.
The Payout Maths Nobody Shows You
This is the number that decides whether any 15-second method is worth running. At the 92% payout in the video, a winning $20 trade returns $18.40 profit and a losing one costs the full $20. To break even you need:
100 ÷ 192 = 52.08% of your trades to win.
So a strategy that wins half its trades is not breaking even — it is slowly losing. Every extra percentage point above 52.08% is the entire edge. Work that number out for the payout you are actually offered before you decide whether a session went well, because a 55% session at 92% payout is a real result and a 51% session is not.
Watch the Full Mobile Setup
The indicators added from scratch on the phone, both entry types, and the trades as they happen:
Honest Weaknesses
- Fifteen seconds is mostly noise. Over that horizon price is close to a coin flip plus the spread, and the shorter the expiry the more the payout maths works against you. This is the single biggest limitation of the method and no indicator setting fixes it.
- Mean reversion fails exactly when it feels best. Band rejection assumes price snaps back. In a strong trend it does not — it rides the band and every signal fires into the move. Trending sessions are where this setup does its damage.
- The pairs here are OTC. Weekend and off-hours OTC pricing is generated by the broker, so nothing here transfers automatically to live-market pairs.
- Both indicators read the same closing prices. Bollinger Bands and RSI feel like two independent confirmations; they are not. When they agree in a sideways drift they can be wrong together.
- A phone screen hides context. The mobile chart shows perhaps thirty candles. The higher-timeframe trend that would have told you to skip a signal is simply not on screen.
Risk Management Rules
- Flat stake, decided before the session. Never raise it to win back a loss — that is how a bad ten minutes becomes an empty account.
- Cap your trades for the day and stop when you hit it, win or lose. On 15-second expiries you can take fifty trades in an hour without noticing.
- Skip the band touch when there are no rejection bars. No rejection, no trade.
- Do not re-enter the same pair immediately after a loss on it.
- Know your break-even win rate for the payout you are being offered, and check your session against it honestly.
- Run it on a demo account until both setups are automatic.
The Verdict
5 out of 5. What earns it: the setup is genuinely minimal — two indicators, both free inside the app, both with a defined job; the entry rules are specific enough to be followed or refused without judgement calls; it runs entirely on a phone, so there is no PC, no MetaTrader and no installation between you and the chart; and the video shows a live account with the real payout on screen rather than a cropped screenshot.
What keeps it honest: the rating is for the method and the teaching, not a promise about your results. A clear, minimal, well-explained setup is still being applied over a fifteen-second horizon where the payout maths demands better than 52% just to stand still. The setup gives you a clean, repeatable thing to do. What it cannot give you is patience — and on this timeframe, patience is most of the edge.
If you want the same band-rejection logic marking itself on a MetaTrader chart with alerts instead of you watching a phone, that is what our RSI + Bollinger Alert indicator does, and it is part of the lifetime library.
Frequently Asked Questions
What indicators does this Pocket Option mobile strategy use?
Two, both built into the Pocket Option app: Bollinger Bands set to period 20 and deviation 2, which show when price has stretched away from its average, and RSI 14, which shows whether that stretch is losing strength. Nothing has to be installed and the whole setup runs on a phone.
What are the exact settings from the video?
Bollinger Bands period 20, deviation 2. RSI period 14. The chart is on 5-second candles and each trade lasts 15 seconds. The pairs traded were AUD/CAD OTC and USD/CAD OTC at a flat $20 stake with a 92% payout.
What is the sell rule?
Price has to push into or through the upper Bollinger band, and then consecutive red bars must appear at the band. The red bars are the important half: a band touch alone is not a signal, because in a strong move price will ride the upper band and every touch would be a losing sell.
What is the buy rule?
Price reaches the lower Bollinger band and RSI bounces up off the 30 line. It is the turn that matters, not the level. An RSI sitting at 25 only tells you the sell-off was strong; an RSI turning up from 25 tells you it is losing its grip.
What win rate does a 92% payout need to break even?
About 52.08%, calculated as 100 divided by 192. A winning $20 trade returns $18.40 while a losing one costs the full $20, so a strategy winning half its trades is slowly losing money rather than breaking even. Work the number out for whatever payout you are actually offered before judging a session.
Does this work on live pairs or only OTC?
The session in the video is on OTC pairs, where pricing is generated by the broker during weekends and off-hours. That behaviour does not automatically transfer to live-market pairs, so treat the two as separate questions and test on demo before assuming either behaves like the other.
Watch the session
This content is for educational purposes only and is not financial advice. Trading involves risk. Past results do not guarantee future outcomes. Always practice responsible money management, limit your daily trades, and trade only what you can afford to lose.