An AI Read of a Bare Chart
Most scanner sessions on this channel stack indicators on the chart first. This one does not. The Pocket Option chart shows nothing but 5-second candlesticks, and the PipGems AI Chart Scanner is asked one question about a screenshot of it: CALL or PUT for the next minute?
The video is short and has no voiceover, so everything below is read off the screen. That includes the scanner’s settings, its prediction and confidence for each scan, the short “Key Observations” it writes under each result, and every trade in the Pocket Option history panel. The stake is a flat $30 on OTC pairs paying 92%, so a win adds +$27.60 and a loss costs $30.
The Scanner Settings
The configuration panel is opened on camera. It has four fields, and only three are used:
| Field | Value in the video |
|---|---|
| Chart Type | Candlestick |
| Candle Timeframe | 5 Seconds (matches the Pocket Option chart) |
| Target Trade Duration | 1 Minute (the last two trades switch to 30 seconds on the platform) |
| Notes for AI (Optional) | Left empty. The placeholder suggests listing indicators, e.g. “EMA 20, RSI 12, Bollinger Bands 12 (standard deviation 3)” |
| Trade | $30 flat, 92% payout, OTC pairs (AUD/CHF, CAD/JPY, AUD/USD, AUD/NZD, EUR/CHF, AUD/CAD) |
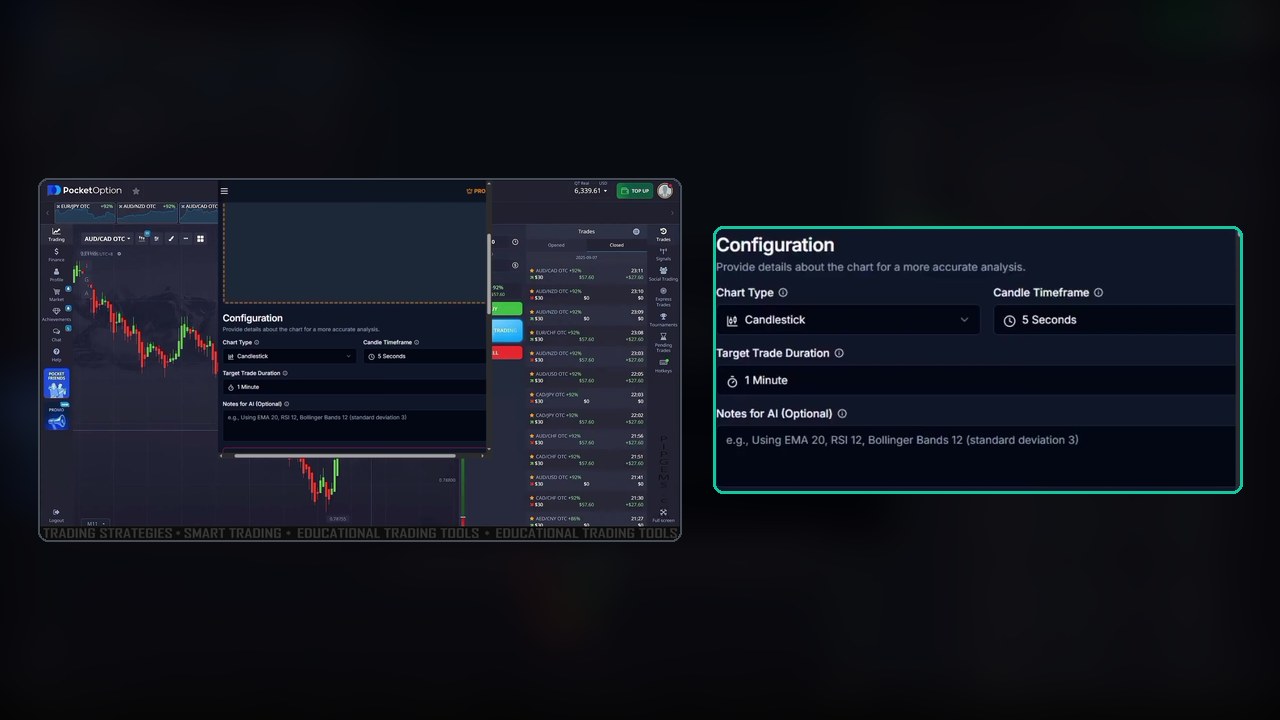
Leaving the notes box empty matters for the read. With no indicators named and none on the chart, the scanner has only the shape of the candles to work with: swings, lows, highs and the colour of the last candle. You can see that in its observations, which talk about bounces, support, resistance and runs of red or green candles.
How the Scan Works
- Set up the Pocket Option chart: candlesticks, 5-second timeframe, no indicators.
- Open pipgems.com/ai-scanner in a small browser window beside the chart and fill in the configuration above.
- Take a screenshot of the chart and drop it into the Upload Image tab. Browsers do not let a site take screenshots by itself, so the upload is how the scanner sees your chart. There is also a Camera Scan tab for photographing a screen with a phone.
- Wait a few seconds for “AI is analyzing”. The result shows a Prediction (CALL or PUT), a Confidence level, and two lines of Key Observations.
- Read the observations against the live chart, place the trade on Pocket Option, then press Scan Another Chart for the next one.
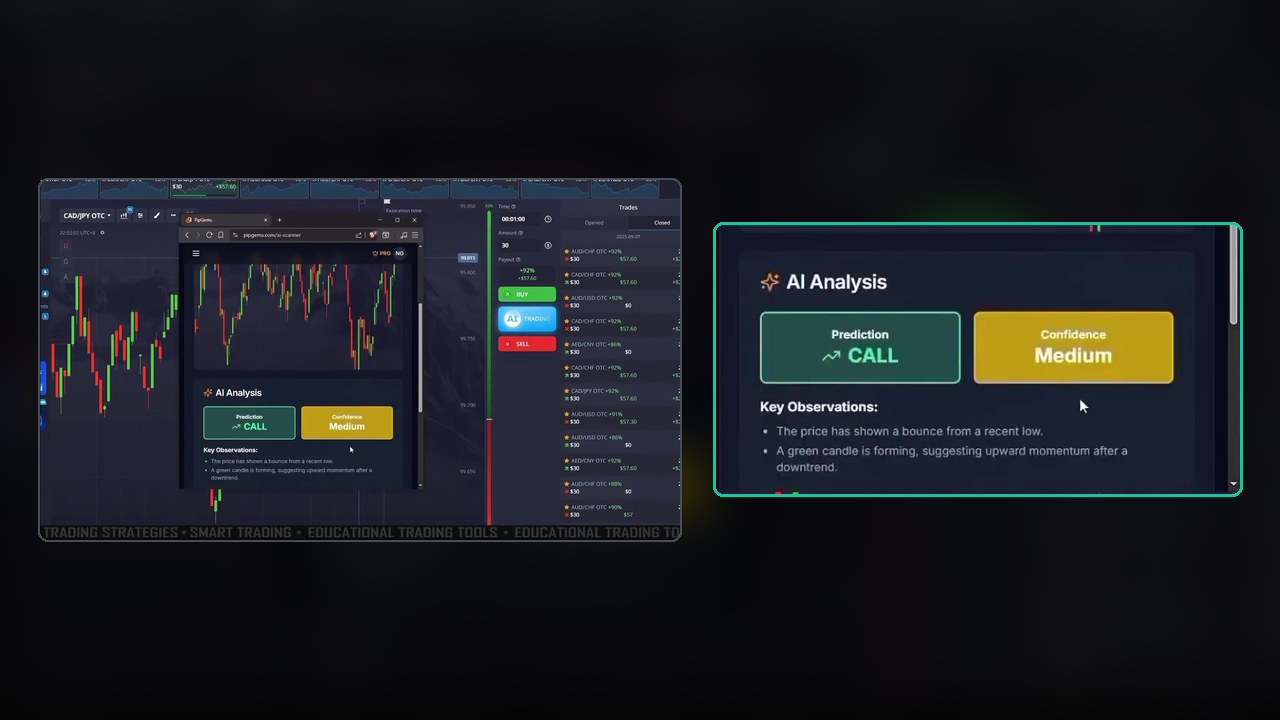
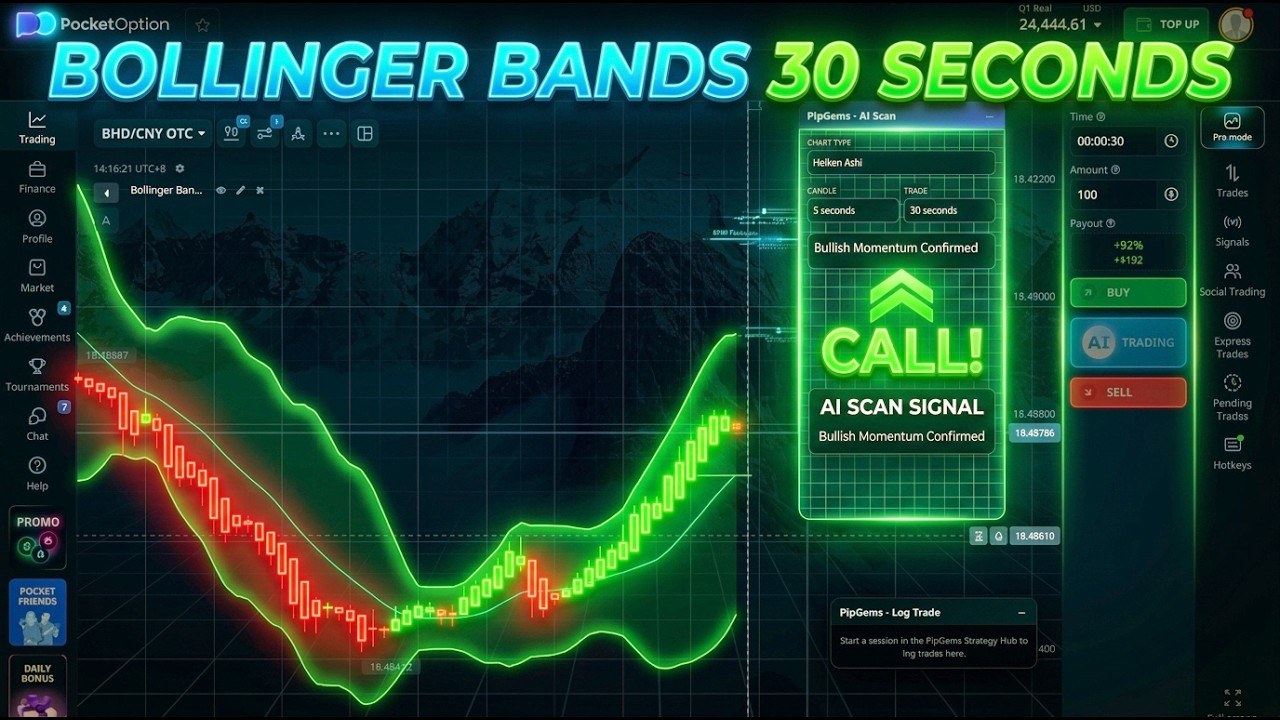
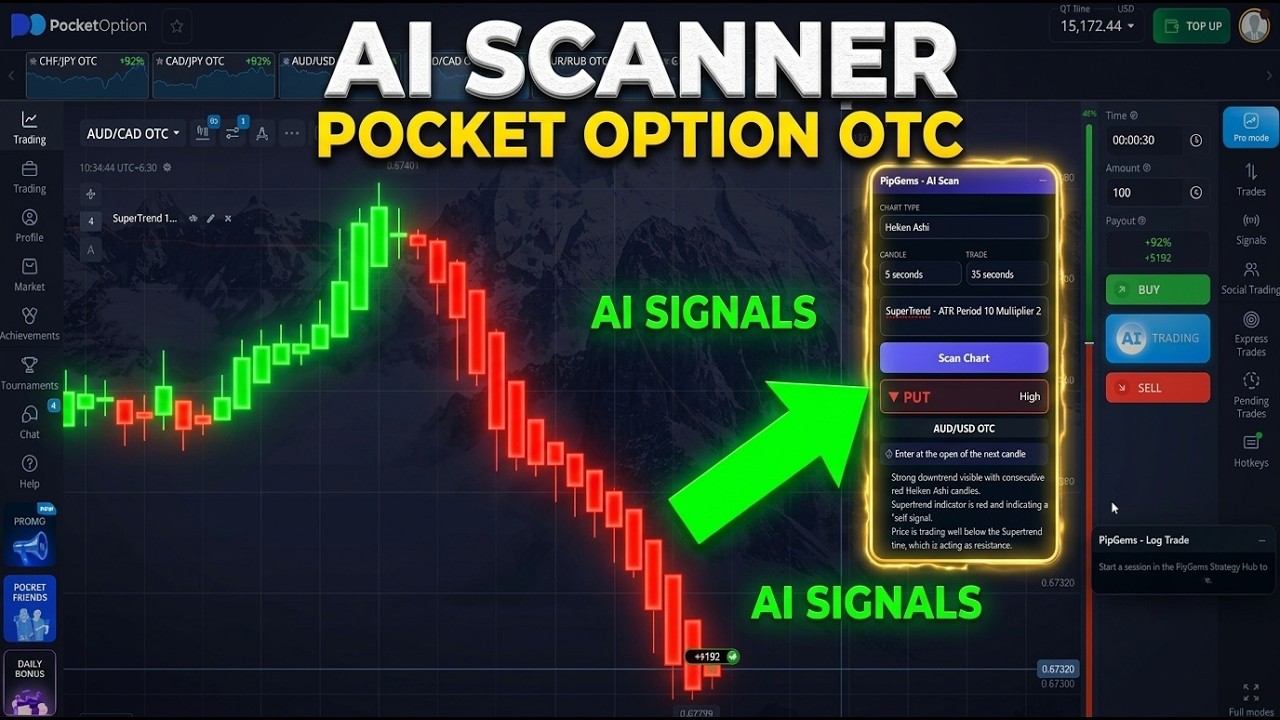
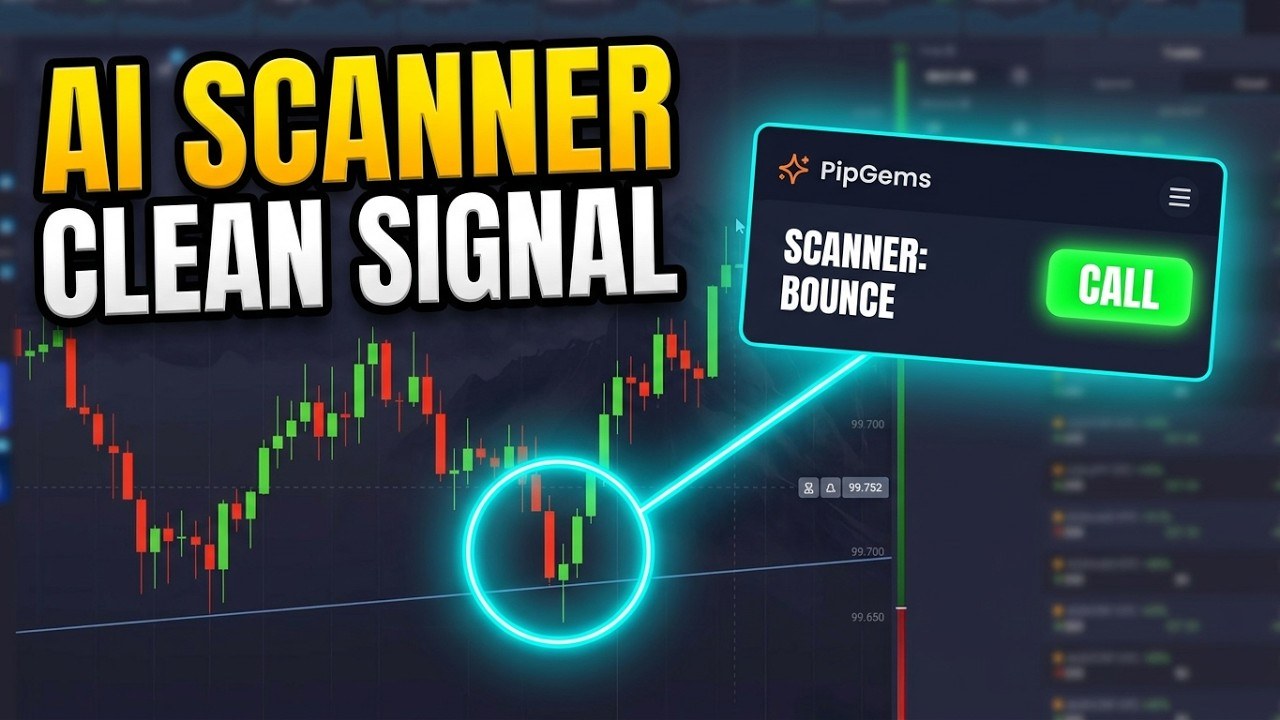
The CAD/JPY scan above is a typical result. CALL at Medium confidence, because “the price has shown a bounce from a recent low” and “a green candle is forming, suggesting upward momentum after a downtrend”. The trader buys and the trade wins.
A scan is only as current as its screenshot. The first AUD/CHF scan in the video, on one screenshot, says CALL. A fresh upload a few seconds later, after more red candles, says PUT, and the PUT is the one that gets traded and wins. When the chart moves on, scan again before you click.
Every Trade, Checked
The Pocket Option history panel lists each trade with its time, direction, stake and payout, so the tally below comes straight from it. The list shows the session’s trades from 21:56 to 23:11. The video is cut down from more than an hour of trading to under five minutes.
| # | Time | Pair | Trade | Scan shown on screen | Result |
|---|---|---|---|---|---|
| 1 | 21:56 | AUD/CHF OTC | PUT | PUT, Medium: steady downtrend, run of red candles | +$27.60 |
| 2 | 22:02 | CAD/JPY OTC | CALL | CALL, Medium: bounce from a recent low, green candle forming | +$27.60 |
| 3 | 22:03 | CAD/JPY OTC | PUT | PUT, Medium: price at a resistance level, large red last candle | −$30.00 |
| 4 | 22:05 | AUD/USD OTC | CALL | CALL, Medium, after a sharp drop | +$27.60 |
| 5 | 23:03 | AUD/NZD OTC | PUT | PUT, Medium: recent downtrend, consecutive red candles | +$27.60 |
| 6 | 23:04 | CAD/JPY OTC | CALL | CALL, Medium, on a rebound off a low | −$30.00 |
| 7 | 23:06 | AUD/USD OTC | PUT | PUT, Medium | +$27.60 |
| 8 | 23:08 | EUR/CHF OTC | CALL | CALL, Medium: pullback to support after a bullish move | +$27.60 |
| 9 | 23:09 | AUD/NZD OTC | CALL | CALL, Medium: strong run of green candles | −$30.00 |
| 10 | 23:10 | AUD/NZD OTC | PUT | PUT, Medium: bearish trend, last candle red (30-second trade) | −$30.00 |
| 11 | 23:11 | AUD/CAD OTC | CALL | CALL, Medium, after a long slide (30-second trade) | +$27.60 |
| 12 | — | EUR/CHF OTC | CALL | Opened in the last seconds | Not settled on camera |
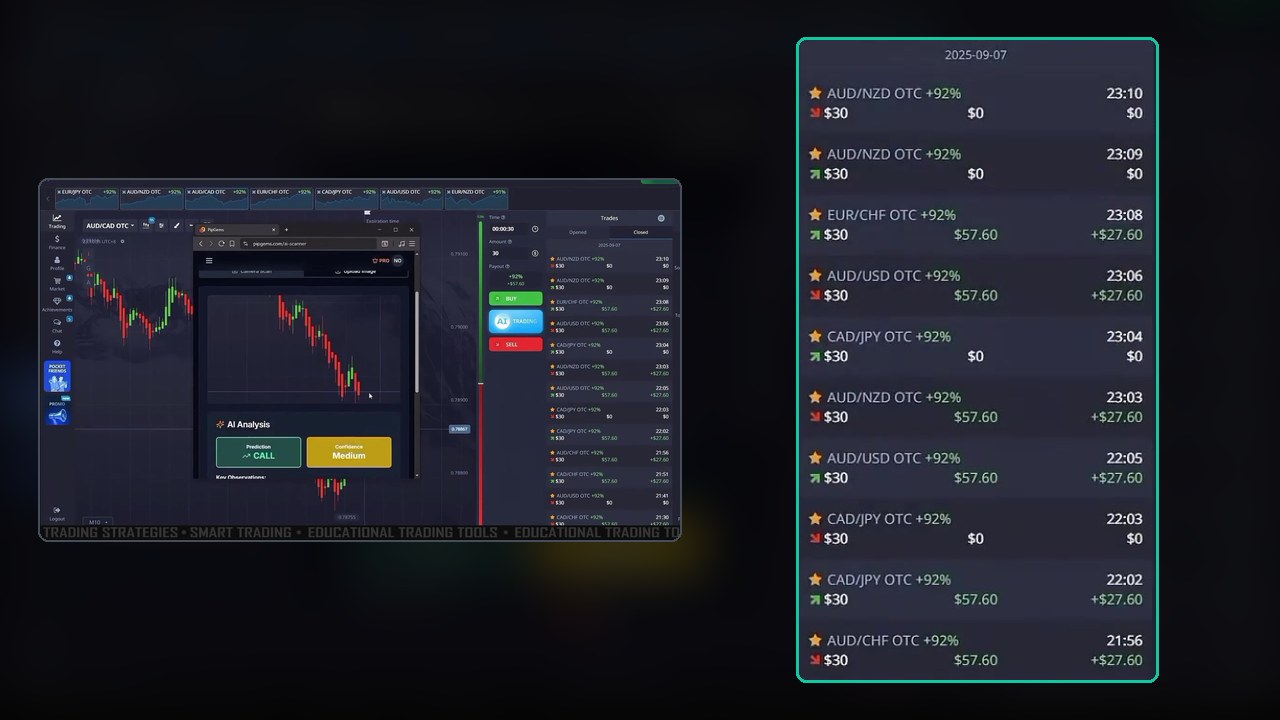
Eleven trades settled: 7 won and 4 lost. That is 7 × $27.60 = $193.20 won, minus 4 × $30 = $120 lost, so +$73.20 on $330 staked. The twelfth trade, an EUR/CHF CALL, opens in the last seconds and the video ends before it settles, so it is not counted.
Every one of the eleven entries follows a scan shown on screen, and each one goes the way the scanner said. The account balance is only visible in the short preview at the start, where it steps from $6,282.01 to $6,339.61 as one $57.60 win pays out, so the history panel is the record here. One more detail, for the record: in the very last frame the panel drops the 23:04 and 23:06 rows that it showed a few seconds earlier. The table above uses the complete list.
The trade history is dated 7 September 2025, so this is an older session that was uploaded recently, not a live one.
What the Losses Have in Common
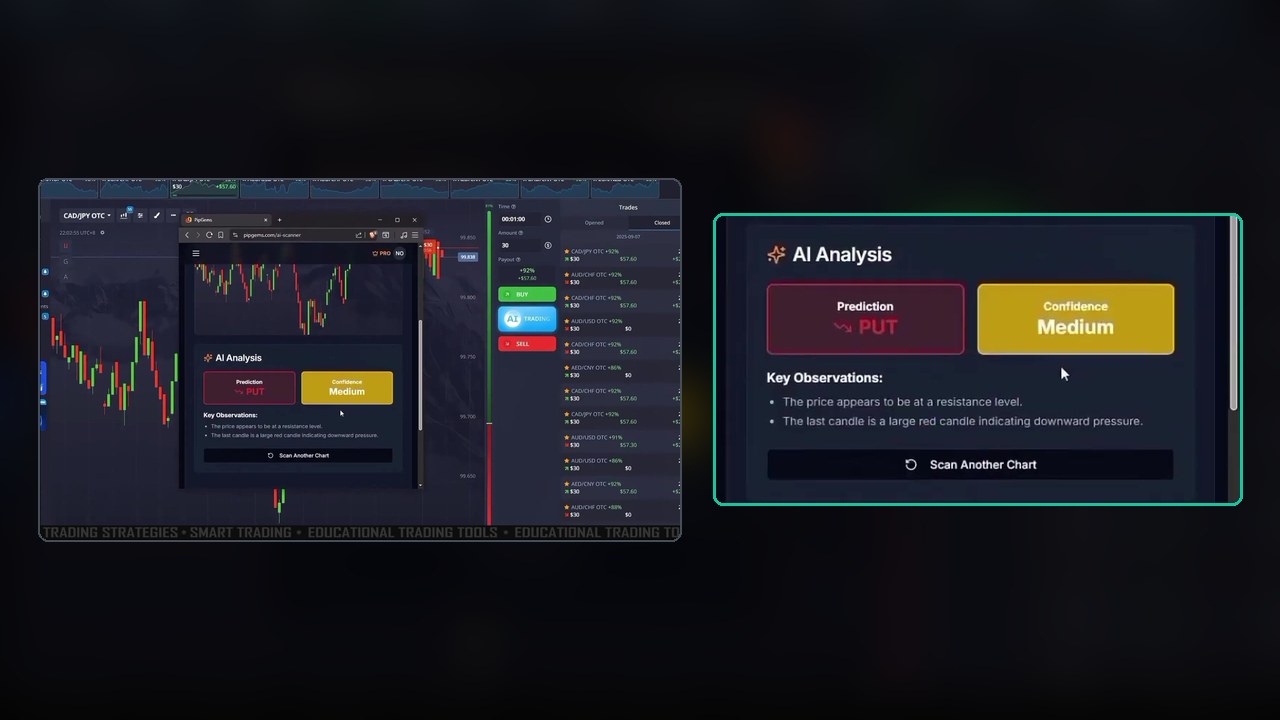
The four losses are worth a closer look, because they are the useful part of the session:
- CAD/JPY PUT at “resistance” (trade 3). One minute after the CAD/JPY CALL won, the next scan said PUT because price looked like it was at resistance and the last candle was large and red. Price kept climbing. One red candle in a fresh rally was not enough to turn it.
- CAD/JPY CALL on a rebound (trade 6). CAD/JPY had dropped hard and was starting a small green rebound. A fresh scan said CALL at Medium, and the rebound did not last.
- AUD/NZD CALL, then AUD/NZD PUT (trades 9 and 10). After a V-shaped recovery, the scan read “strong upward price action” and said CALL near the top. It lost. The next scan on the same pair read a “bearish trend” and said PUT. That lost too.
The pattern is that the scanner describes what has just happened, and the losing reads came straight after a fast move, when the next minute went the other way. When back-to-back scans on the same pair flip direction, as CAD/JPY and AUD/NZD did, the market is choppy, and skipping the pair is the simplest filter. Four losses are not enough to prove a rule, but they are the trades to study first.
What the Wins Have in Common
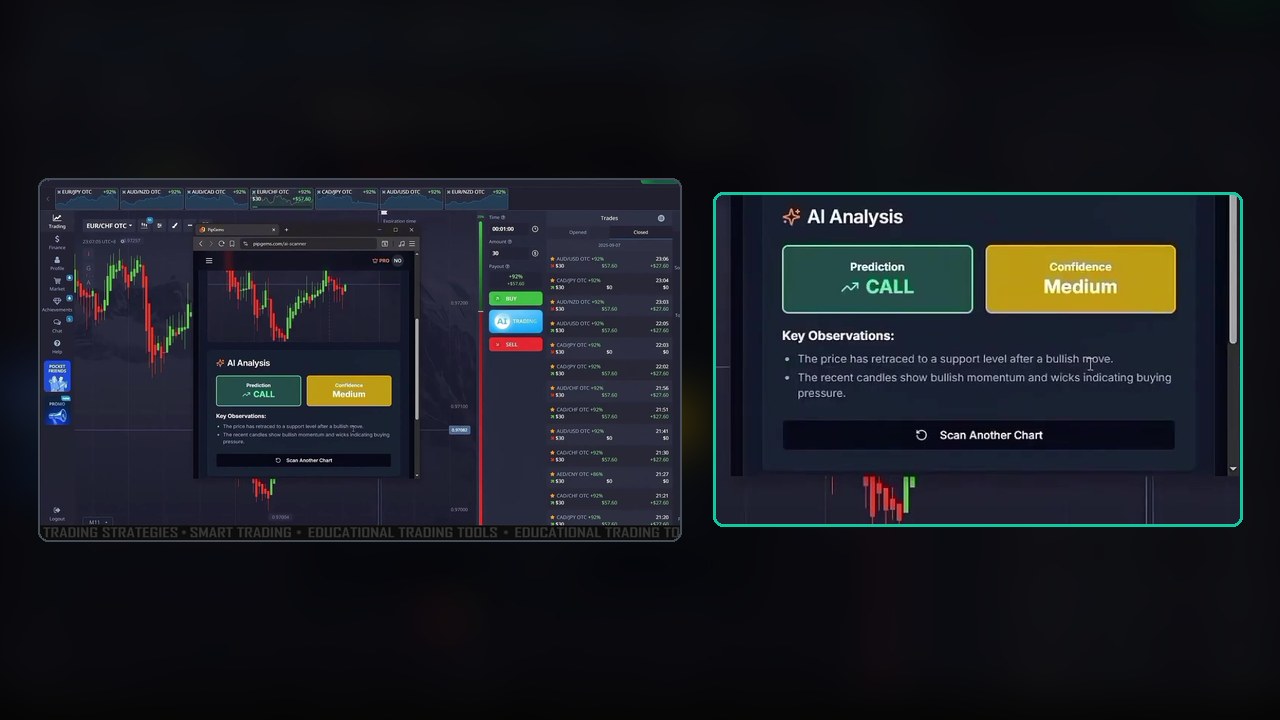
The clearest wins came from reads that describe a pullback into a level, not a run in one direction. Examples are the CAD/JPY “bounce from a recent low” and the EUR/CHF “price has retraced to a support level after a bullish move” with “wicks indicating buying pressure”. In those cases the scanner’s reason and the entry point agree: the move has already paused, and the trade goes with the bigger direction.
Every Scan Was Medium
The video description talks about Medium and High confidence, but every scan shown in this session came back Medium. So this video cannot tell you whether High-confidence reads do better. If you test the scanner yourself, log the confidence on every trade. That is the only way to find out whether the label means anything for your charts.
About OTC. Every pair in this session is OTC. Because the AI Chart Scanner reads a picture, it will give a result for any chart you upload, OTC included. OTC prices come from the broker’s own feed rather than the real market, though, and the PipGems live signals follow real-market pairs only. MT4 and MT5 indicators cannot read OTC prices at all. If you use the scanner on OTC, test it on a demo account first.
Watch the Video
Under five minutes: the configuration panel, the upload flow, and the session cut down to the scans and entries:
Limits to Keep in Mind
- Eleven trades is a demonstration, not a record. At a 92% payout you need to win about 52% of trades to break even. 7 of 11 is above that, but the sample is far too small to say whether it holds.
- The video is edited. More than an hour of trading is cut down to under five minutes. The history panel shows every trade in that window, which is why the tally above uses it rather than the clips.
- No narration. The reasoning comes from the scanner’s own observations and the trader’s clicks. Nothing is explained out loud.
- The scanner is decision support. It reads one screenshot. It does not know about news, the time of day, or what happened outside the frame.
Risk Management
- Keep the stake flat. The video uses $30 on every trade, with no doubling after a loss.
- Set a daily loss limit and a maximum number of trades before you start, and stop when you hit either one.
- Practise on the Pocket Option demo account and log at least 50 scanner trades, with the confidence and observations for each, before you risk real money.
- Binary and fixed-time trading is restricted in some countries, so check the rules where you live, and only trade money you can afford to lose.
Frequently Asked Questions
What settings does the PipGems AI Chart Scanner use in this video?
Chart type Candlestick, candle timeframe 5 seconds, target trade duration 1 minute, and the optional Notes for AI box left empty. The Pocket Option chart has no indicators on it, so the scanner reads only the candles.
How does the scanner get the chart?
Through the Upload Image tab on pipgems.com/ai-scanner. Browsers do not let a website take screenshots on its own, so you take the screenshot and upload it. There is also a Camera Scan tab for photographing a screen with a phone.
What confidence levels did the scanner give?
Every scan shown in this session came back Medium confidence. No High confidence result appears in the video, so there is no way to compare the two levels from this session.
What was the result in the video?
Eleven $30 trades settled at a 92 percent payout: 7 won (+$27.60 each) and 4 lost ($30 each), for +$73.20. Every one of them follows a scan shown on screen. A twelfth trade was still open when the video ends.
Can I use the AI Chart Scanner on OTC pairs?
It reads a picture of the chart, so it will return a result for any chart you upload, including OTC. Every pair in this video is OTC. OTC prices come from the broker's own feed rather than the real market, so test on a demo account first, and note that MT4 and MT5 indicators cannot read OTC prices at all.
The Verdict
4 out of 5. The configuration is shown clearly, every scan’s prediction and reasoning can be read on screen, and the full trade history lets each result be checked: 7 of 11 won, +$73.20 at a flat $30. It loses a point because the session is heavily edited, every pair is OTC, and every scan is Medium so the confidence levels cannot be compared.
The most useful thing in the video is the loss pattern. The scanner reads what the candles have just done. That works best when price has paused at a level, and worst right after a fast move. Use its observations as a second opinion on your own read of the chart, scan again whenever the chart moves on, and keep your own log.
#PocketOption #PipGems #AIChartScanner #1MinuteStrategy #CandlestickPatterns #BinaryOptions #OTCTrading
This content is for educational purposes only and is not financial advice. Trading involves substantial risk; you can lose some or all of your capital. No result is guaranteed and past results do not indicate future outcomes. Always practise responsible money management, limit your daily trades, and trade only what you can afford to lose.
Related reading: the same scanner with indicators on the chart is in PipGems AI Chart Scanner with Bollinger Bands + Heiken Ashi, and the full OTC setup with the Signal Companion extension is in PipGems AI Signal Scanner on Pocket Option OTC. For more, browse the Pocket Option hub or the full strategy library.