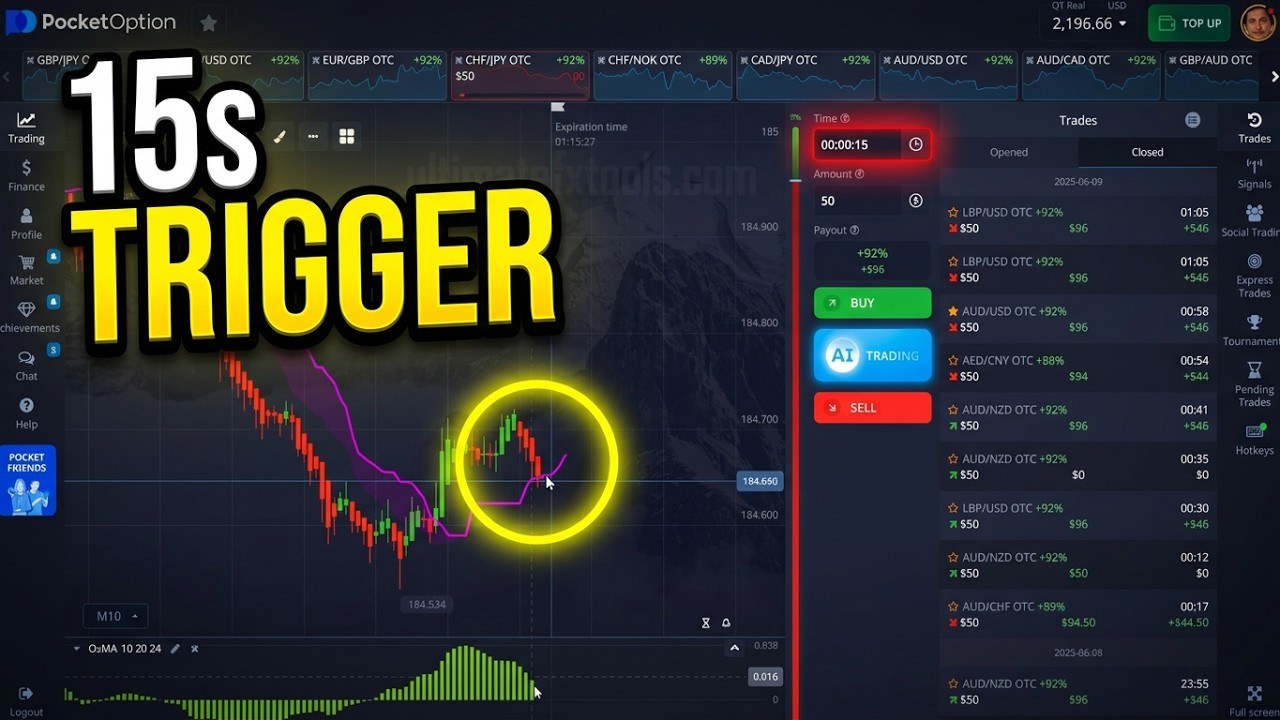
One Indicator, Two Lines, One Idea
Most 15-second strategies stack three or four indicators and hope they agree. This one uses a single indicator that ships with Pocket Option — the ADX — and then hides half of it. With the main ADX line switched off, only the two direction lines are left: +DI in cyan and −DI in yellow. The whole strategy is reading how far apart those two lines are.
The idea is a snap-back trade. When price makes a strong one-way move, one DI line climbs and the other sinks, and the gap between them gets wide. At that point the move is stretched, and on a 15-second expiry you are betting on the small pullback that usually follows. After a long drop you buy. After a long rise you sell.
We went through the video frame by frame and logged every entry: 20 entries on nine setups, 14 wins, 5 losses and 1 tie. The numbers, and the part of the profit that came from stacking entries rather than from the indicator, are all below.
The Setup, Exactly as Shown
- Platform: Pocket Option, desktop
- Indicator: ADX — ADX Smoothing 19, DI Length 19
- Styles: the adx line unticked (hidden); plusDI cyan and minusDI yellow left on
- Chart: Heikin Ashi candles on the 5-second (S5) timeframe
- Trade time: 15 seconds
- Stake: $50 per entry, payout 92% on every pair traded ($96 back on a win)
- Markets: OTC pairs — CAD/JPY, CHF/JPY, NZD/USD, CAD/CHF, BHD/CNY, TND/USD, YER/USD, AED/CNY and AUD/NZD
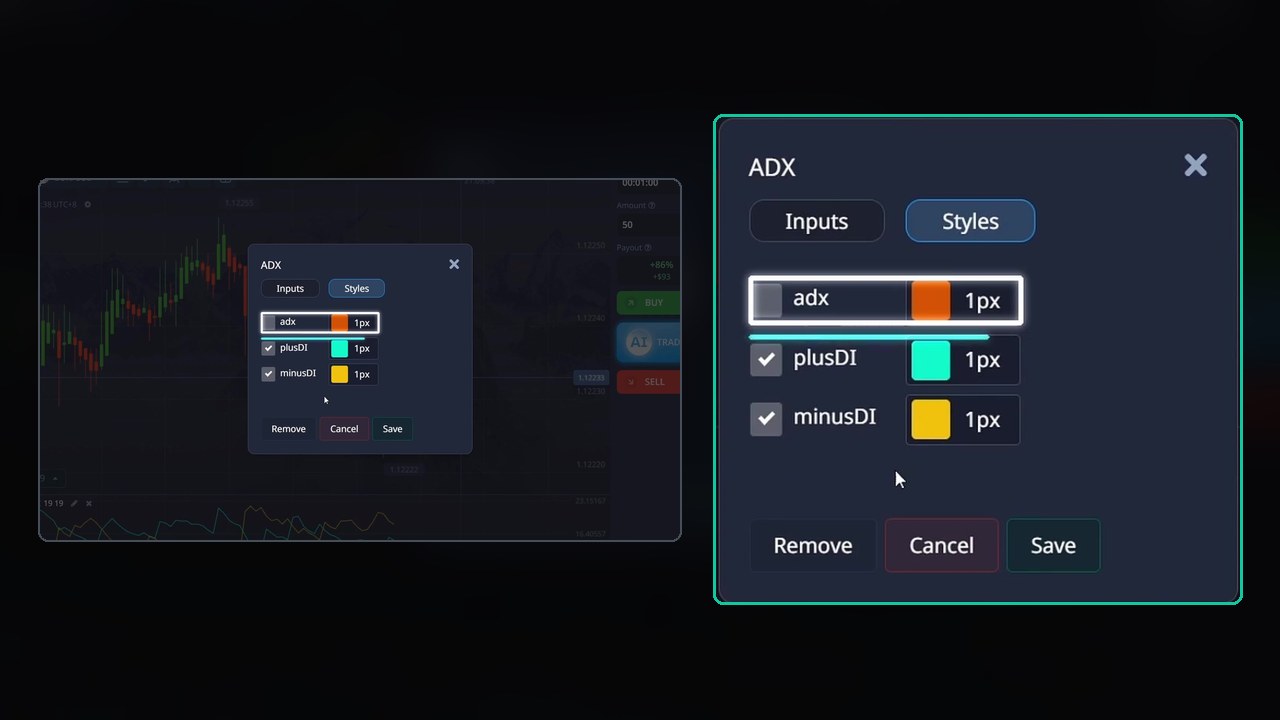
Hiding the ADX line is not cosmetic. The ADX line measures trend strength without a direction, and on a 5-second chart it mostly adds noise to the panel. With it gone, the panel reads like a simple gauge: the further apart cyan and yellow are, the more one-sided the last stretch of candles has been. The video also shows the Alligator as an optional extra on the chart, but every entry in this session is taken from the DI lines alone.
The Entry Rules
- Wait for a long one-way move on the 5-second Heikin Ashi chart — a run of same-coloured candles, not two or three.
- Check the DI gap. After a long rise, cyan (+DI) should be high and yellow (−DI) low, with a wide gap between them. After a long drop it is the other way round. In the video a double-headed arrow marks the gap each time.
- Trade against the move for 15 seconds. Wide gap after a rise → SELL. Wide gap after a drop → BUY.
- No wide gap, no trade. When the two lines are tangled together, as they are on EUR/USD early in the clip, the market is going sideways and there is nothing to fade.
A Sell After a Long Rise: CHF/JPY OTC
The cleanest example in the clip. CHF/JPY OTC climbs from 200.674 to above 201.08 in a steady run of green candles. In the panel below, cyan has pulled well above yellow — the widest gap on the chart. The trader sells $50 for 15 seconds right at the top of the run.
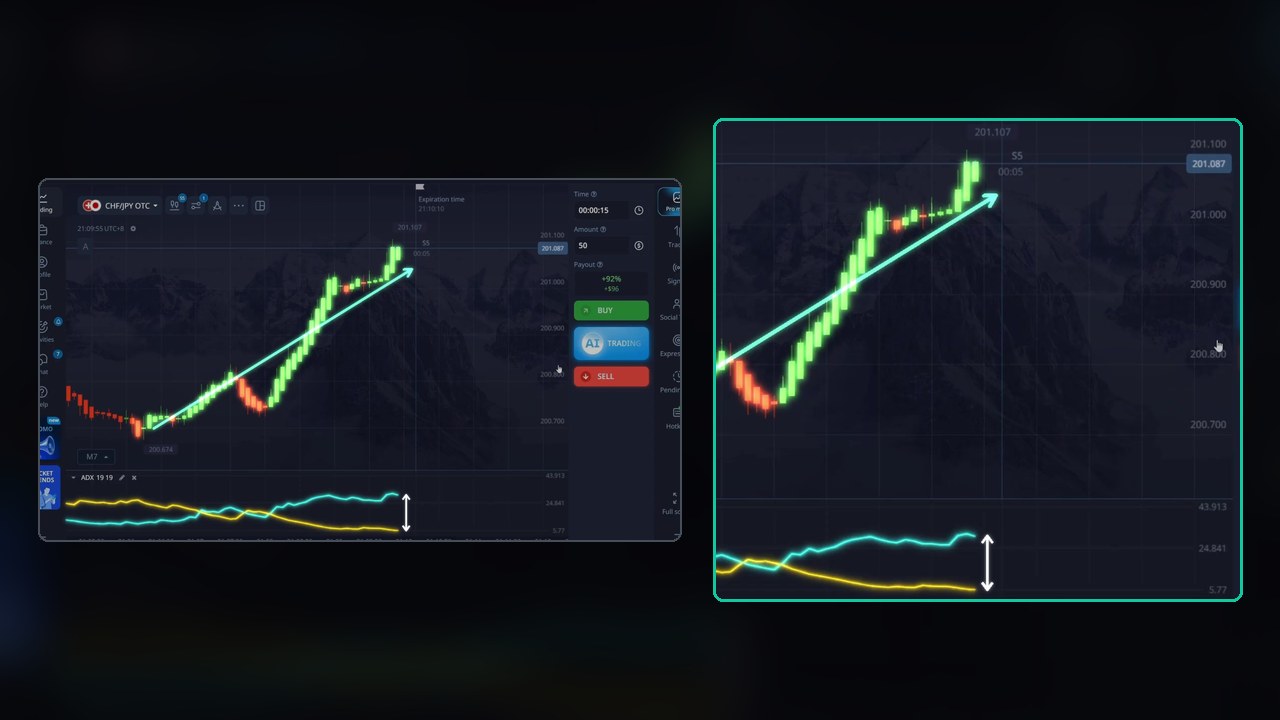
The next candles pull back and the trade closes green: $96 back, $46 profit.
A Buy After a Long Drop: CAD/JPY OTC
The mirror image. CAD/JPY OTC falls from about 110.03 to 109.79 in a straight line of red candles, and in the panel yellow (−DI) sits high with cyan pressed to the bottom. The trader buys $50 for 15 seconds.
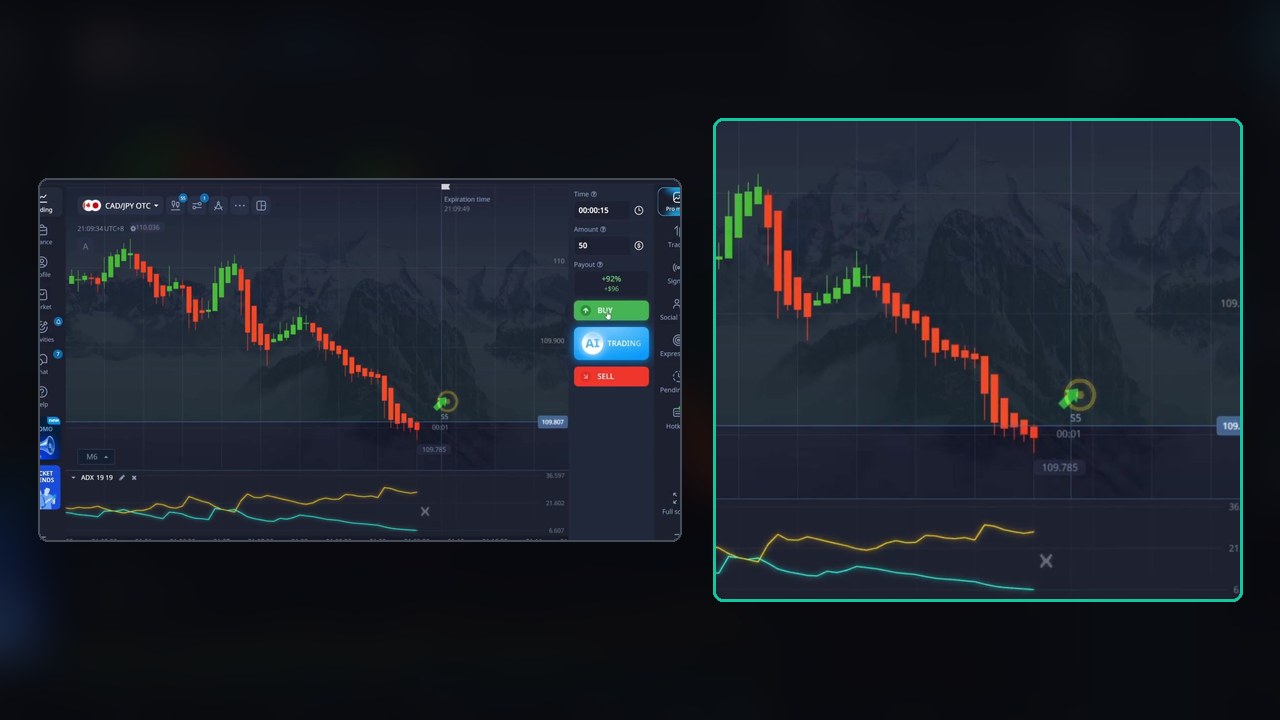
One small bounce is all a 15-second trade needs, and it comes: $96 back, $46 profit.
Every Entry in the Session
We read each result from the “Trade closed” pop-ups and the result tags on the chart. Payout was 92% throughout, so a win returns $96 on a $50 stake (+$46), a loss returns $0 (−$50), and a tie returns the $50 stake.
- CAD/JPY OTC — buy after a drop: 1 entry, win (+$46)
- CHF/JPY OTC — sell after a rise: 1 entry, win (+$46)
- NZD/USD OTC — buy after a drop: the first entry lost; two more buys were added a few seconds later and both won (−$50, then +$92)
- CAD/CHF OTC — sell after a rise: 1 entry, win (+$46)
- BHD/CNY OTC — sell after a rise: 1 entry, win (+$46)
- TND/USD OTC — buy after a drop: 1 entry, tie ($50 back, $0)
- YER/USD OTC — sell after a rise: 8 entries. The first lost, two more lost, then five more sells near the top all won (−$150, then +$230)
- AED/CNY OTC — buy after a drop: the first entry lost, two more buys both won (−$50, then +$92)
- AUD/NZD OTC — buy after a drop: 1 entry, win (+$46)
Total: 20 entries, 14 wins, 5 losses, 1 tie. At $50 a trade that is 14 × $46 = $644 won and 5 × $50 = $250 lost: +$394 on $1,000 staked. One note on the YER/USD count: the five winning result tags close a second apart and partly overlap on screen. We counted them from the tags and the pop-ups as the trades closed.
The Stacked Entries — Read This Part Slowly
The description is upfront that the session includes stacked entries, and so are we. On three of the nine setups the first trade lost and the trader added more entries in the same direction instead of stopping. YER/USD is the extreme case. After the first sell lost, seven sells were open at once — $350 at risk on one pair inside a few seconds, on top of the $50 already lost.
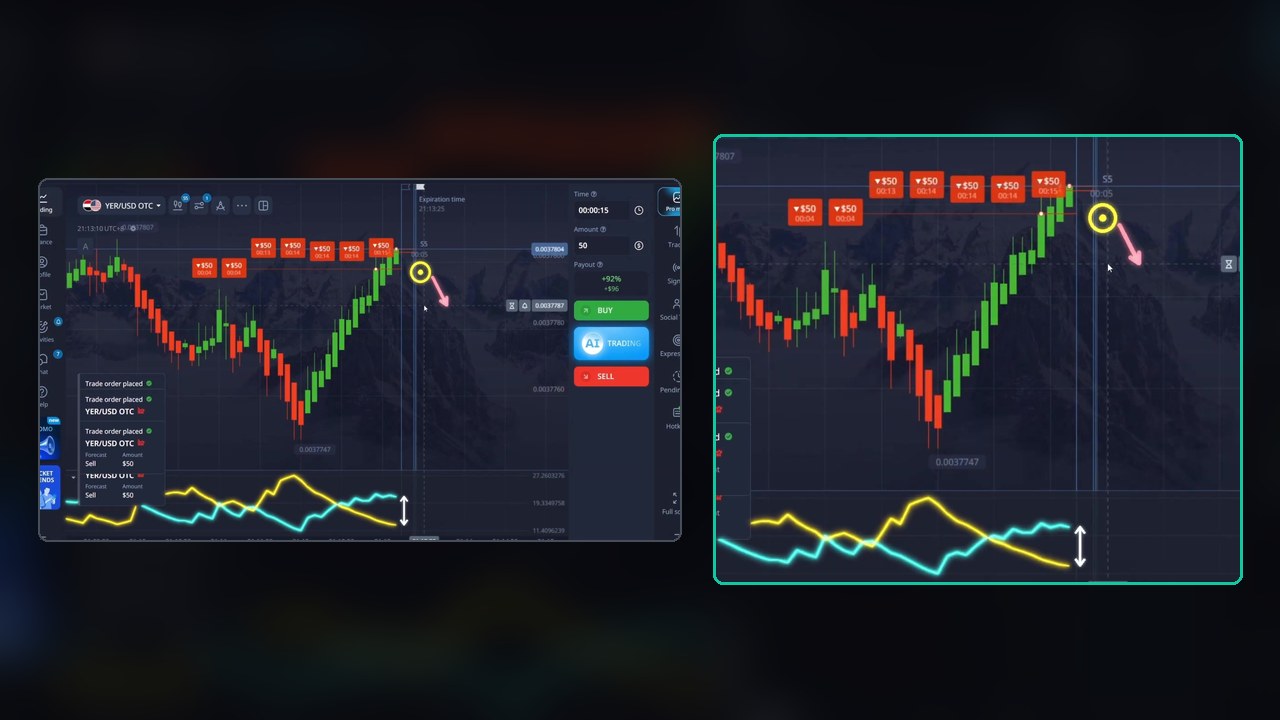
It worked on camera: five of those seven closed green. But split the session into its two parts and the picture changes:
- First entry on each of the nine setups: 5 wins, 3 losses, 1 tie = 5 × $46 − 3 × $50 = +$80.
- The 11 add-on entries: 9 wins, 2 losses = +$314.
So about four-fifths of the profit came from adding entries after a loss, not from the signal itself. That is the pattern that makes a session look great and a week look terrible. One more leg up on YER/USD and the same stack would have cost $400 on one pair. On a 15-second chart that can happen inside a single candle.
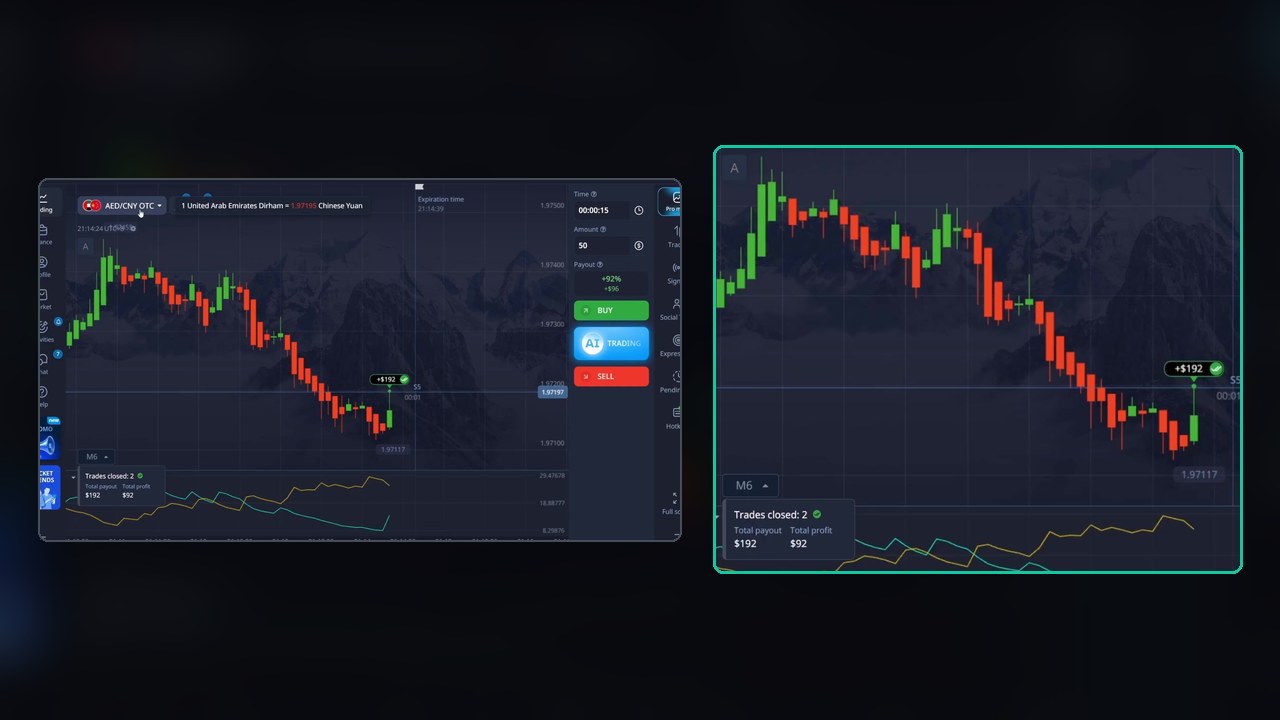
AED/CNY shows the same thing on a smaller scale: the first buy lost, and two more buys a few seconds later won together for $192 back, $92 profit.
OTC Pairs and Why That Matters
Every pair in this session is an OTC pair. OTC quotes are produced by the broker’s own liquidity providers rather than the interbank market, and Pocket Option shows a note saying so in the asset list. That does not stop the DI lines working — they only read the candles in front of them — but it does mean results on OTC pairs tell you nothing about how the same rules behave on regular market pairs, and the other way round. Test on the market you plan to trade.
Turning It Into Rules You Can Test
- Add the ADX at 19/19, untick the adx line, and keep +DI cyan and −DI yellow so the colours match the video.
- Define “wide gap” for yourself. The video judges it by eye. Pick a rule you can repeat, for example the gap is at least as wide as anything else visible on the panel.
- One entry per setup, flat stake. If the first entry loses, the setup is over. No add-ons.
- Skip tangled lines. If cyan and yellow keep crossing, there is no stretched move to fade.
- Log 50 setups on a demo account before using real money. At a 92% payout you need to win about 52% of the time just to break even. This clip’s first entries went 5 out of 8 decided trades, which is promising and still far too small a sample to prove anything.
Watch the Video
The full setup, then all 20 entries, including the losing ones and the stacks:
Honest Weaknesses
- Most of the profit came from stacking. Without the add-on entries this session is +$80, not +$394.
- “Wide gap” is judged by eye. There is no number for it, so two traders watching the same chart will not take the same trades.
- Fading a strong move fails exactly when the move keeps going. Every loss in the clip is a trend that ran one more leg: NZD/USD, YER/USD and AED/CNY.
- 15 seconds leaves no room for a slow click. On 5-second candles a one-second delay is a fifth of a candle.
- Nine setups is a demonstration, not a test.
Risk Management
- Fix one stake for the session and keep it flat — no stacking, no doubling after a loss.
- Set a daily loss limit and a maximum number of trades, and stop when you hit either.
- Know your break-even: about 52% at a 92% payout, higher if the payout drops.
- Practise on a demo account first, and never trade money you cannot afford to lose.
Frequently Asked Questions
What ADX settings does this strategy use?
ADX Smoothing 19 and DI Length 19, with the main ADX line hidden in the Styles tab so only the +DI (cyan) and −DI (yellow) lines are shown.
When do you buy and when do you sell?
After a long drop, when −DI is far above +DI, you buy for 15 seconds. After a long rise, when +DI is far above −DI, you sell for 15 seconds. If the two lines are tangled together, there is no trade.
What timeframe and expiry are used?
Heikin Ashi candles on the 5-second (S5) chart, with a 15-second trade time.
What was the result in the video?
20 entries on nine setups: 14 wins, 5 losses and 1 tie at $50 each and a 92% payout, for +$394. The first entry on each setup made +$80; the rest came from extra entries stacked after a loss, which we do not recommend.
The Verdict
4.5 out of 5. It is about as simple as a 15-second strategy gets: one built-in indicator, two lines, a rule you can explain in one sentence. The video keeps the losing trades in. The first entries alone came out ahead in the clip, and the DI-gap idea is easy to test on a demo account in an afternoon.
The missing half star is the stacking. It produced most of the profit and it is the riskiest thing on screen, and the “wide gap” that triggers each trade is judged by eye. Take the DI-gap rule, give it a number, keep the stake flat and one entry per setup, and let a logged sample decide whether it works for you.
#PocketOption #TradingStrategy #ADX #ADXIndicator #HeikinAshi #15SecondTrading #OTCTrading #TechnicalAnalysis
This content is for educational purposes only and is not financial advice. Trading involves substantial risk; you can lose some or all of your capital. No result is guaranteed and past results do not indicate future outcomes. Always practise responsible money management, limit your daily trades, and trade only what you can afford to lose.
Related reading: ADX reversals on 40-second Quotex trades and the ADX trend-filter backtest. For more on this platform, see the strategy library.