The Whole Rule, in One Sentence
When the two Vortex lines cross, take the reversal. That is the entire signal. Everything else in this setup exists to tell you when not to.
It runs on Pocket Option OTC pairs at a 15-second expiry, on a 5-second Heikin Ashi chart, at a flat $50 stake. Three numbers and two indicators — which is about as small as a scalping setup gets before it stops having rules at all.
The Settings
- Vortex Indicator — period 18. The two lines, VI+ and VI−, cross when short-term buying and selling pressure swap places. That cross is the entry.
- RSI — period 24. Described in the video as optional. It is not, and the session itself proves it — see below.
- Chart: 5-second candles, Heikin Ashi. The averaged bodies smooth the noise so direction is readable at that speed.
- Trade duration: 15 seconds — three 5-second candles after the cross.
- Stake: flat $50 throughout. No doubling after a loss anywhere in the clip.
The Filter That Does the Work
Here is the part worth reading twice. The video states it plainly: take the cross only when the RSI is sitting near the 50 level. When RSI is at the middle, the market is in a normal state and a reversal has a better chance. When RSI is away from the middle — already stretched up or down — you skip.
That is a genuine skip condition, which most one-indicator scalping clips never bother to include. A Vortex cross on a fast chart fires constantly; without a condition that says “not this one”, you are simply taking every wobble.
And Then the Video Breaks It
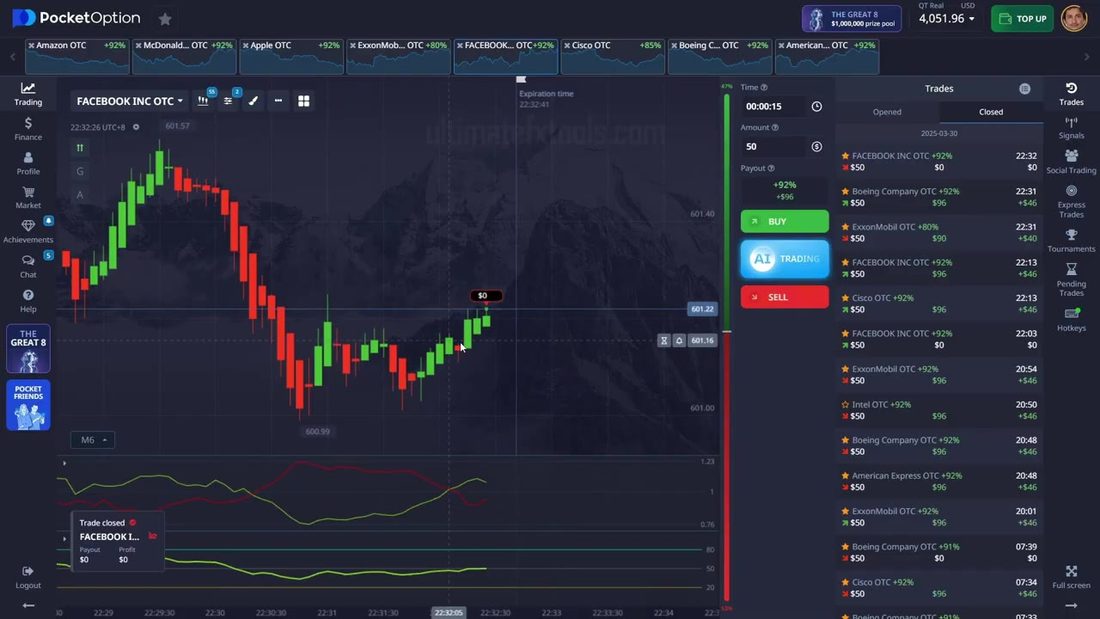
On the third pair, a cross appears and the narration is honest about what it is looking at: this one has less going for it, the swings are smaller — and the trade is taken anyway, explicitly to see how the rule holds when the setup is weak.
It closes red.
The conclusion stated straight after is the most useful sentence in the video: that happens, and it shows why the RSI filter matters. A deliberately weak entry, taken on camera, kept in the edit, and used to make the case for the filter. That is worth more than another winning screenshot.
What the Trade List Shows
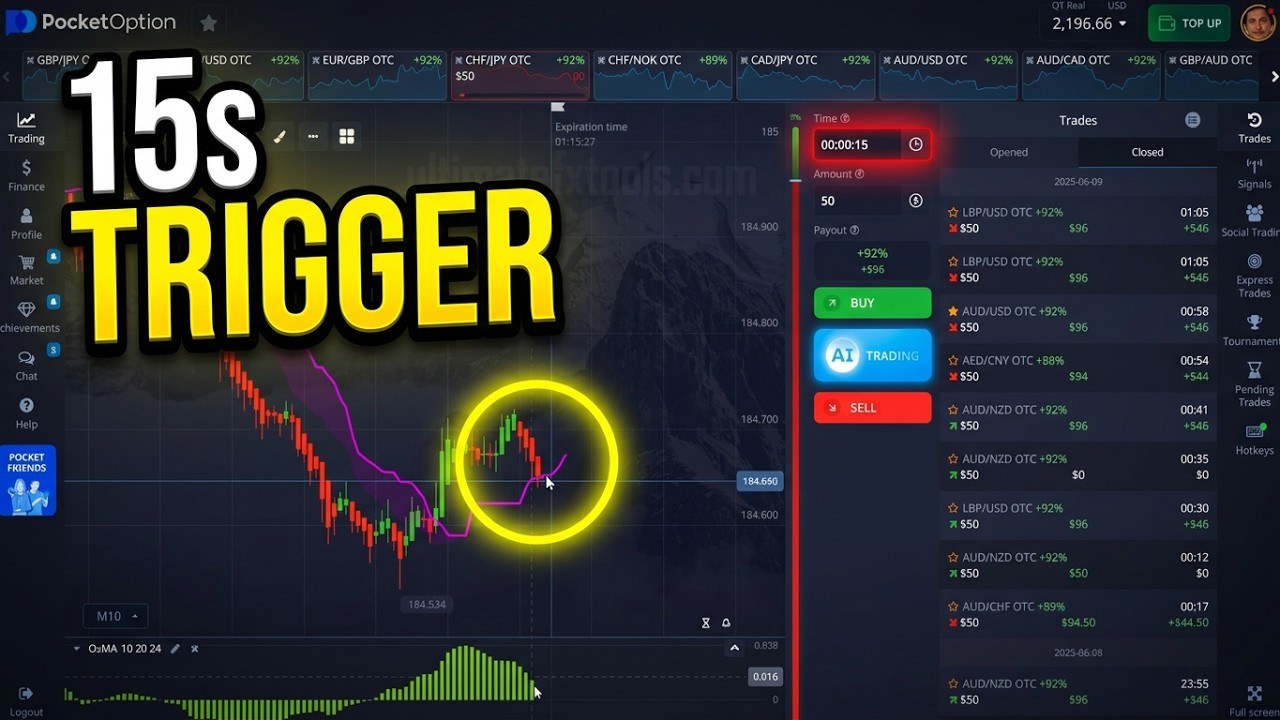
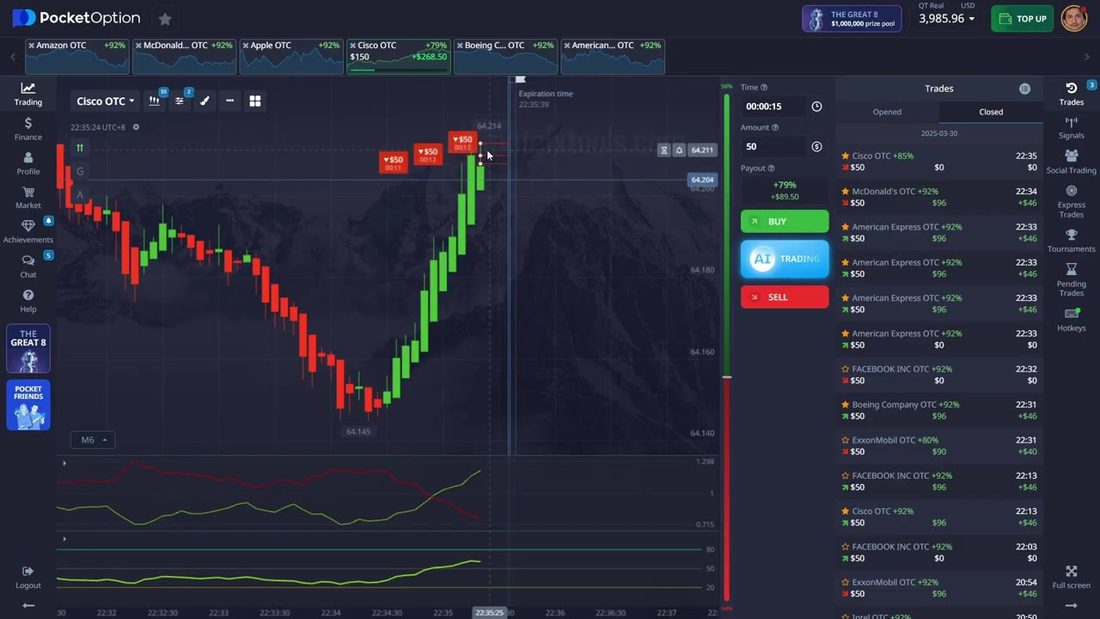
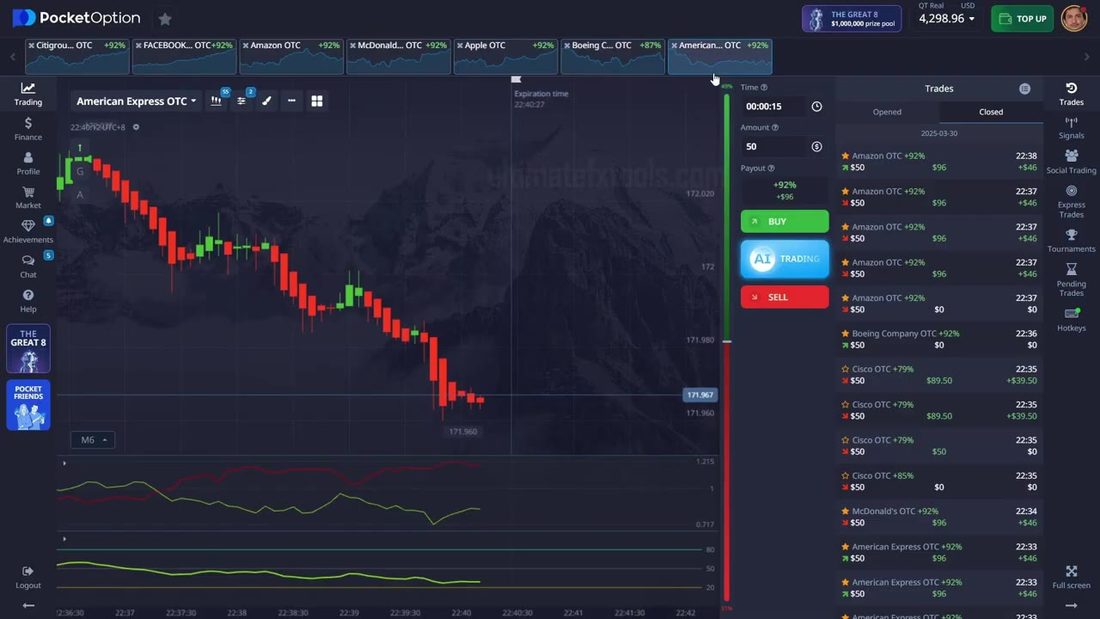
The closed-trades panel stays visible on the right for the whole session, and it is mixed — as any honest 15-second session is. Wins come in at +$96 and +$46 on $50 stakes, depending on whether the pair paid 92% or 80% at that moment; losses show as a flat $0.
Two things follow from that, and they matter more than the running total:
- The payout is not fixed. The same $50 returns $96 on one OTC pair and $90 or $46 on another. Your break-even win rate moves with it — 52.1% at a 92% payout, 54.6% at 83%, 55.6% at 80%. Taking a lower-paying pair with the same rule quietly raises the bar you have to clear.
- A handful of trades is not a win rate. Whatever the clip totals, a few entries at this speed tell you nothing about the edge. They tell you the setup exists and can be traded.
How to Trade It Properly
- Add Vortex at 18 and RSI at 24, switch the chart to 5-second candles, and set the candle type to Heikin Ashi.
- Wait for the Vortex cross. VI+ crossing above VI− is a call, VI− crossing above VI+ is a put.
- Check the RSI before you click. Near 50, take it. Stretched to either extreme, skip it — that is the rule the video demonstrates the cost of ignoring.
- Set 15 seconds and a flat stake decided before the session, not during it.
- Prefer the higher-paying pairs. At these speeds the payout difference is a bigger lever than any indicator tweak.
- Log fifty entries on demo — the cross, where RSI was, the payout and the result. That log, not any clip, is what tells you whether the filter holds.
Watch the Session
Eight minutes — the settings, the cross, the deliberate weak entry and what it cost:
Honest Weaknesses
- “Optional” undersells the RSI. The video calls it optional and then loses the one trade it skipped the filter on. Treat it as required.
- “Near 50” is not a number. How near? 45–55? 48–52? The video never says, and on a 5-second chart that ambiguity is several trades a minute. Pick a band, write it down, and hold yourself to it.
- The Vortex cross repaints your patience, not the chart. Lines that cross and re-cross within two bars are common at this speed; nothing in the rule tells you to wait for the bar to close.
- Small sample. A few narrated trades cannot support a win-rate claim, and none is made — but do not supply one yourself.
- OTC pairs only. These are synthetic weekend series. Behaviour there does not automatically transfer to live-market hours.
- 15 seconds forgives nothing. A late click, a lagging indicator or one bad tick near expiry decides the trade.
Risk Management
- Flat stake, decided before you sit down. The video models this correctly — copy it.
- Set a daily loss limit and a hard trade cap. At 15 seconds you can take twenty trades in five minutes without noticing.
- Know the break-even for the payout you actually took: 52.1% at 92%, 54.6% at 83%, 55.6% at 80%.
- Demo until your own log — not a video — says the filter is worth trading.
Frequently Asked Questions
What are the Vortex and RSI settings for this Pocket Option strategy?
Vortex with a period of 18 and RSI with a period of 24, on 5-second Heikin Ashi candles, traded at a 15-second expiry. Both numbers are stated in the video narration.
What is the entry rule?
The two Vortex lines crossing is the reversal signal — VI+ crossing above VI− for a call, VI− crossing above VI+ for a put. The RSI is described as optional, with one condition attached: take the trade only when RSI is sitting near the 50 level, and skip it when RSI is away from the middle.
Does the video follow its own RSI filter?
Not on every entry. One trade is taken with the narration admitting the setup is weak and the swings are small, purely to see how the rule holds — and it closes red. The video then says that loss shows why the RSI filter matters. The filter is stated, broken deliberately, and the cost of breaking it is left on screen.
Why 5-second candles with a 15-second expiry?
A 15-second trade spans three 5-second candles, so the expiry is roughly the next three bars after the cross. Heikin Ashi is used because its averaged bodies make direction easier to read at that speed. It also means one bad tick near expiry decides the trade, which is the trade-off of the whole timeframe.
The Verdict
4.5 out of 5. What it gets right: the settings are stated as numbers rather than hinted at, the rule fits in one sentence, there is a real skip condition attached to it, and the losing trade is not only kept in — it is taken on purpose to show what ignoring the filter costs. The stake stays flat after the loss. For an eight-minute strategy clip, that is unusually straight.
What holds it back: “near 50” needs to be an actual band before anyone can trade it consistently, and calling the RSI optional works against the video’s own best lesson. Fix those two things in your own notes and this is a clean, honest setup to take to demo.
#PocketOption #Vortex #HeikinAshi #RSI #15SecondTrades #Scalping #OTC #BinaryOptions #TradingStrategy #RiskManagement
This content is for educational purposes only and is not financial advice. Trading involves substantial risk; you can lose some or all of your capital. No result is guaranteed and past results do not indicate future outcomes. Always practise responsible money management, limit your daily trades, and trade only what you can afford to lose.
Related reading: the Ichimoku + OsMA session at the same expiry shows the other way to trade 15 seconds, the Vortex indicator write-up covers what the two lines actually measure, and the strategy library has the rest of the platform.