Six Entries, Two of Them Losers
This is a short live session on Pocket Option OTC pairs using two indicators — the Ichimoku Kinko Hyo and the OsMA — on 15-second trades at a flat $50. Six entries are taken with commentary, and the video keeps both losses in, including one the trader blames on his own chart settings.
We have already written up this combination as a setup: see the Ichimoku + OsMA settings guide for the parameters and the entry logic. This post is the other half — what happens when the setup is actually traded, and two details on the chart that do not match the written instructions.
The Session, as Shown
- Platform: Pocket Option, live account, OTC pairs only
- Trade duration: 15 seconds, flat $50 per entry
- Payouts on screen: mostly +92%, with 83–89% on some pairs
- Pairs traded: CHF/JPY, CHF/NOK, CAD/JPY, AUD/USD, GBP/AUD and EUR/USD, all OTC
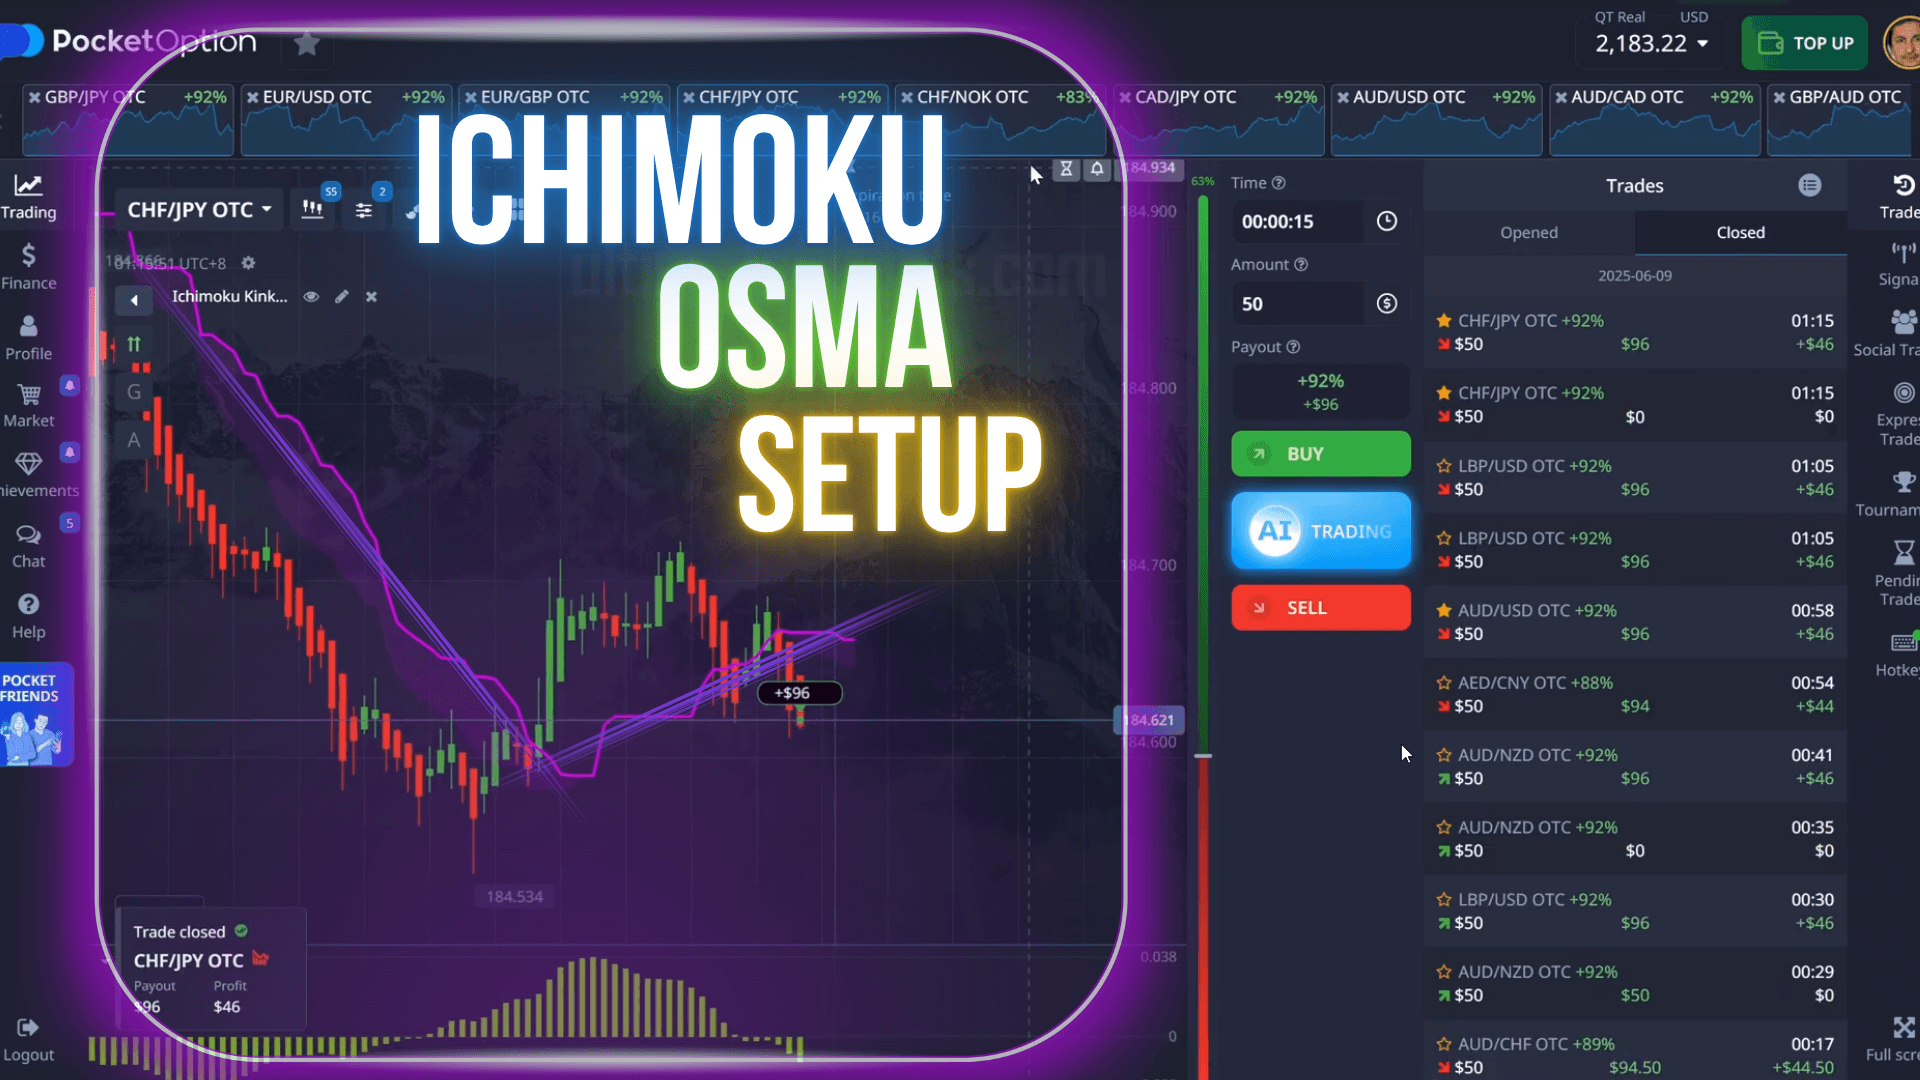
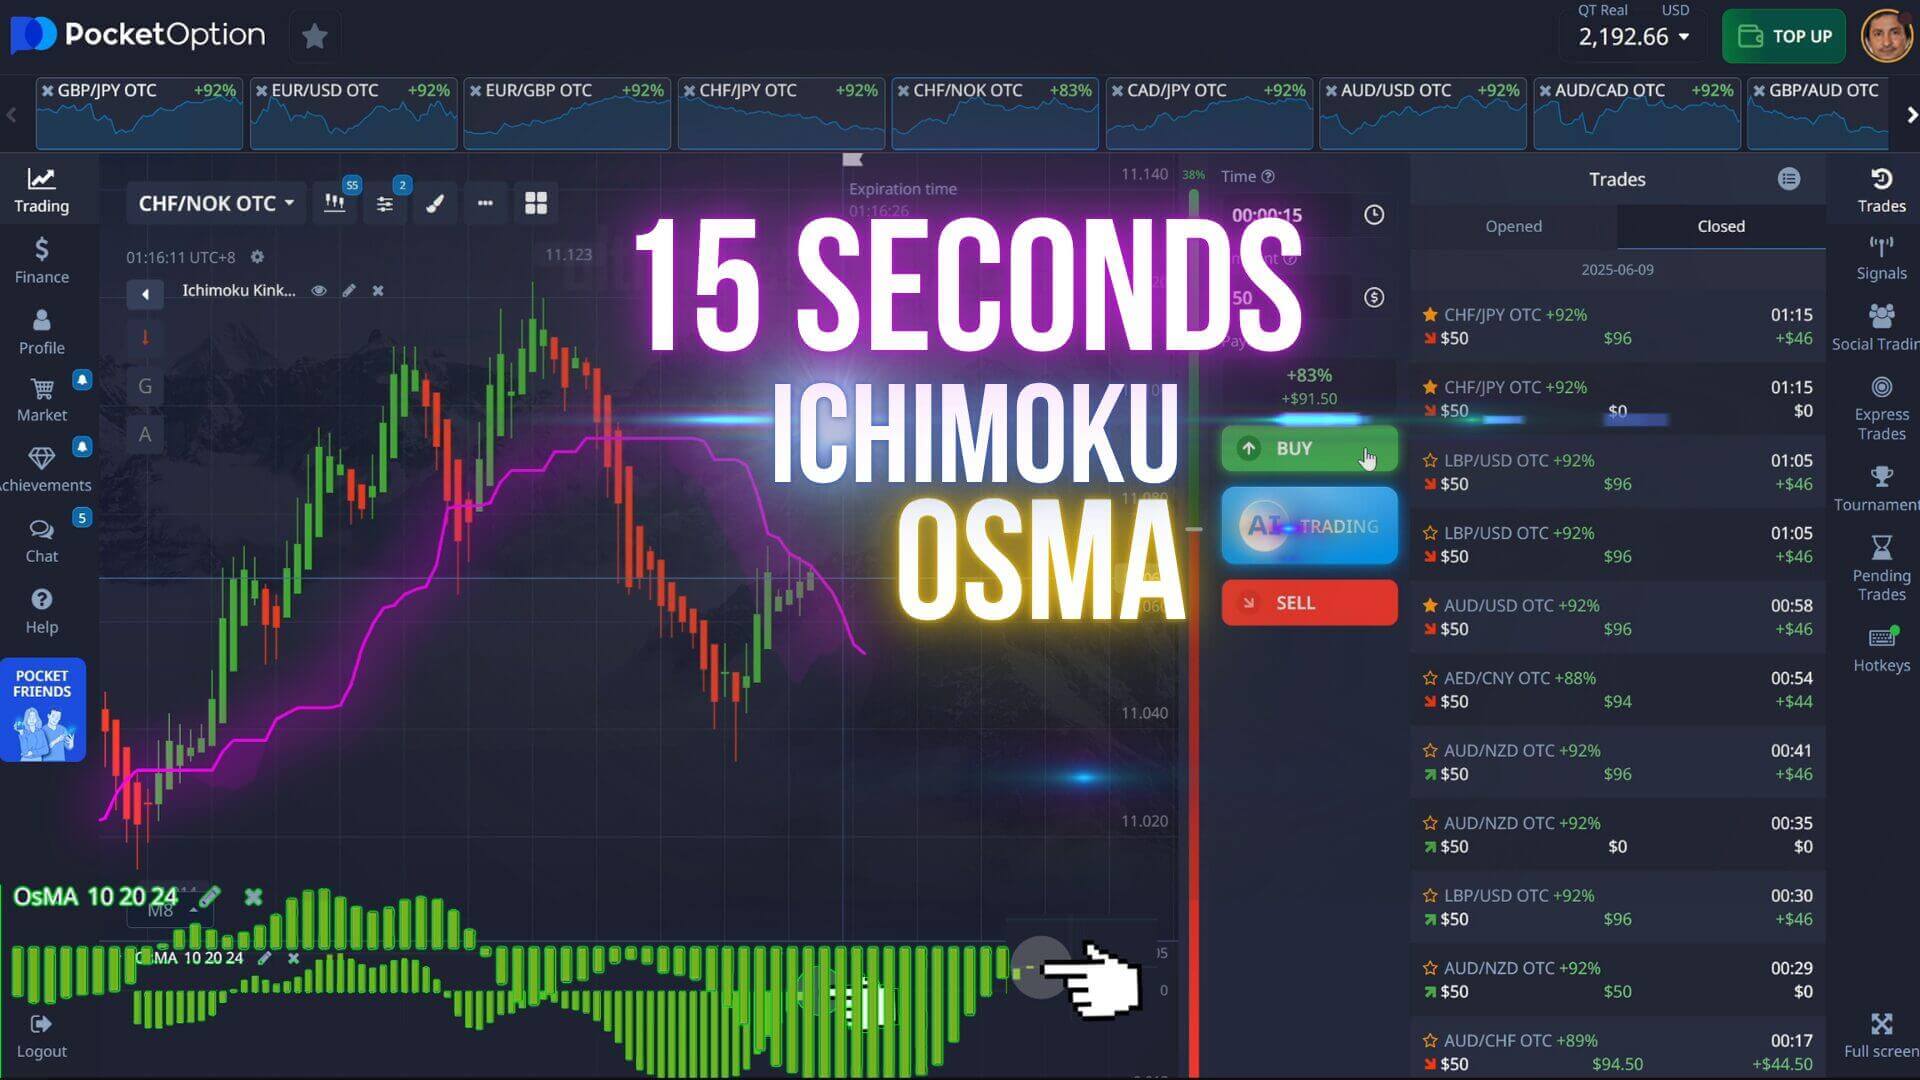
- Indicators: Ichimoku with only the Senkou Span B line displayed (the purple line), plus the OsMA histogram below the chart
Two Things on the Chart That Do Not Match the Instructions
Before copying anything, compare what the video says with what the screen shows. Two differences are visible, and both matter.
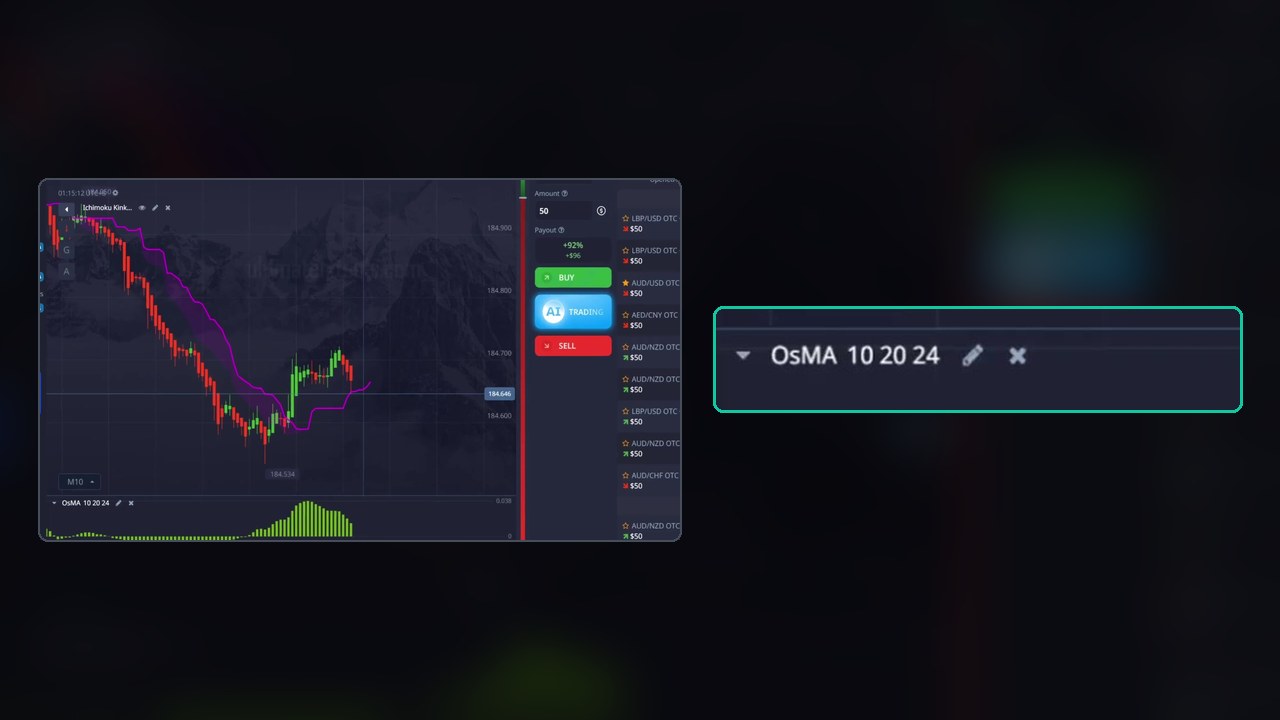
1. The OsMA is not on default. The written setup says “OsMA: Default”, but the label on the chart reads OsMA 10 20 24. A standard OsMA is 12 / 26 / 9, so those are custom periods with a much longer signal line. If you set yours to default and the video’s to 10/20/24, your histogram will not turn where the video’s turns. Copy the chart, not the description.
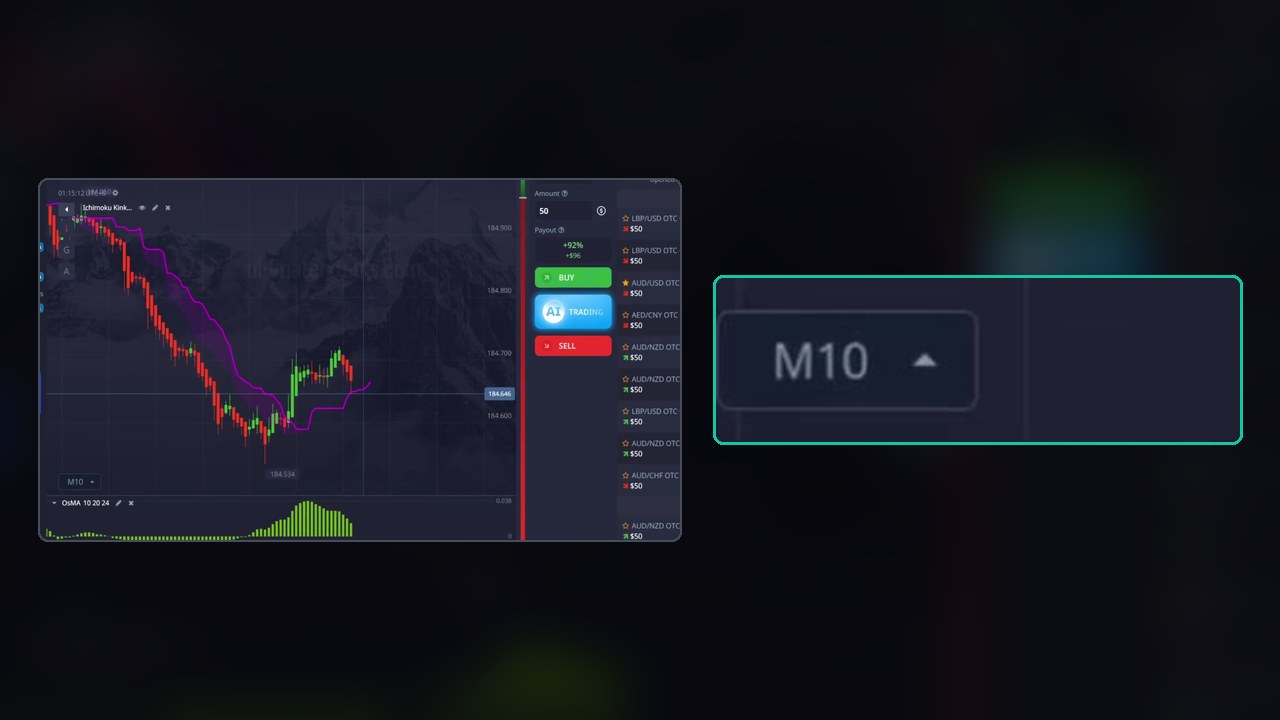
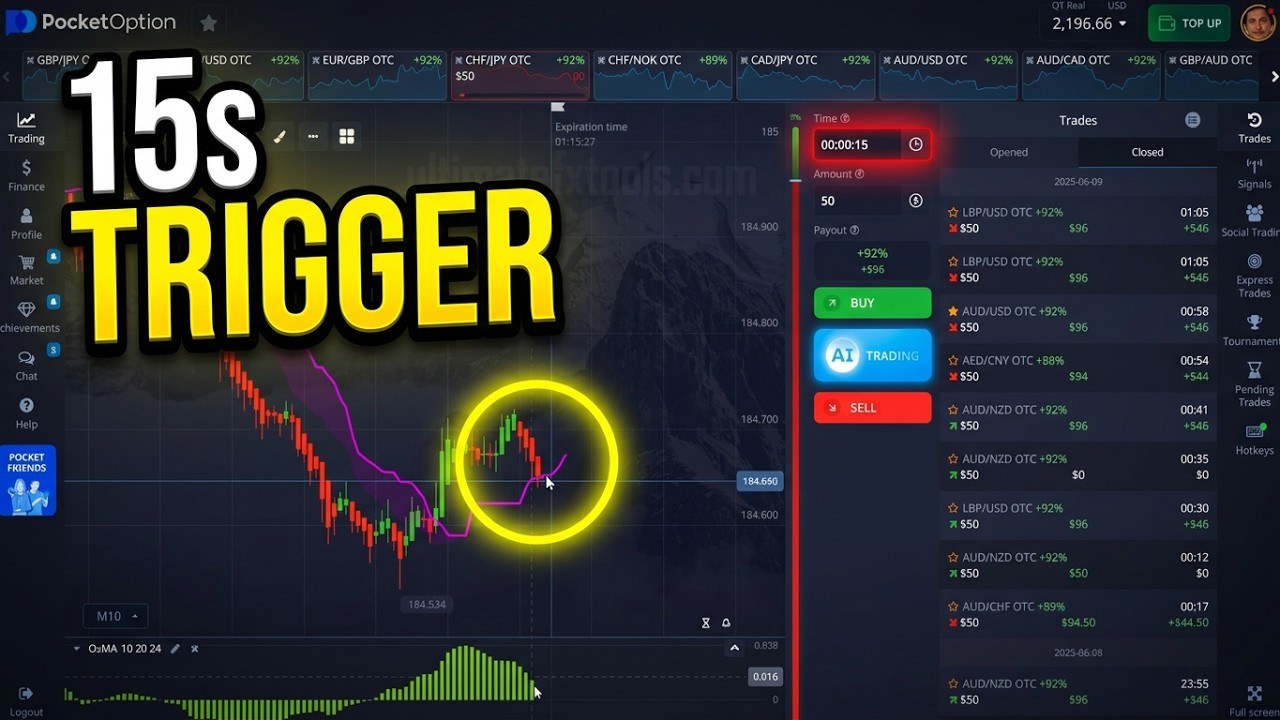
2. The timeframe reads in minutes, not seconds. The narration asks for 5-second Heikin Ashi candles, but the chart’s timeframe control reads M10 during the first trade and M8 for the rest of the session. From the video alone we cannot tell whether the control means something other than the candle interval or the session genuinely ran on minute candles — but the trader himself flags it right after the first trade loses: “always double check that you’re on the 5-second time frame.”
That is the single most useful sentence in the video. On a 15-second expiry, the candle interval decides what a “cross” even means: on 5-second candles a 15-second trade is three candles long; on 10-minute candles it is a rounding error inside one.
The Entry Rule as Traded
Stripped to its simplest form, the rule in the video is:
- Price crosses the purple Senkou Span B line.
- The OsMA is at or moving through its middle — momentum is turning rather than extended.
- Enter a 15-second option in the direction of the cross.
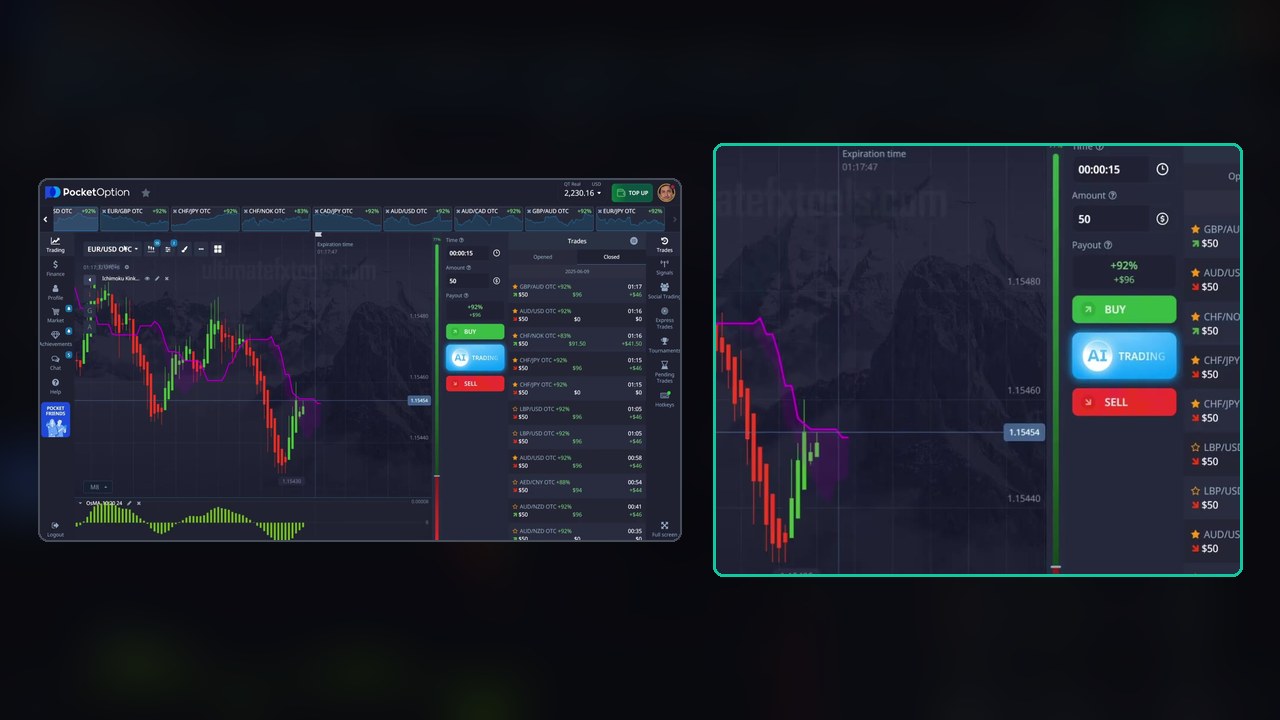
Notice what is not in the rule: no trend filter, no minimum distance from the line, and no rule for skipping a signal. That is the gap the two losses fall into.
Trade by Trade
Every figure here is read off the screen and reconciled against the account balance, which is visible throughout.
- CHF/JPY OTC, down — the demonstration entry. Lost. This is the one after which the timeframe warning appears.
- CHF/JPY OTC, down again — a fresh entry rather than a doubled one, taken because the OsMA is still mid-range and pointing lower. Won, +$96 at 92%.
- CHF/NOK OTC, up — cross plus OsMA at the middle. Won, +$91.50 at 83%.
- AUD/USD OTC, down — taken with the OsMA already printing solid downtrend bars. Lost.
- GBP/AUD OTC, up — Won, +$96.
- EUR/USD OTC, up — green candle through the purple line, OsMA rising from the middle. Won, +$96.
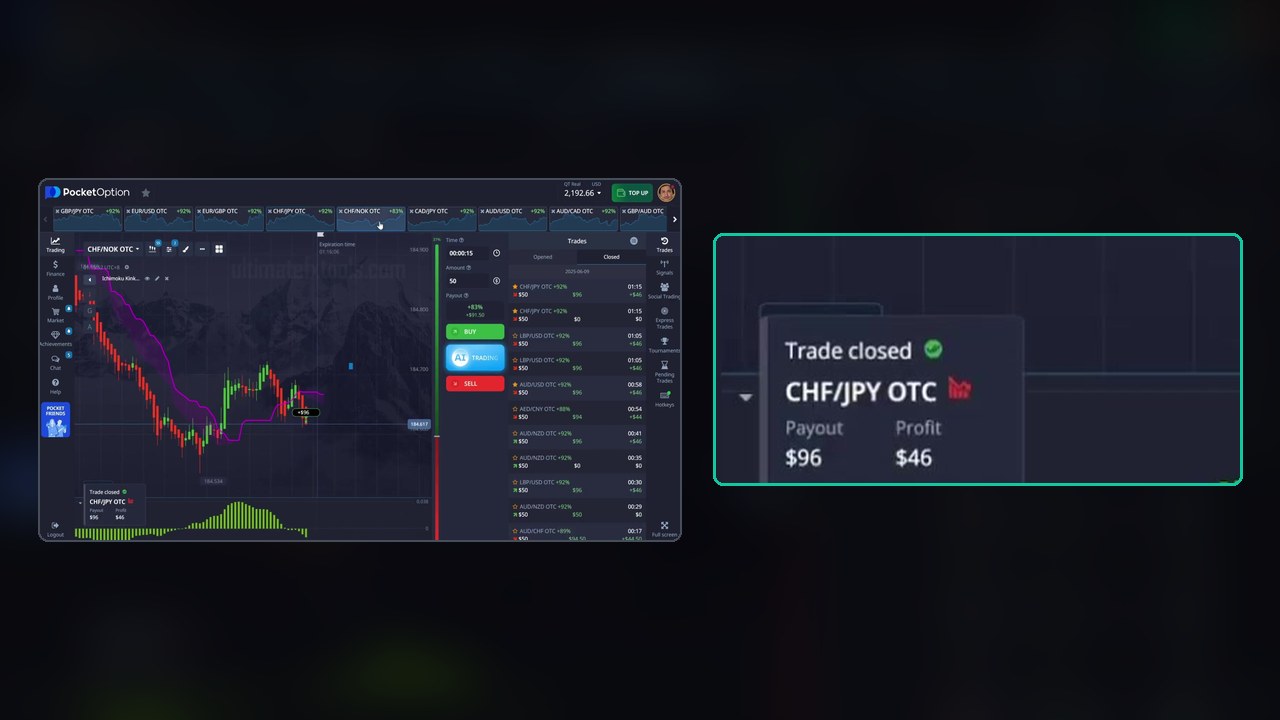
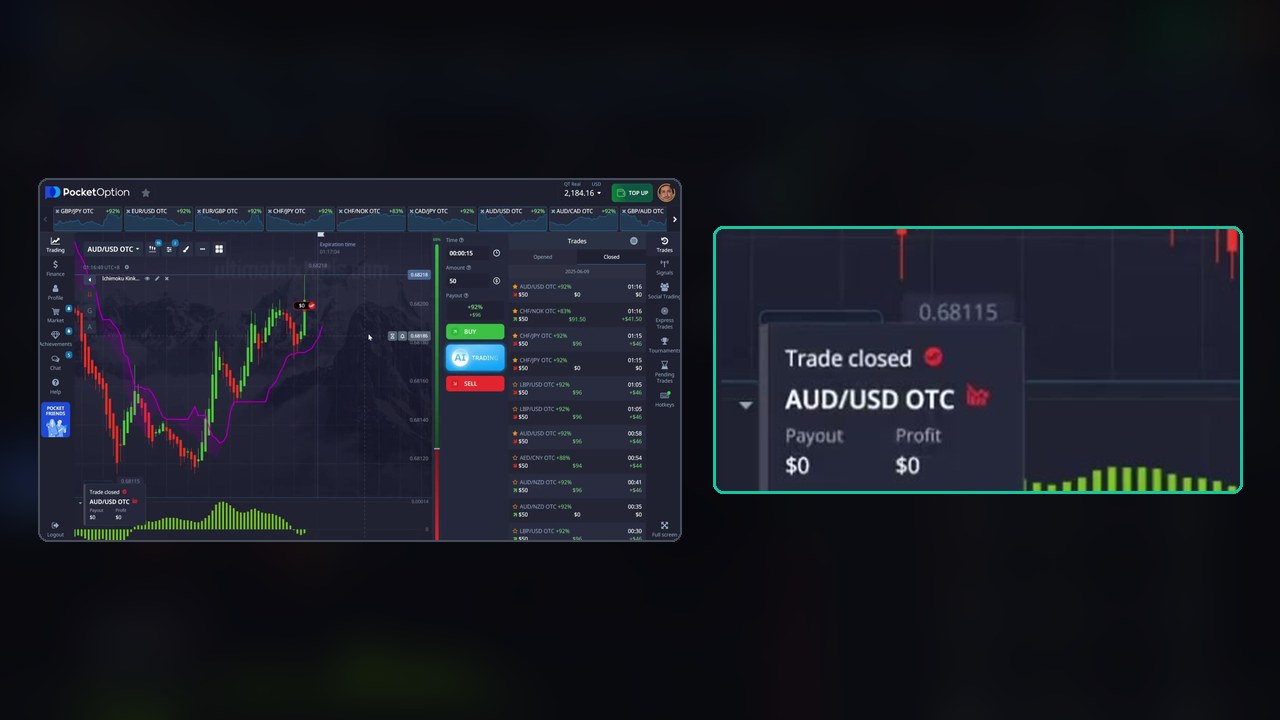
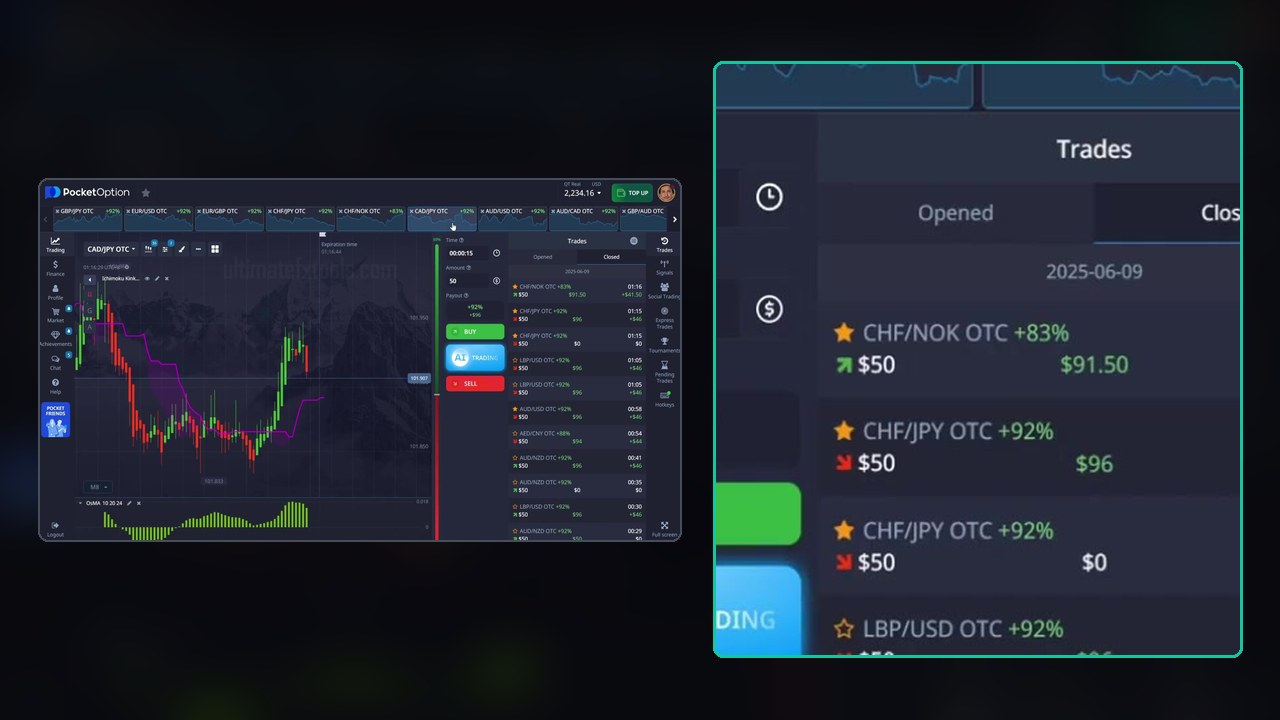
The balance confirms it. The account opens the clip at $2,196.66 and reads $2,276.16 when the narration ends at 3:20 — +$79.50 across those six trades. Every step matches: two $50 stakes that returned nothing, three returns of $96 and one of $91.50. The rest of the video runs without commentary.
What 15 Seconds Actually Demands
At these payouts, break-even is:
- 92% → about 52.1% of trades must win
- 83% → about 54.6%
Four out of six is 67%, which looks comfortable — until you notice that six trades is not a sample. Two more losses in the next six and the same setup sits at 50% and loses money. Nothing in a three-minute demonstration can tell you which of those futures is the real one.
The second thing 15 seconds demands is execution. There is no room to be right slowly: the trade is decided before most people finish checking the chart. That is why the settings mismatch above matters more here than it would on a 5-minute expiry — a histogram that turns two bars late is the whole trade.
The One Decision Worth Copying
After the first loss, the trader says you could double the position, and then deliberately does not — he takes a normal-sized second entry instead, on the grounds that the OsMA still supports the direction. That is the right call and it is worth saying plainly: doubling after a loss does not improve the next trade’s odds, it only increases what that trade costs you. Flat stakes, every time.
Turning It Into Something Testable
- Match the chart, not the text. Set the OsMA to the periods you can see on screen and confirm the timeframe control reads what you intend before the first entry.
- Write the skip rule the video lacks — for example: no entry when the OsMA is already extended (trade 4’s situation), and no entry when price is hugging the Senkou Span B line rather than crossing it cleanly.
- Prefer the 92% pairs. The gap between 83% and 92% is 2.5 percentage points of required accuracy, handed to you for free.
- Flat stake, no doubling — exactly as the video demonstrates.
- Log fifty entries on demo with the cross, the OsMA position and the result. That, not a six-trade clip, is what tells you whether the rule holds.
Watch the Session
Seven minutes — the six narrated entries, both losses, and the re-entry decision:
Honest Weaknesses
- The written settings and the on-screen settings disagree in two places. Anyone copying from the description alone is trading a different setup.
- Six trades is not evidence. A 67% run over six entries is normal noise at any win rate above about 40%.
- No skip rule means the setup fires constantly on a fast chart, and the clip shows only the entries that were taken, never the ones that were passed.
- 15-second expiries punish everything — a late click, a lagging indicator, a spread move. This is the least forgiving timeframe on the platform.
- OTC pairs only. These are the platform’s synthetic weekend series; behaviour there does not transfer automatically to live-market hours.
Risk Management
- Flat stake, decided before the session. The video models this correctly — copy it.
- Set a daily loss limit and a trade cap. At 15 seconds you can take twenty trades in five minutes without noticing.
- Know the break-even for the payout you took: 52.1% at 92%, 54.6% at 83%.
- Demo first, with the settings verified on your own chart, until you have a real sample.
Frequently Asked Questions
What indicator settings does this Pocket Option session use?
Ichimoku Kinko Hyo with Tenkan-sen 7, Kijun-sen 5 and Senkou Span B 16, displaying only the Senkou Span B line at 2px, plus the OsMA. The written setup calls the OsMA “default”, but the chart label in the video reads OsMA 10 20 24 — use what is on the chart.
Is the chart really on 5-second candles?
The narration says to use 5-second Heikin Ashi candles, but the chart’s timeframe control reads M10 during the first trade and M8 afterwards. The video does not resolve the contradiction; the trader only says, after his first loss, to double-check that you are on the 5-second timeframe. Verify it on your own chart before trading.
What were the results in the video?
Six narrated trades: four wins (+$96, +$91.50, +$96, +$96) and two losses ($0 each) on flat $50 entries. The balance moves from $2,196.66 to $2,276.16, a net +$79.50, and the per-trade figures reconcile to that exactly.
Should you double the stake after a loss?
No. The video raises the idea and then declines it, taking a normal-sized second entry instead. Increasing size after a loss does not change the next trade’s odds — it only changes how much that trade costs.
The Verdict
3.5 out of 5. What it gets right: both losses stay in, the re-entry is taken at a normal size with the reasoning stated, the payouts and stake are visible throughout, and the balance reconciles to the cent. The timeframe warning after the first loss is genuinely useful advice.
What holds it back: the chart contradicts the written setup in two places, the rule has no skip condition, and six trades on a 15-second expiry cannot support the confidence the title projects. Treat it as a demonstration of an idea, verify the settings yourself, and let a demo log — not this clip — decide whether the cross is worth trading.
#PocketOption #Ichimoku #OsMA #15SecondTrades #OTC #BinaryOptions #TradingStrategy #RiskManagement
This content is for educational purposes only and is not financial advice. Trading involves substantial risk; you can lose some or all of your capital. No result is guaranteed and past results do not indicate future outcomes. Always practise responsible money management, limit your daily trades, and trade only what you can afford to lose.
Related reading: the Ichimoku + OsMA settings guide has the parameters and entry logic in full, the earlier 15-second write-up covers why the expiry leaves no room to recover, and the strategy library has the rest of the platform.