Why This Two-Indicator Setup Works
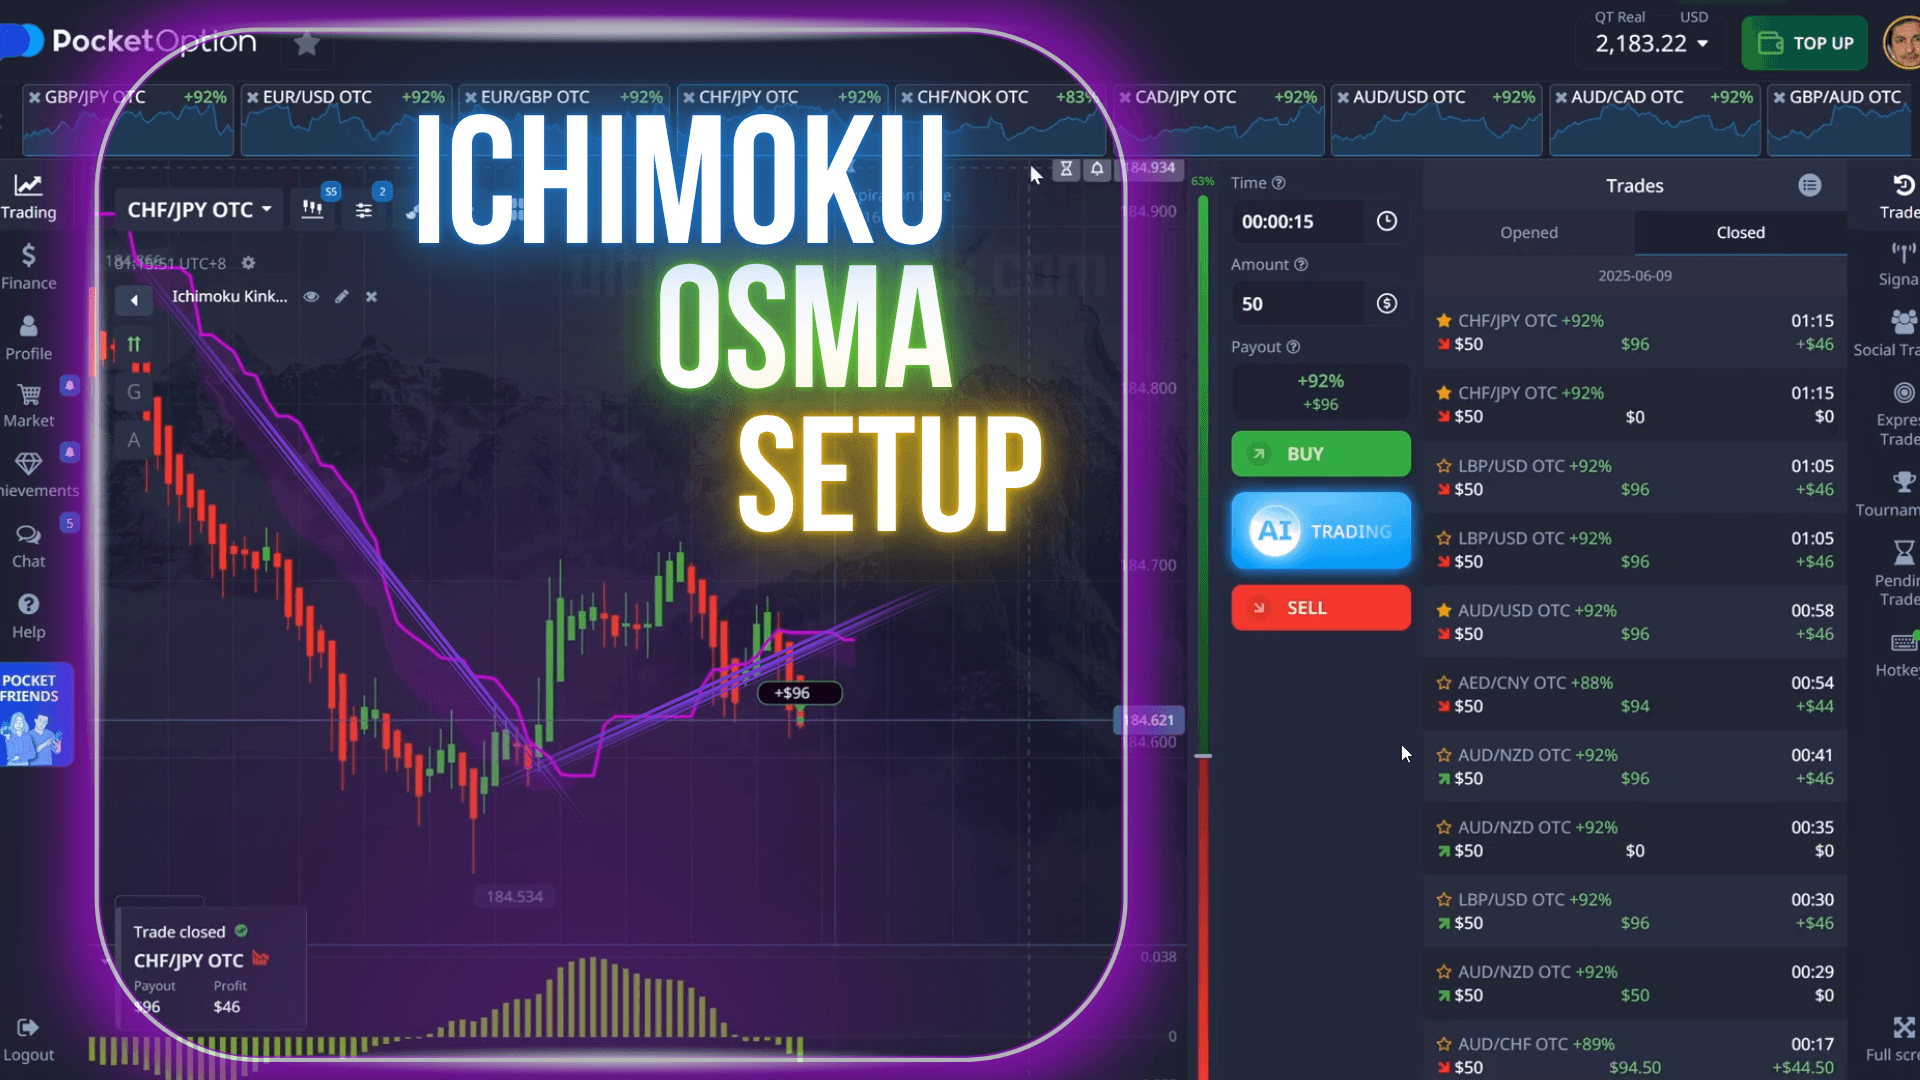
The Ichimoku Kinko Hyo gives you a dynamic price level — specifically the Senkou Span B line — that acts as a real-time trend anchor. When price moves far from that line, it tends to snap back or reverse.
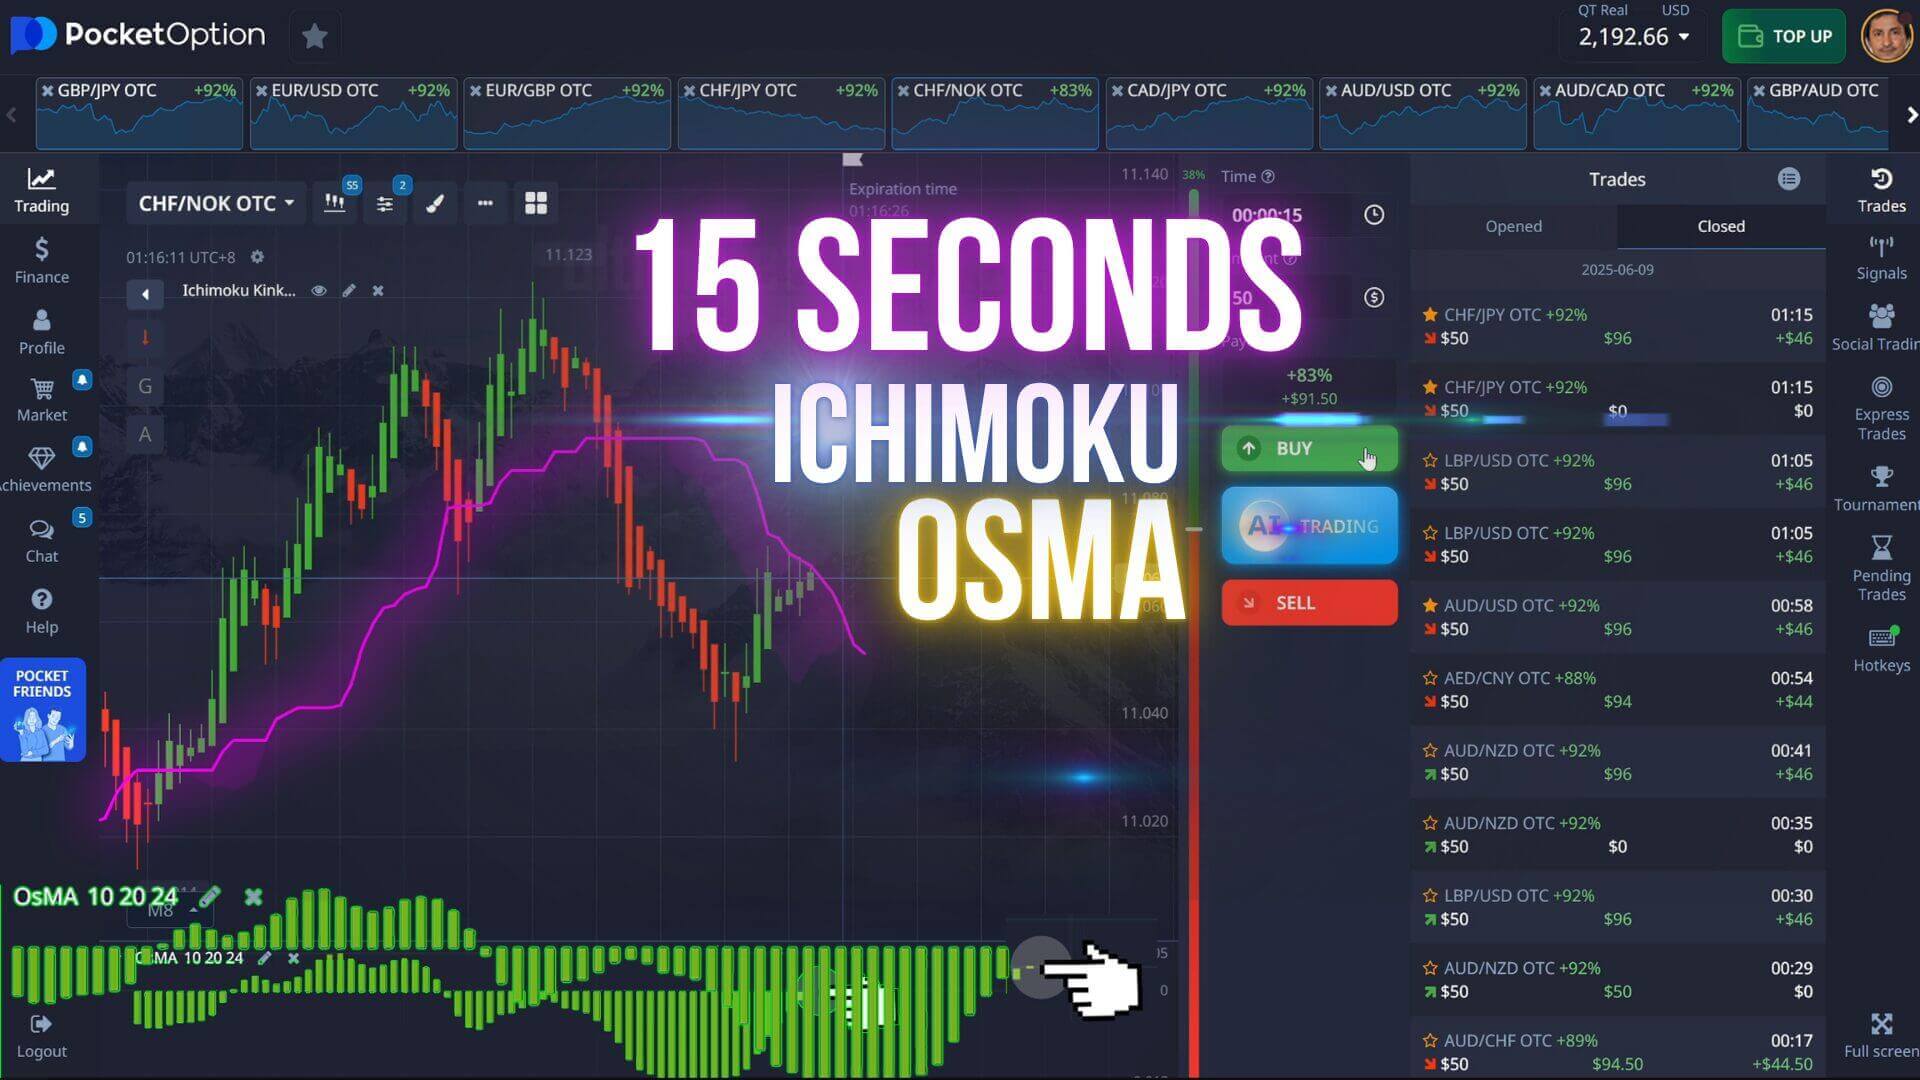
The OsMA (Oscillator of Moving Averages) measures the difference between the MACD and its signal line, giving you a visual read on whether momentum is building or fading. When the histogram moves from the extremes back toward the zero midline, momentum is shifting.
Together: Ichimoku shows WHERE price is relative to trend. OsMA shows WHEN momentum is changing. That combination is all you need.
Indicator Settings
These are the exact settings to apply in Pocket Option's built-in indicator panel. Use the custom Ichimoku values below — do not leave them on default.
Ichimoku Kinko Hyo
In the Ichimoku style settings, turn off all lines except Senkou Span B. Set Senkou Span B to 2px. This keeps the chart clean — only the key dynamic level is visible.
OsMA
Chart & Execution
How to Read the Entry Signal
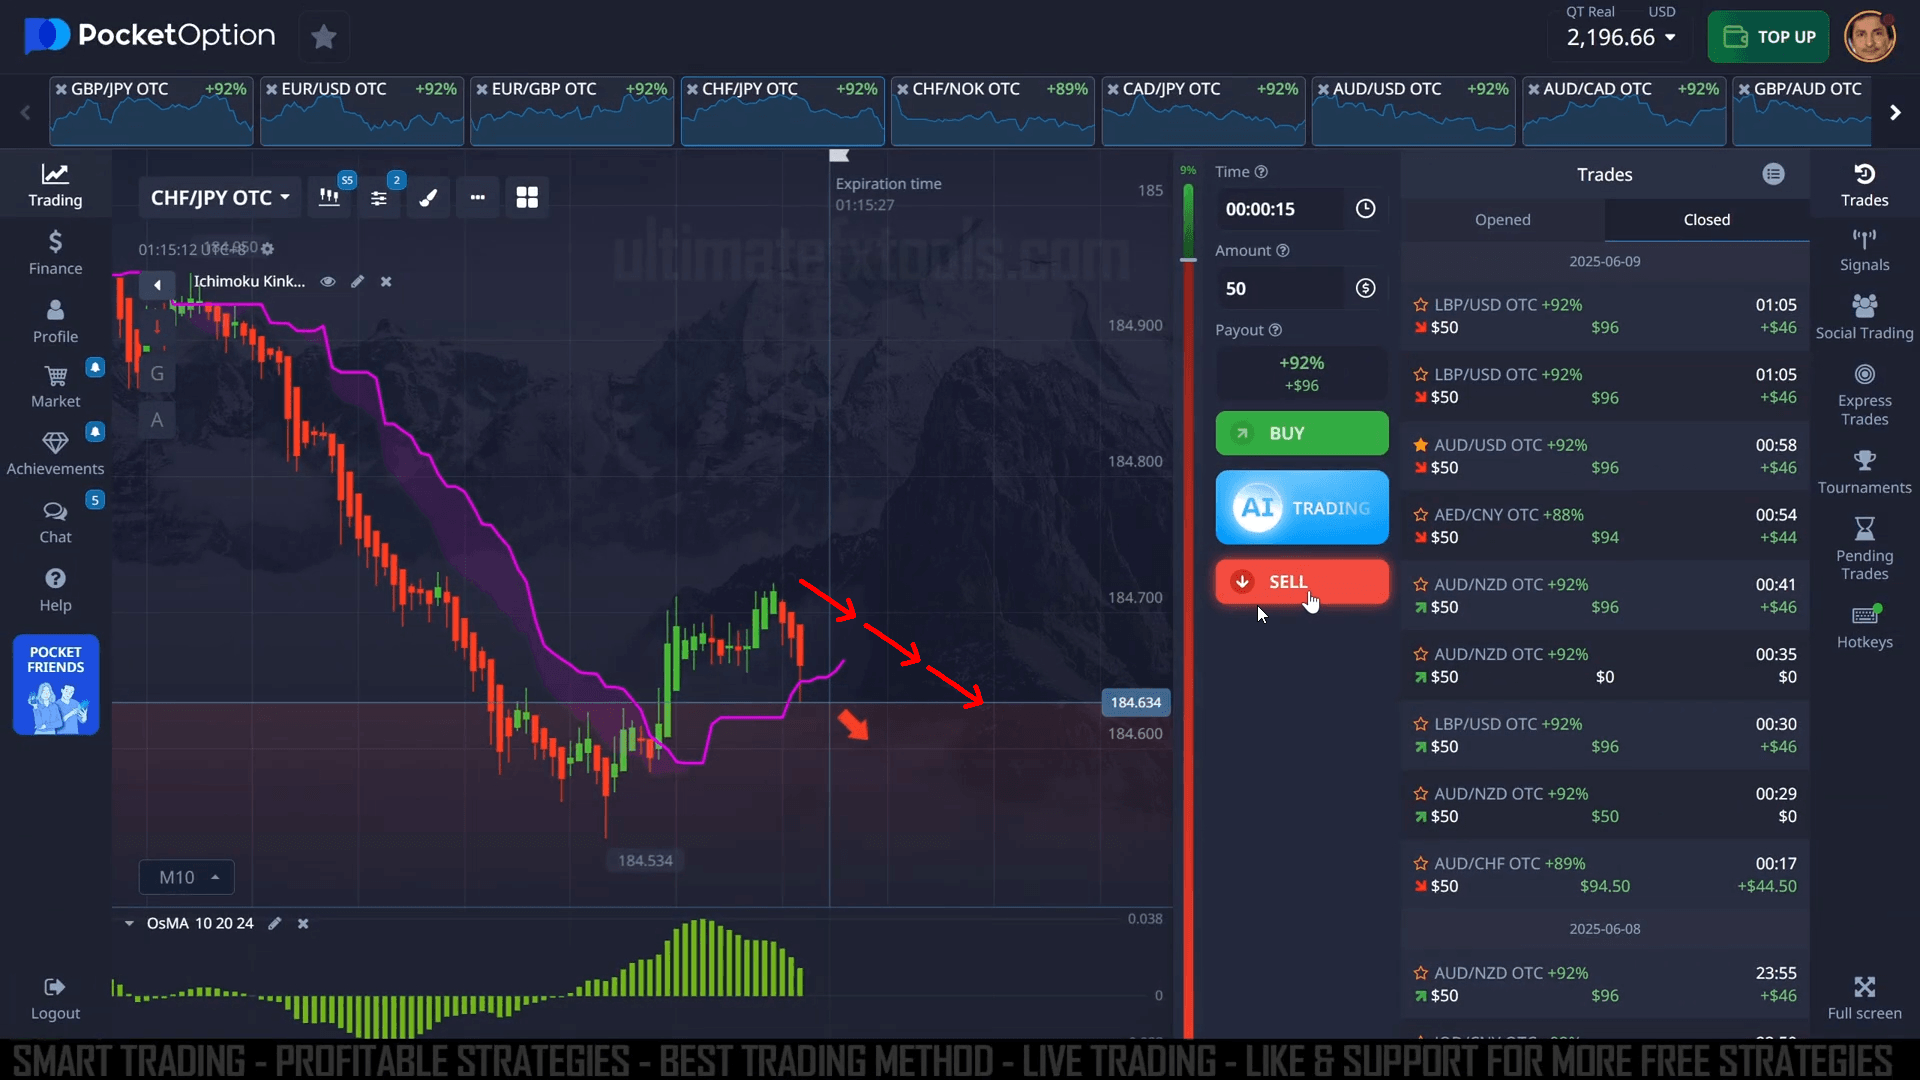
There are two valid signal types. Both require the OsMA histogram to be recovering from its extreme — not at the peak of its move, but already pulling back toward the zero midline.
- Price has pushed far below the Ichimoku Senkou Span B line
- OsMA histogram was deep in negative territory and is now pulling back toward the zero midline
- Look for small consolidation candles forming — selling pressure is exhausting
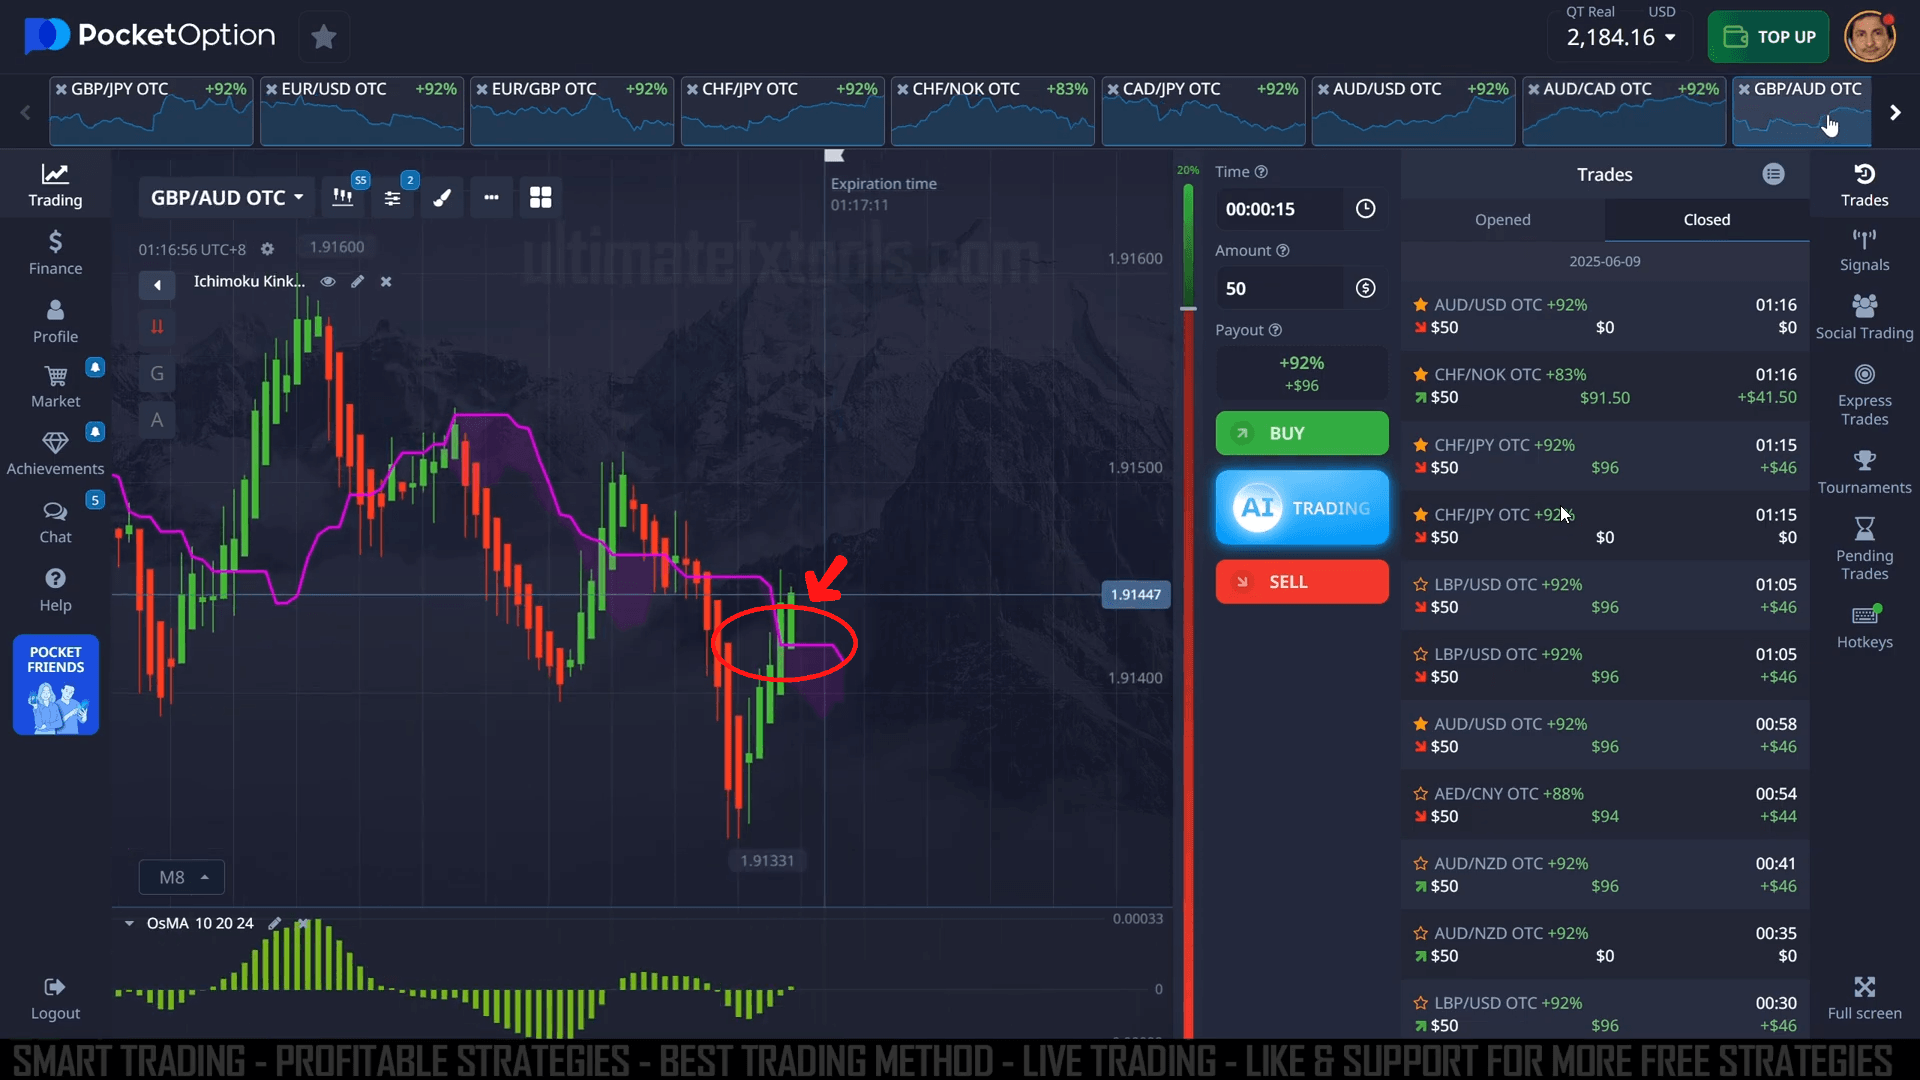
- Price has pulled far above the Senkou Span B line and is now touching back down to it
- OsMA histogram is recovering from its lower range back toward the midline
- Momentum is shifting upward
You are not trading the full reversal. You are trading the final push or the snap-back leg — the short move that resolves before the bigger reversal completes. That is why 15-second expiry works well here.
Step-by-Step Trade Execution
-
01Open the M10 Chart
Set your analysis chart to the 10-minute timeframe on your chosen OTC pair inside Pocket Option.
-
02Add Both Indicators
Apply Ichimoku Kinko Hyo on default settings and OsMA with parameters 10, 20, 24. Both go on the same M10 chart.
-
03Wait for Price to Stretch
Watch for price to move significantly away from the Kijun-sen purple line. Do not enter while price is sitting near that line — the setup requires clear distance.
-
04Confirm OsMA Direction
Check the OsMA histogram — it must be moving back toward the zero midline. A histogram that is still extending to new extremes is not a valid entry.
-
05Switch to 5-Second Heiken Ashi
Move to the 5-second Heiken Ashi chart for your actual execution. Read the last 2–3 candles for real-time momentum confirmation.
-
06Place Your Trade
Select 15-second expiry and enter in the direction of the signal. Do not close early — let it run to expiry.
-
07Log the Outcome
Record every trade result. Your session results across 20+ trades give you a real read on how this setup performs for your execution style.
Pairs This Works Best On
This setup performs consistently on OTC pairs. OTC pairs are available around the clock, which makes this method accessible regardless of your timezone. Focus on pairs with clean, smooth price action:
- CHF/JPY OTC
- CHF/NOK OTC
- GBP/AUD OTC
- EUR/USD OTC
- AUD/USD OTC
Start with one pair and build familiarity with how it responds to Kijun-sen distance before adding more pairs to your watchlist.
Honest Notes on Losses
No setup closes green on every single trade. This method works well across a session — but individual losses will happen and that is normal. The goal is consistency across a series of trades, not perfection on every single entry.
Apply disciplined stake sizing and never trade more than you are comfortable losing on any single trade. Fixed position sizing is what keeps a single loss from becoming a session-ending event.
Final Thoughts
The Ichimoku + OsMA combination is one of the cleanest two-indicator setups available on Pocket Option. It removes noise, gives you a clear dynamic level, and tells you when momentum is confirming your read. Pair it with the 5-second Heiken Ashi for execution and you have a complete, repeatable method.
Study the signals. Practice identifying them before trading live. Explore our full library of trading indicators to add more tools to your analysis workflow.
Watch the Full Strategy Walkthrough
See the setup in action — live chart, indicator configuration, and real entries on Pocket Option OTC pairs.
Explore Our Indicator Packages
Get access to 100+ professional indicators, strategies, and tools — all compatible with MT4, MT5, and your favorite trading platforms.
This content is for educational purposes only. Trading involves significant risk and past results do not indicate future performance. Never trade with money you cannot afford to lose. Always conduct your own research before making any trading decisions.