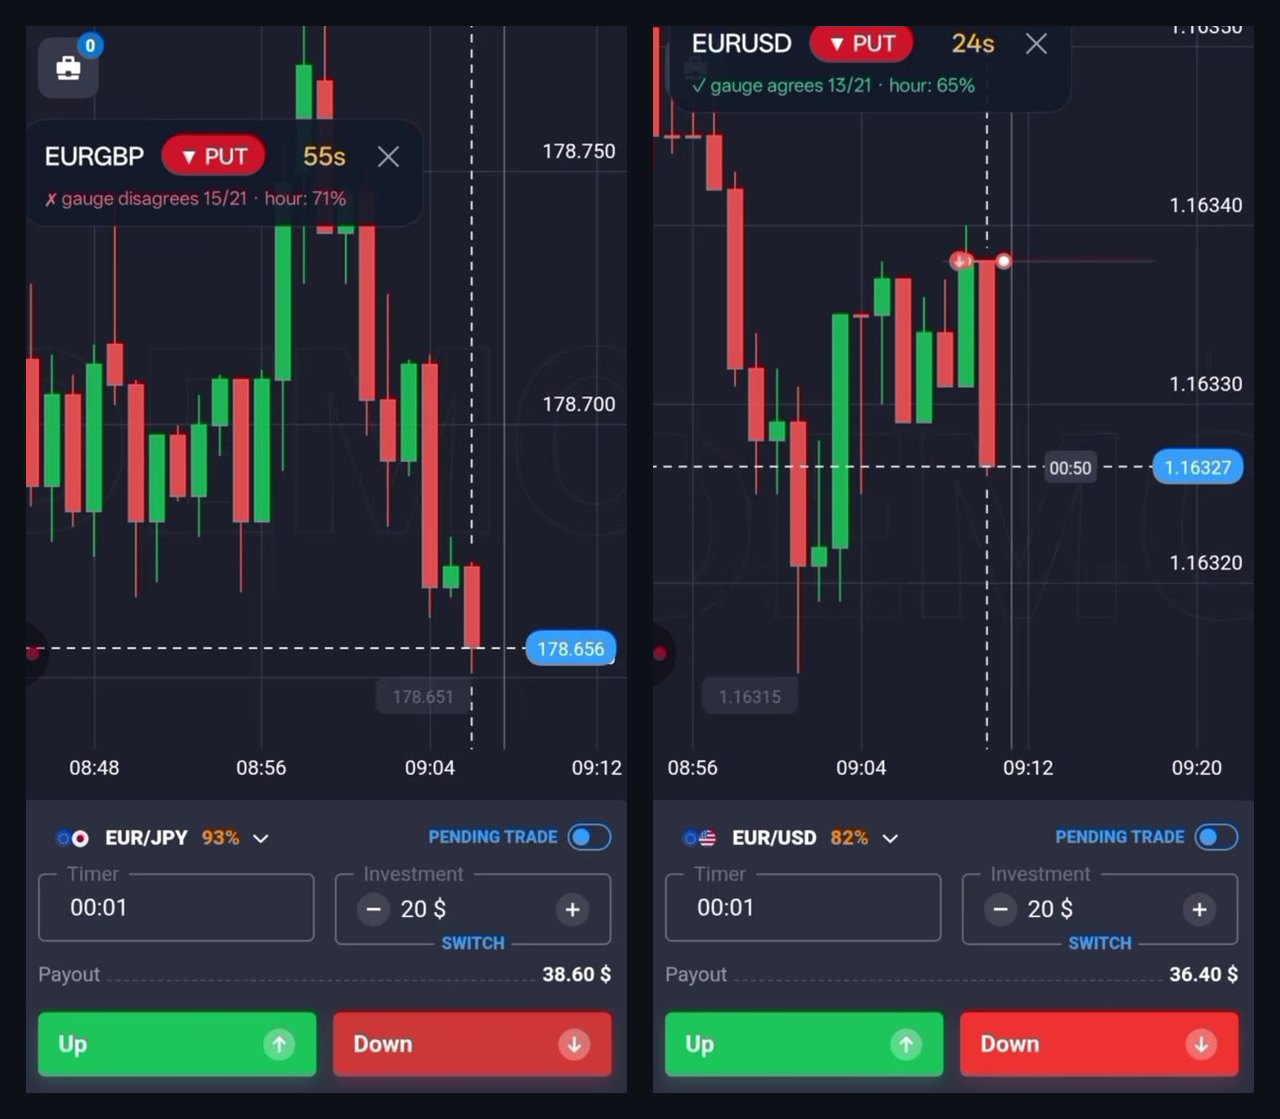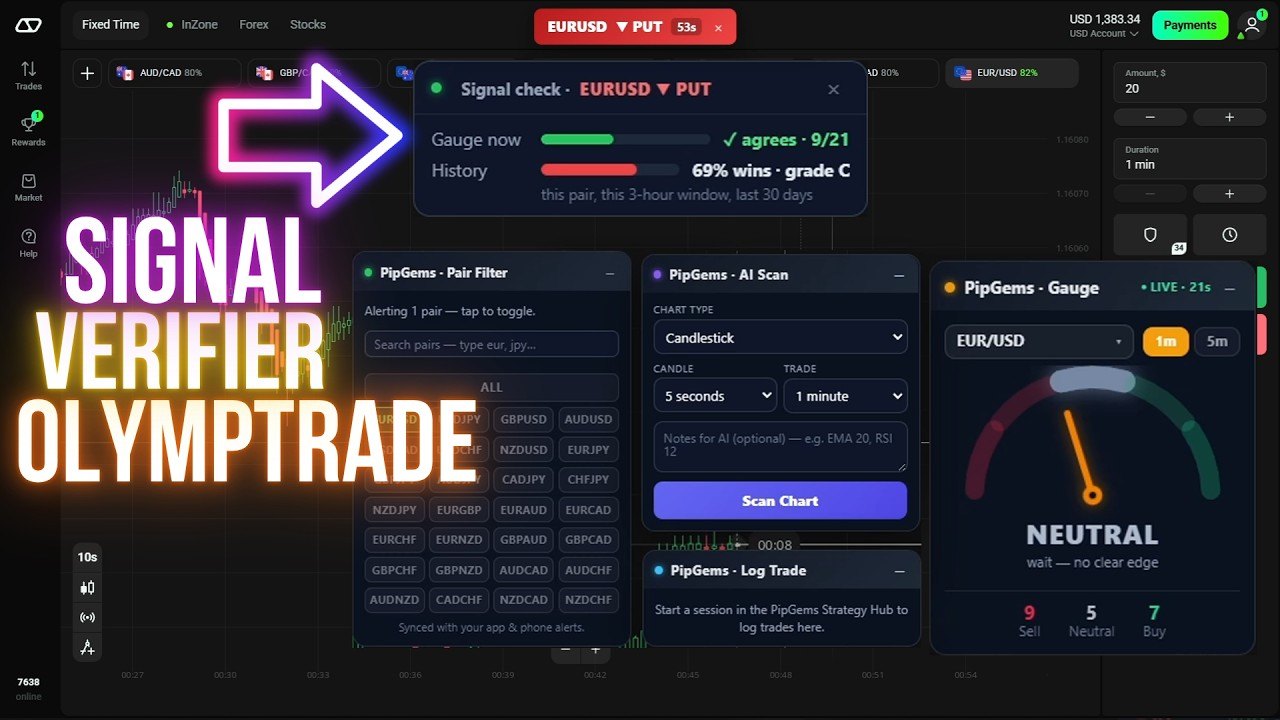
A signal arrives. Before you tap anything, a small card tells you how that exact signal, on that exact pair, at roughly this time of day, has actually performed over the last month — as a percentage and a letter grade.
Then the session does the most useful thing it could possibly do: the A+ loses and the C wins.
The two cards

| Signal | Gauge | History | Result |
|---|---|---|---|
| EUR/USD ▼ PUT | ✓ agrees 9/21 | 69% wins · grade C | Won |
| EUR/CAD ▲ CALL | ✗ disagrees 1/21 | 83% wins · grade A+ | Lost |
If you take one thing from this page, take that table. The better-graded signal lost. The worse-graded signal won. Nothing went wrong.
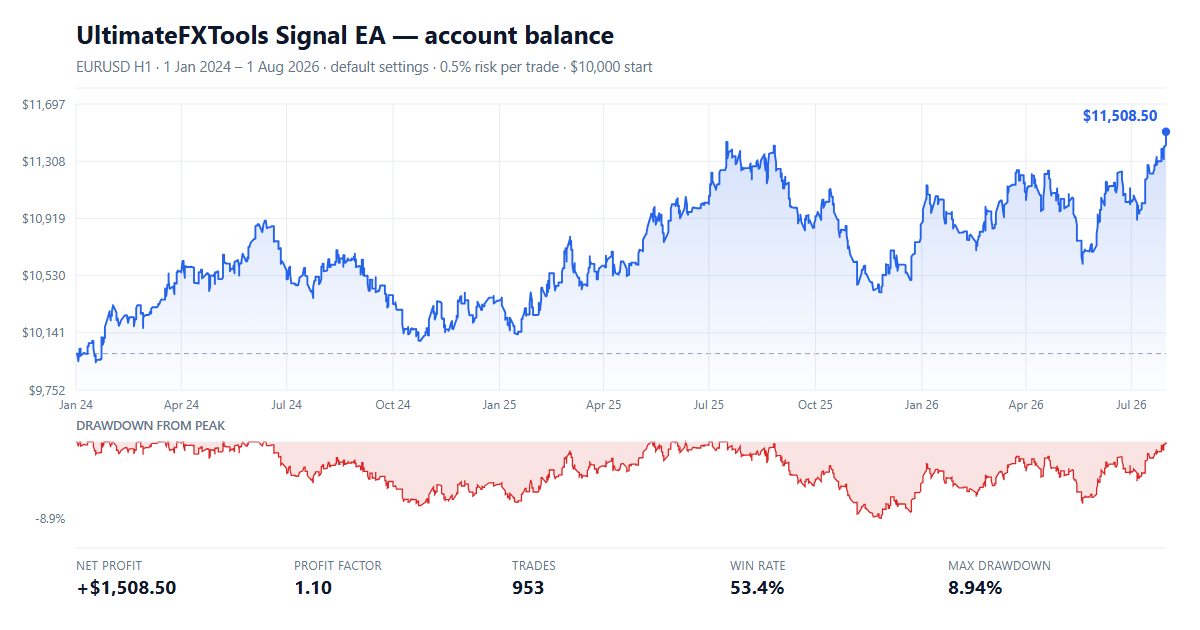
A grade is a record of what happened before. It is not a forecast of what happens next. An 83% historical win rate means roughly one in six of those signals lost — and one of them has to be the one you are looking at. If a tool showing 83% never lost, the 83% would be a lie.
What the card is actually counting
The line that matters most is the one set in the smallest type: "this pair, this 3-hour window, last 30 days."
That is the card naming its own scope, unprompted, and it deserves credit. It is not "83% of all signals ever". It is 83% of EUR/CAD call signals, in this three-hour block of the day, over the past month. Change any one of those and the number changes.
We criticised an earlier version of this figure for appearing without any scope at all. This is the fix, and it is the right one.
The 40-signal floor
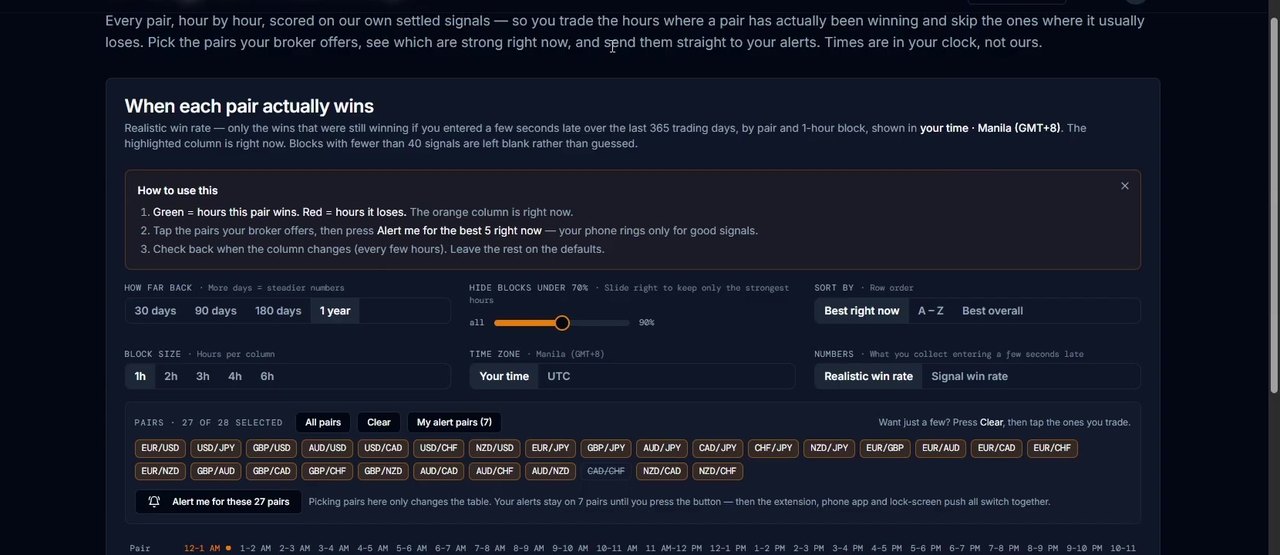
The card does not print how many past signals sit behind its percentage. The heatmap page it comes from states the rule instead, and it is the single most reassuring sentence in the product:
"Blocks with fewer than 40 signals are left blank rather than guessed."
That is a real statistical floor. A tool willing to show you an empty cell is a tool that is not inventing numbers to fill space. Most of this category does the opposite.
The same page separates two things that are usually blurred together:
- Signal win rate — the signal would have won at the instant it fired.
- Realistic win rate — only the wins that were still winning if you entered a few seconds late. This is the default, and it is the lower of the two.
That distinction is the gap between a backtest and a human with a phone. Showing the pessimistic number by default is the correct choice, and an unusual one.
The pair filter, and why 80% matters
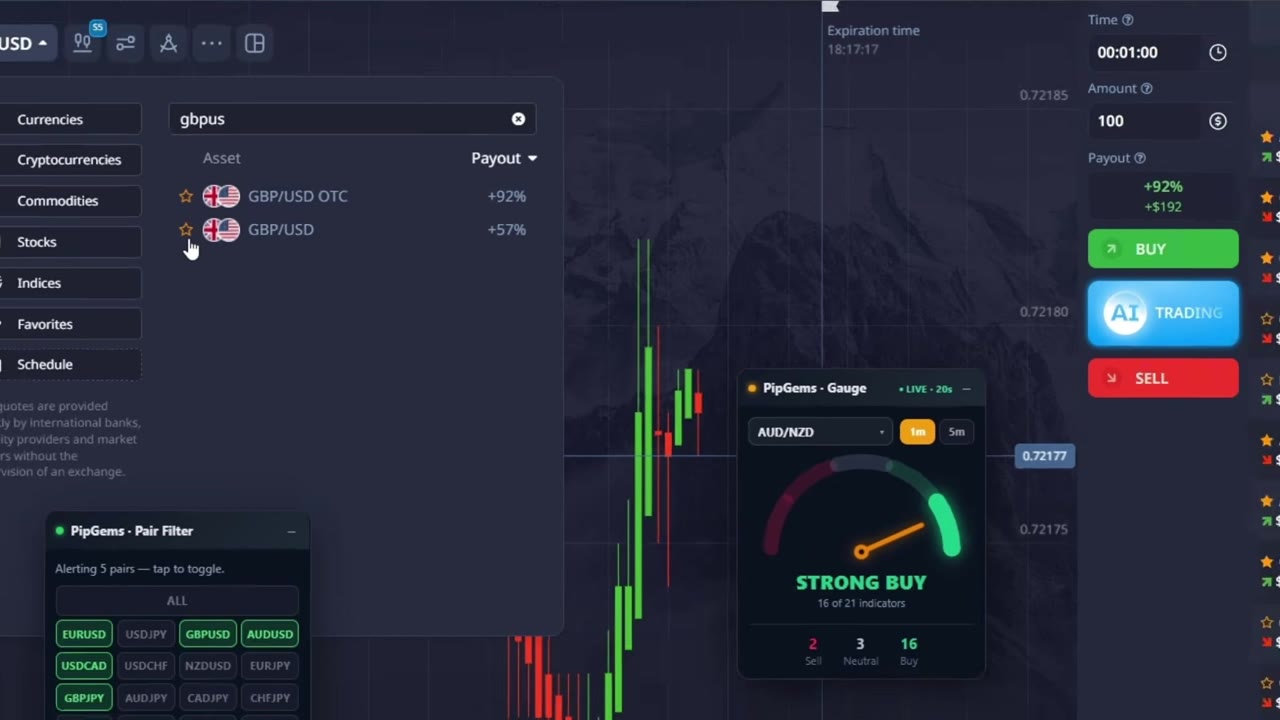
The session runs non-OTC pairs paying 80% and up, added to the PipGems pair filter as they become available, so alerts only arrive for assets worth trading. The open tabs read 80%, 80%, 80%, 82%.
At an 80% payout you need to be right 55.6% of the time simply to break even. At 82% it is 54.9%. Set against a card offering 69% or 83% historical, that sounds comfortable — which is exactly why the losing A+ trade is the useful part of this video. We worked through this arithmetic in full in the payout filter post.
The honest note about the gauge
Stated plainly on camera: the gauge "works better for 5 minute to 1 hour trading. I can't really recommend it for 1 minute."
That is our own app being talked down in our own video, and it is correct. The gauge reads 21 indicators across recent price action; on a 60-second expiry the trade is settled before most of those readings have said anything. On this session it stays open as a reference, not a filter — which is the right way to use a tool you have just admitted is out of its range.
It also resolves something we flagged in the heatmap post, where a trade was taken against a disagreeing gauge. The answer is not to override the gauge case by case. It is to decide in advance which timeframes it governs — and on 1-minute trades, this session says it does not govern them at all.
How we would use the grade
- As a filter, not a licence. Skip the low grades. Do not size up on the high ones.
- Treat a blank as information. An empty cell means fewer than 40 settled signals. That is the tool declining to guess, and you should decline too.
- Read the scope line every time. The 3-hour window moves. A grade earned at one time of day says nothing about another.
- Keep the payout floor. 80% and up is the session's rule, and it does more for your account than any grade does.
- Flat stake. $20 every trade here, which is the only reason a losing A+ costs no more than a losing C.
Why 4 and not 5
The verifier is the best thing we have shipped in this category. It names its own scope on every card, it refuses to show a figure built on fewer than 40 signals, it defaults to the pessimistic slippage-adjusted number, and this session publishes a losing A+ instead of quietly cutting it.
What keeps it from a 5 is that the card still does not print n. The floor is 40, but 40 and 400 read identically, and the difference between them is large. Putting the count on the card would cost one line and settle it. Beyond that, this is two trades on one session — a demonstration of a workflow, not evidence about it.
The session
PipGems is our own app, so read this as our tool in our video — criticism included. Historical win rates and grades describe past settled signals; they do not predict individual trades. Trading carries substantial risk and you can lose your capital. Nothing here guarantees a result. Practise on a demo account first.