What "Advance Chart Scanning" Actually Means Here
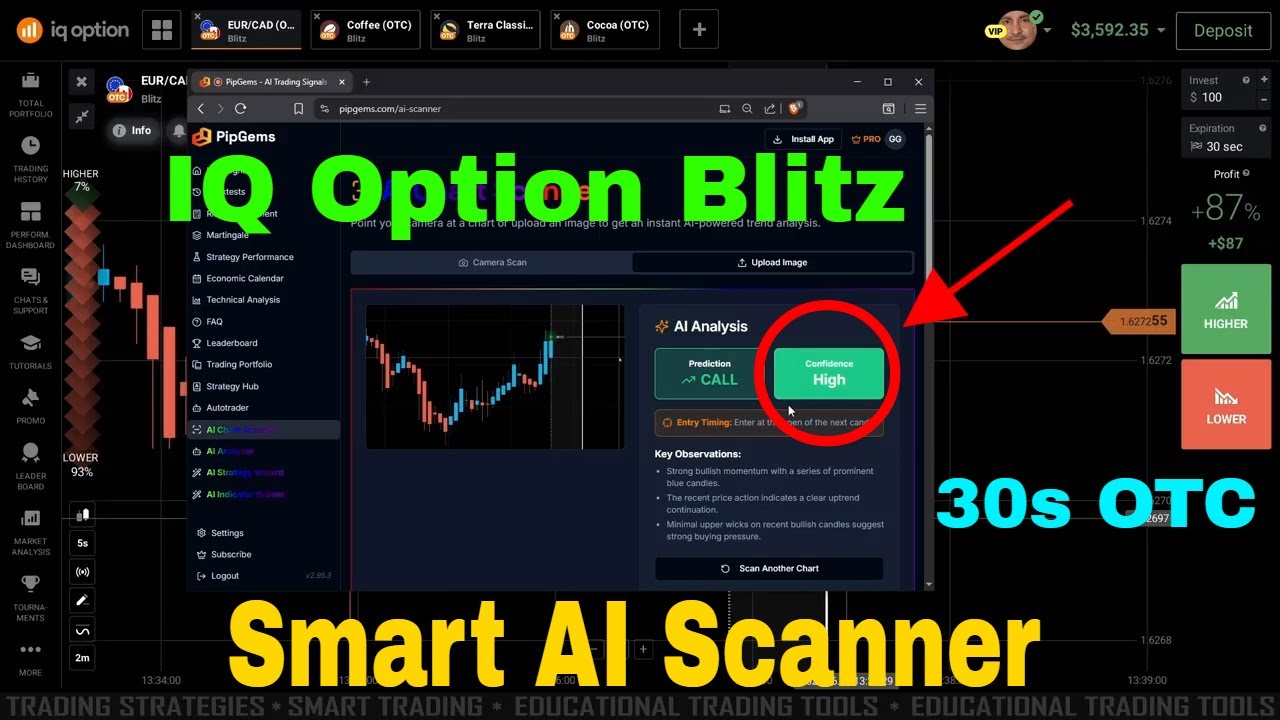
There is no secret indicator in this session. The idea is a workflow change: rather than watching five OTC tabs and trying to judge each one live, you capture the chart as an image, hand that image to the PipGems AI chart scanner, and read back what it says about the picture — direction, a confidence level, and the observations it used to get there.
That sounds like a small difference. In practice it changes two things that matter on a 10-second chart. First, it forces a pause between seeing a chart and clicking on it — the screenshot-and-upload step is a built-in cooling-off period. Second, it gives you something to skip on. When the scanner comes back with low confidence, you have a written reason to leave that chart alone and go look at another one, which is a lot easier than talking yourself out of a trade unaided.
The Chart Setup on IQ Option Blitz
- Platform: IQ Option — Blitz mode
- Chart type: Heiken Ashi (not standard candles)
- Candle timeframe: 10 seconds
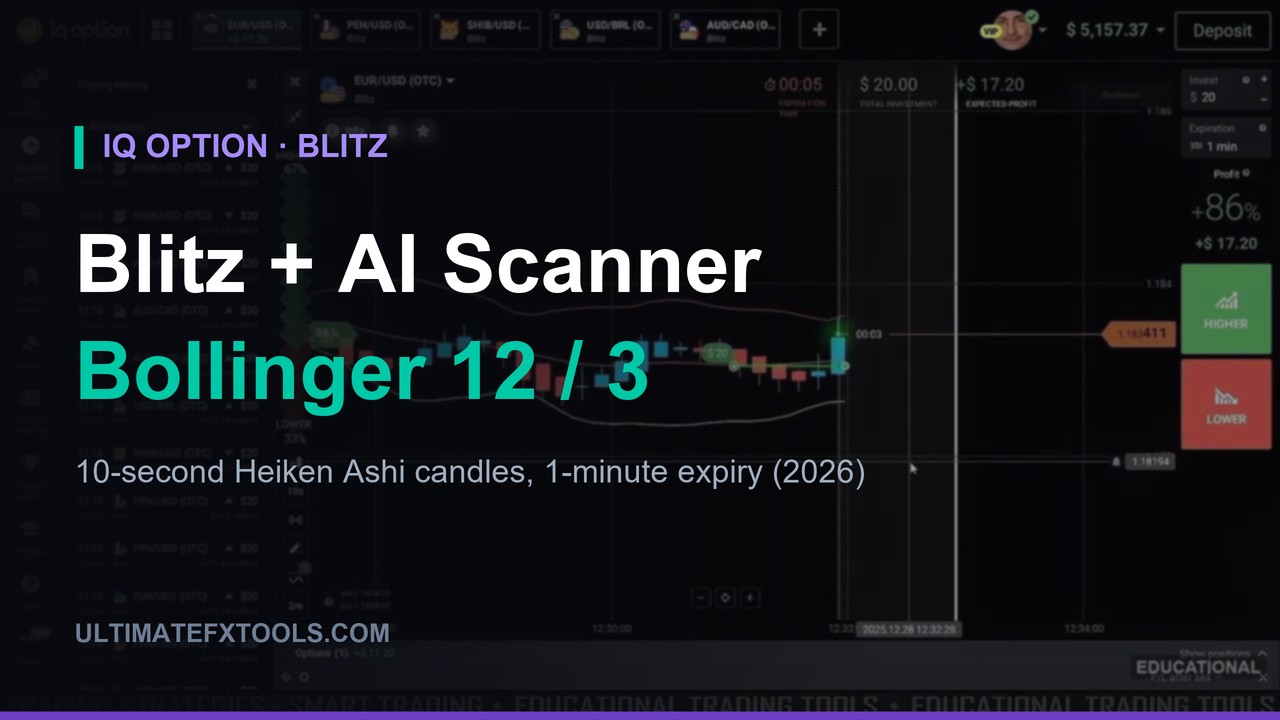
- Indicator: Bollinger Bands — period 12, deviation 3. Nothing else on the chart.
- Trade duration: 1 minute expiry — roughly six candles of room
- Stake: flat $20 on every entry, start to finish
- Assets: OTC pairs — SHIB/USD, PEN/USD, EUR/USD, USD/BRL, AUD/CAD at 86–88% payouts
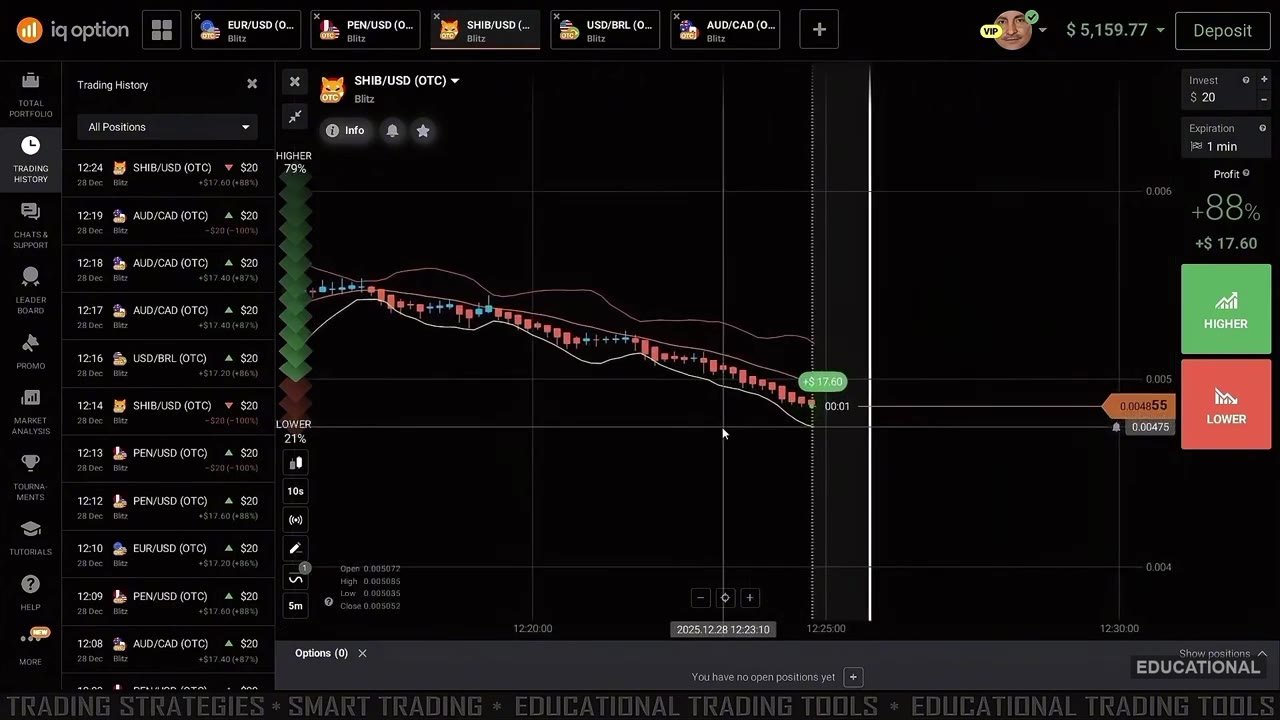
Deviation 3 is the choice worth noticing. A standard Bollinger setting is 2, which on 10-second Heiken Ashi candles gets touched constantly — every minor push tags a band and every tag looks like a signal. Widening to 3 means price only reaches a band when the move is genuinely stretched for that chart, so there are far fewer "edge touches" to react to. Combined with Heiken Ashi's smoothing, the picture the scanner receives is a clean one: a rolling mid-line, two wide rails, and colour-blocked candles.
The Scan Workflow, Step by Step
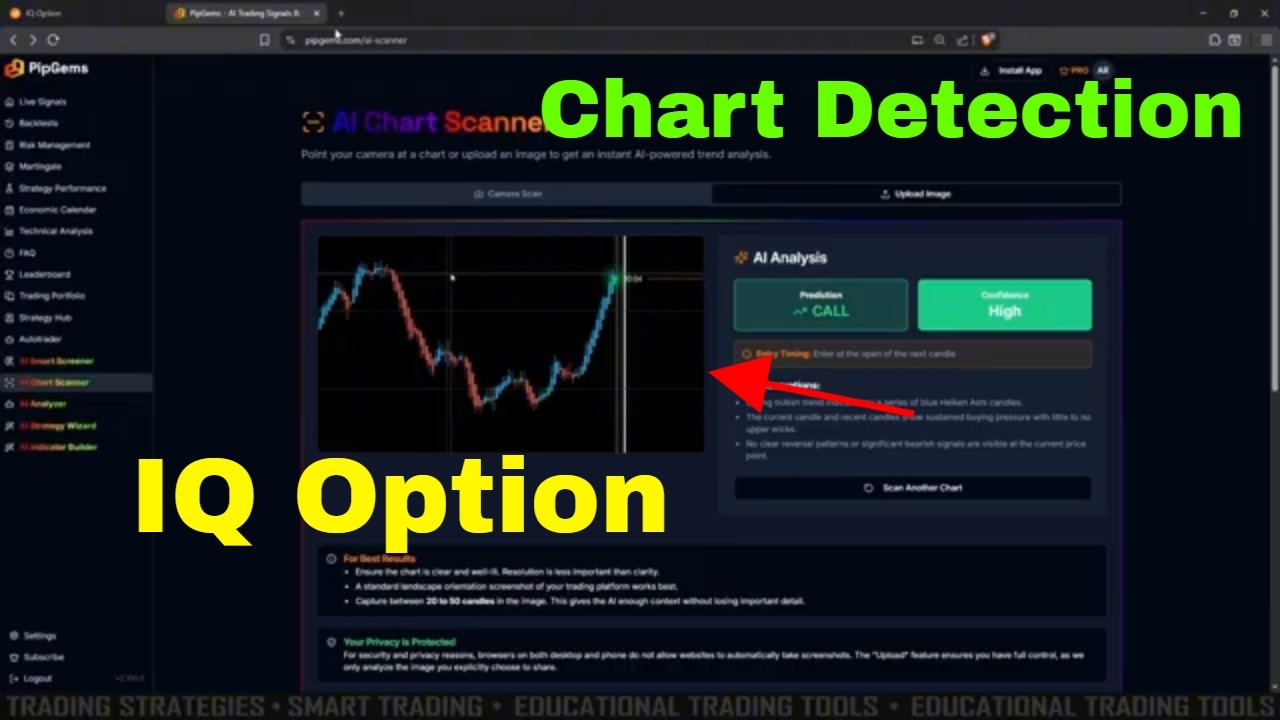
- Capture the chart with the screen snip tool — a plain landscape screenshot of the trading platform.
- Upload the image to the AI scanner and let it analyse what is on the chart.
- Read the verdict: a CALL or PUT prediction, a confidence level, and the key observations behind it.
- Act only on medium or high confidence. If it comes back low, skip that chart and scan another one.
- Enter at the open of the next candle with the same fixed stake, 1-minute expiry.
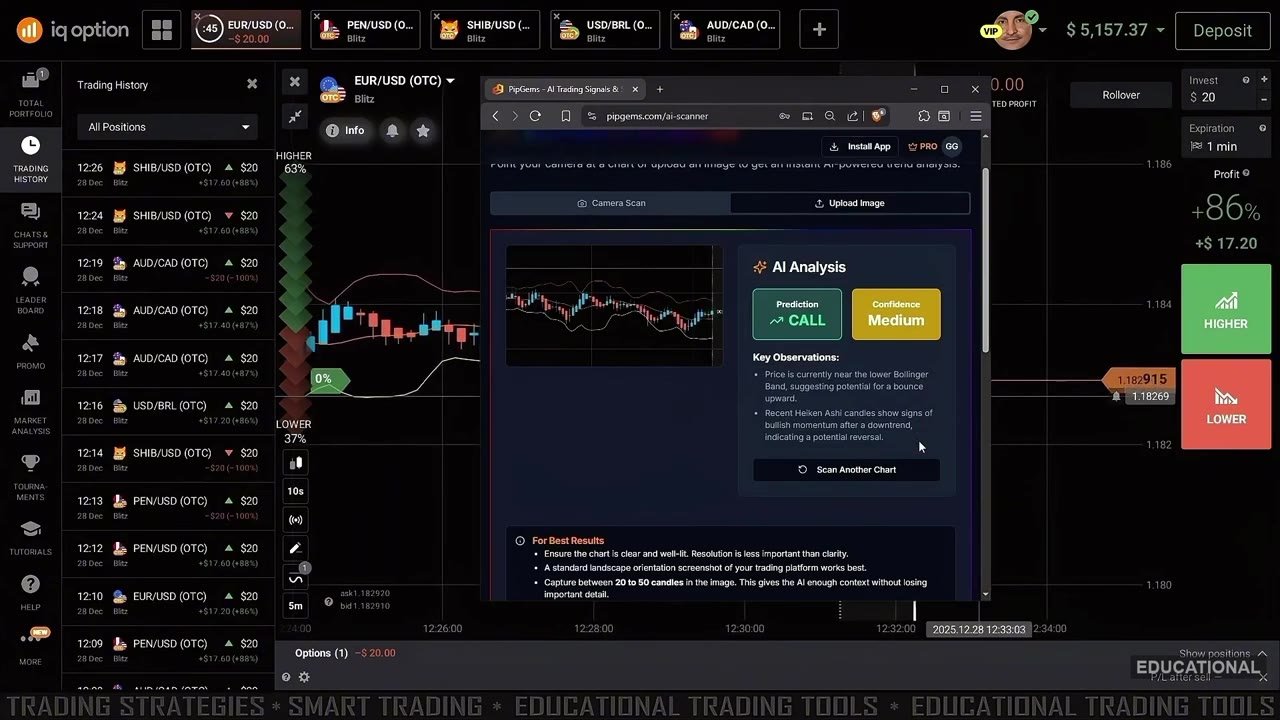
This is the reading itself. The scanner returns CALL with Medium confidence, and — more useful than the arrow — it says why: price is sitting near the lower Bollinger Band, suggesting a potential bounce, and the recent Heiken Ashi candles are showing signs of bullish momentum after the downtrend. On the earlier SHIB/USD scan the same panel came back the other way: predominantly red Heiken Ashi candles with price broken below the middle band, so it expected that move to continue.
Read those observations rather than the badge. If the reason it gives does not match what you can see on your own chart, that mismatch is information — usually it means the screenshot did not carry enough candles, or you scanned a chart in the middle of a violent spike.
Make the Configuration Match the Chart
This is the part most people get wrong, and it quietly ruins the reading. The scanner's settings have to describe the same chart you screenshotted:
- Chart type: Heiken Ashi
- Candle timeframe: 10 seconds
- Target trade duration: 1 minute
- Notes field: tell it you are using Bollinger Bands, period 12, deviation 3
Without those, the AI is reading a picture with no idea whether one candle is ten seconds or one hour — and a "bounce" over six candles means something completely different in each case.
Which Charts to Scan
The session does not scan every pair on the list. The pick is a chart with a smooth flow first: clean candles, no violent spikes, an obvious rhythm. That is the kind of picture an image-based reader handles best, and it is the same quality filter a human would apply. Roughly 20 to 50 candles in frame gives enough context without shrinking the detail.
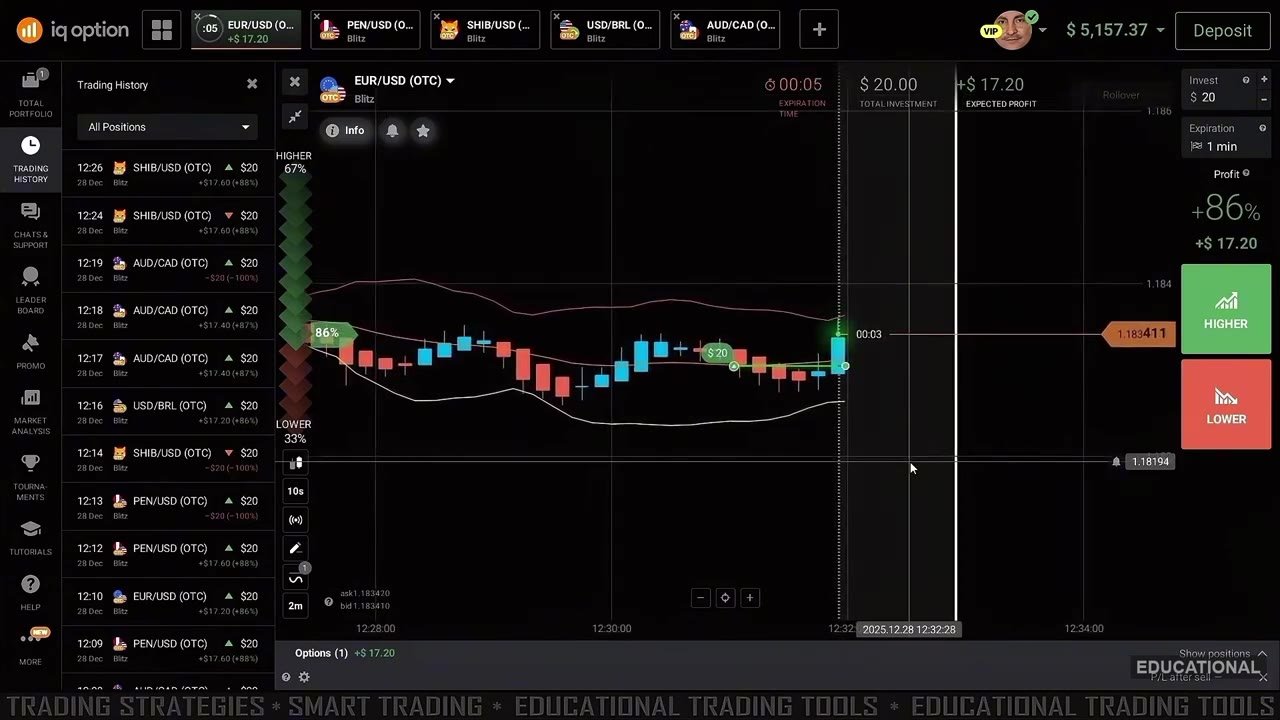
The EUR/USD entry above is the CALL from that reading, taken at the open of the next candle: $20 in, 86% payout, one minute on the clock. Nothing was adjusted mid-trade — the expiry does the deciding.
Watch the Full Session
Every scan, every entry and every result, including the one that lost:
The Payout Maths Before You Judge It
With a fixed-time trade, a win returns your stake plus the payout while a loss costs the whole stake — so break-even sits well above 50%. At the 88% payout on these OTC pairs you need to be right 53.2% of the time just to stay level. At 86% it is 53.8%, and if you drift onto a 75% pair it jumps to 57.1%.
That is the bar any scanner has to clear. Five green out of six in one session is not that bar — it is six samples. What the maths tells you is where to aim: prefer the higher-payout chart when two setups look equally clean, and treat any run of results shorter than a few dozen trades as noise in both directions.
The Entry That Lost — And Why It Is In the Video
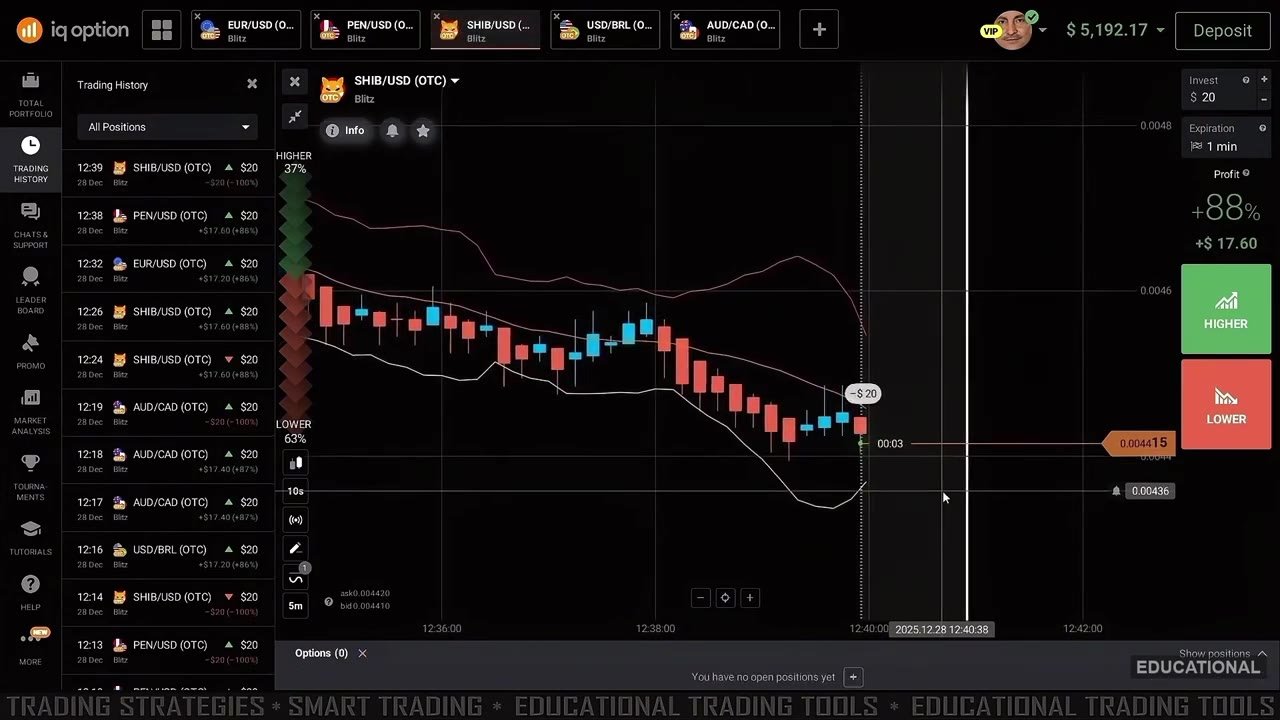
Back on SHIB/USD, the sixth entry took the upside and closed red — $20 gone. It stayed in the video for a reason: a scanner that reads charts is reading probabilities, not certainties. The response was the important part — no doubling, no chasing it back, the same $20 on the next one, and a wait for the next chart that read clean.
Keeping the stake identical after a loss is the single habit that separates a survivable session from a blown one. It is also the habit that gets skipped first, because after a red trade the recovery maths feels so easy.
Honest Weaknesses
- It reads a snapshot, not a live feed. Between the screenshot and the entry, several 10-second candles can pass. On a 1-minute expiry that lag is a real cost.
- Garbage in, garbage out. A blurry crop, too few candles, or a mismatched timeframe note produces a confident-looking reading of something you did not actually trade.
- Bollinger touches are context, not signals. In a strong trend price rides the outer band for many candles — "near the lower band" can mean a bounce or a continuation, and the scanner is guessing between them too.
- Heiken Ashi hides the real price. The candles you are reading are averaged. Your entry and your expiry settle on actual price, which can be some distance from the smoothed body you looked at.
- OTC pricing is platform-generated. All six entries were on OTC pairs. Behaviour there does not transfer one-for-one to live-market sessions.
- Six trades prove nothing. Any sequence this short can look excellent or terrible by chance alone.
Risk Management Rules
- Keep every entry the same size — the whole session used a flat $20. Never raise it to recover a loss.
- Only act on medium or high confidence. Low confidence means scan a different chart, not a smaller stake.
- Limit how many trades you take per session and set a hard daily loss cap before you start.
- Skip charts with violent spikes — if you cannot read the flow yourself, neither can the scanner.
- Trade only what you can afford to lose, and run the whole routine on a demo balance until the workflow is automatic.
The Verdict
A solid 4 out of 5. What earns it: the chart is genuinely minimal, the confidence rule gives you a concrete reason to skip marginal charts, the stake never moves, and the session is honest enough to leave the losing entry on screen. The written observations are the real value — they force you to compare the AI's reasoning with your own chart instead of blindly following an arrow.
The missing star is the snapshot problem. You are trading a 1-minute expiry off a still image that is already a few candles old by the time you click, and a wide Bollinger touch is genuinely ambiguous — bounce or continuation, nobody knows in advance. Use it as a second opinion on charts you already like, keep the size flat, respect the break-even maths, and it is a disciplined routine. Use it as an oracle and the snapshot lag will collect its fee.
#IQOption #IQOptionBlitz #AIChartScanner #BollingerBands #HeikenAshi #PipGems #BinaryOptions #OTCTrading #TradingStrategy #TechnicalAnalysis
This content is for educational purposes only and is not financial advice. Trading involves substantial risk; you can lose some or all of your capital. Past results do not guarantee future outcomes. Limit your daily trades, practise responsible money management, and trade only what you can afford to lose — test everything on a demo account first.