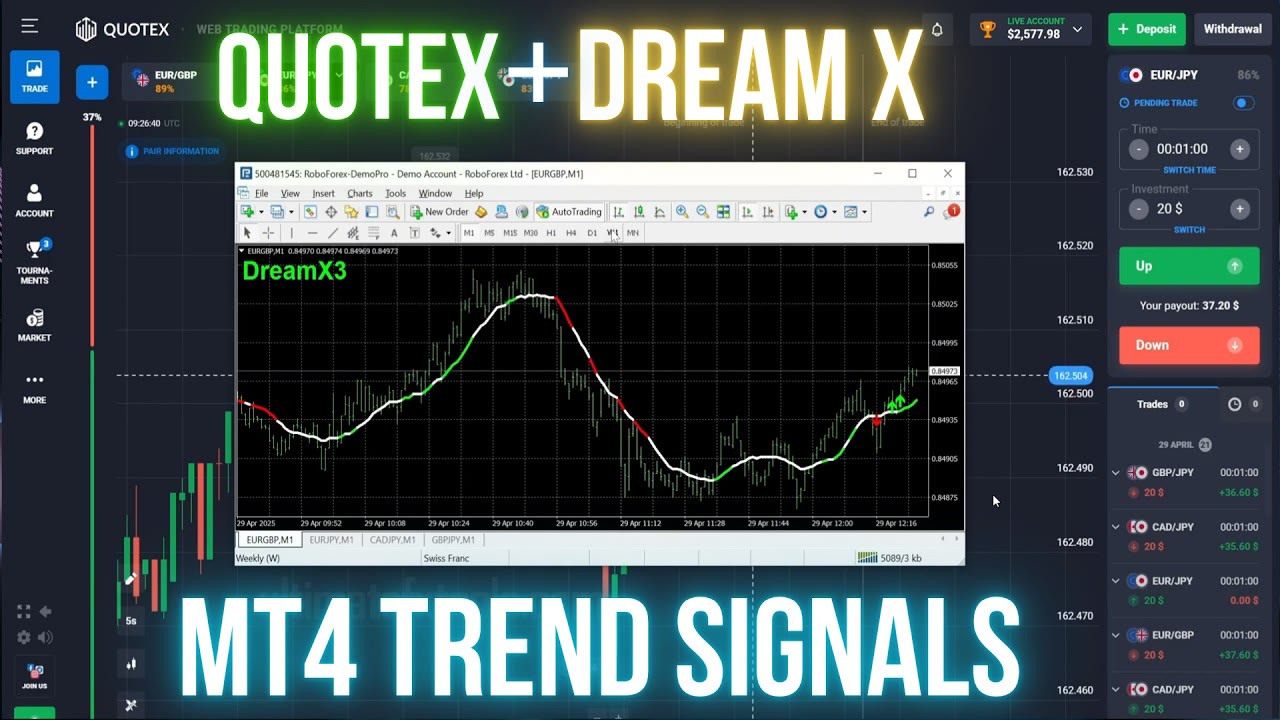
Most signal setups ask you to stare at one chart and wait. This one does the opposite: MetaTrader 4 watches four pairs at once and makes a noise when one of them turns. You are not reading charts between alerts — you are waiting for the alarm.
The trading happens somewhere else entirely. MT4 never places an order here. It is the alarm; Quotex is the broker.
The layout
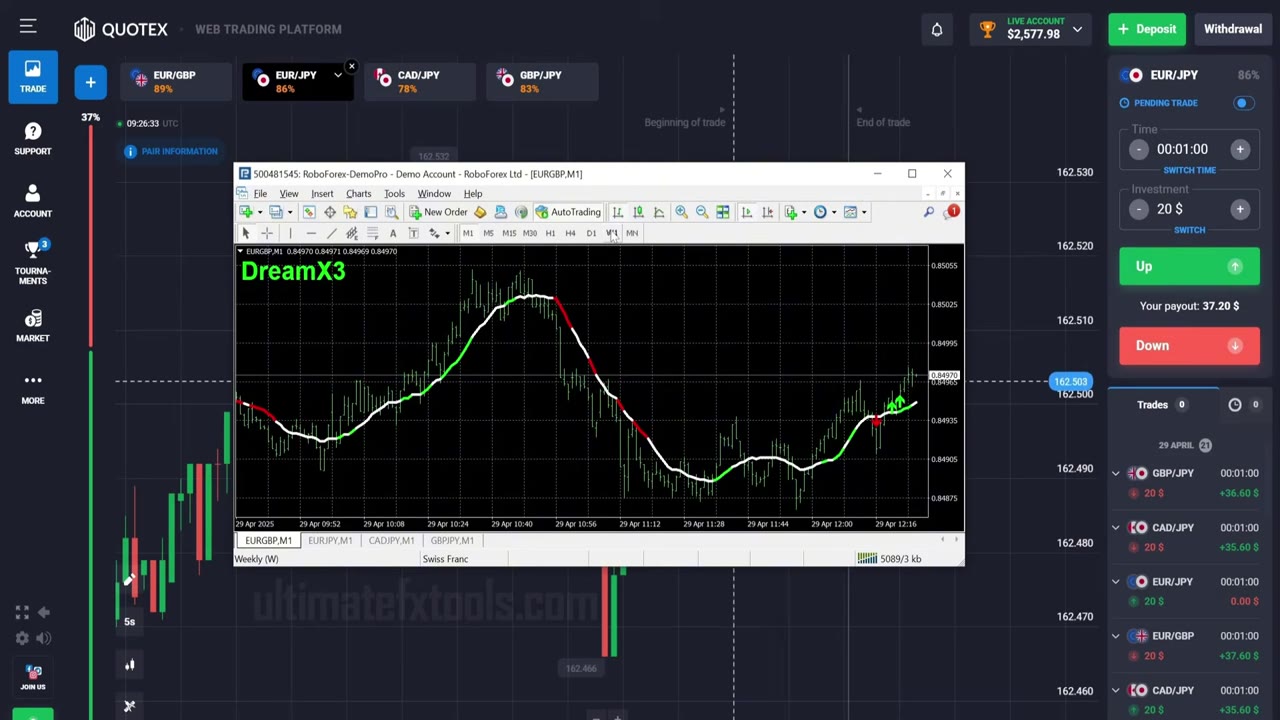
One MetaTrader 4 window, four M1 charts on tabs along the bottom: EUR/GBP, EUR/JPY, CAD/JPY and GBP/JPY. Dream X 3 is loaded on each. The Quotex platform sits behind it with the same four pairs open, so acting on an alert is a click away rather than a search.
Dream X 3 draws one line that changes colour with direction — green while the trend reads up, red while it reads down, and white through the stretches where there is no clear direction at all. The alert fires on the colour shift.
Notice the white sections in the screenshot. They are most of the chart. That is the tool being honest: on a one-minute chart, the majority of the time there is no trend to follow, and a tool that admits it is more useful than one that always has an opinion.
The MT4 account is a demo, and that is fine
Look at the MetaTrader title bar: RoboForex-DemoPro — Demo Account. Meanwhile Quotex says LIVE ACCOUNT in the corner.
That is not an oversight, it is the design. MetaTrader is not executing anything — it is reading price and firing alerts. A demo account carries the same live feed for the major pairs, so it works as a signal terminal and costs nothing. If you have wondered whether you need a funded MT4 broker to use our indicators this way, you do not.
The catch worth stating: this is a workflow for pairs that exist in both places. MetaTrader cannot read a broker's OTC feed, so OTC pairs are outside this method entirely. The four pairs here are real market pairs, which is what makes the cross-platform read possible.
The four trades
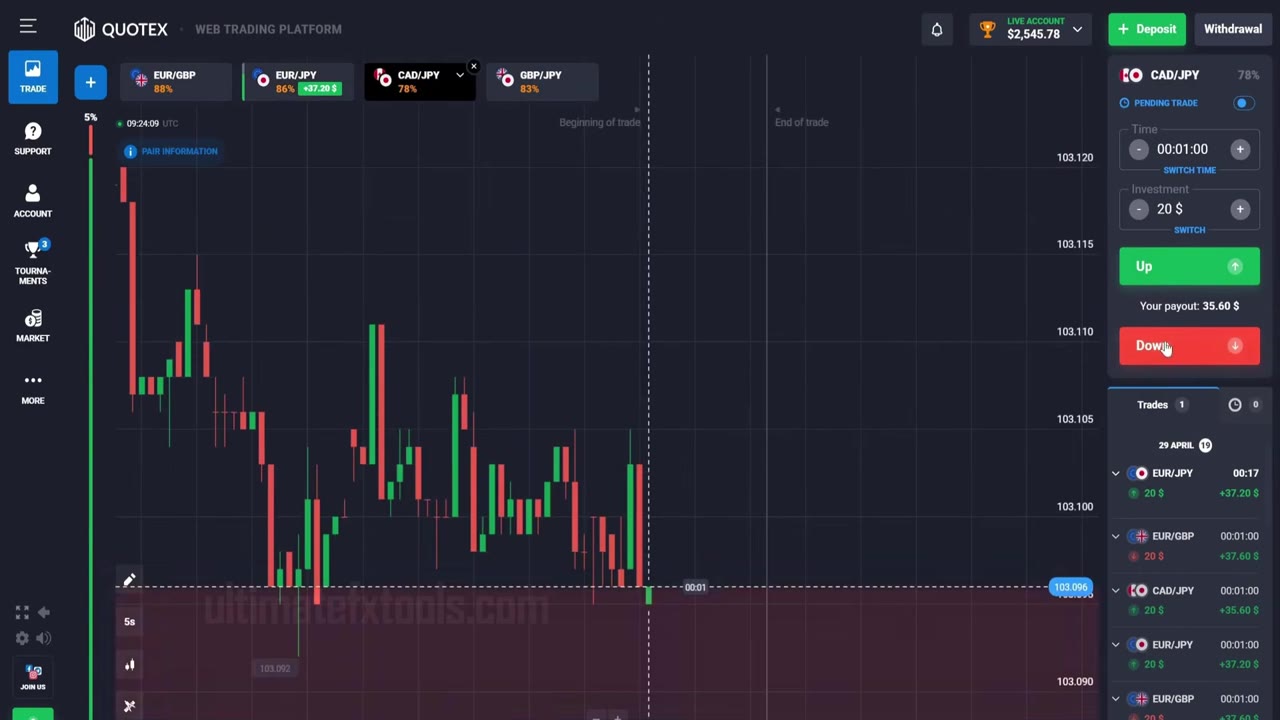
Every trade is $20 for 1 minute, flat, with no increasing after a loss. Here is what the session actually did:
| Pair | Alert | Payout | Returned | Result |
|---|---|---|---|---|
| EUR/GBP | Downtrend | 88% | $37.60 | +$17.60 |
| EUR/JPY | Uptrend | 86% | $0.00 | −$20.00 |
| CAD/JPY | Downtrend | 78% | $35.60 | +$15.60 |
| GBP/JPY | Downtrend | 83% | $36.60 | +$16.60 |
Three green, one red. The red one is said out loud in the video rather than edited out, which is worth crediting — and the returns are worth checking against the payouts, because they line up exactly. A $20 stake at 88% returns $37.60. At 78% it returns $35.60. The numbers on screen are internally consistent, which is more than can be said for a lot of what gets posted as proof.
The first EUR/GBP alert had a second thing going for it: a reversal pattern in the candles at the same spot as the colour shift. That is the shape of a good entry with this tool — the line changes state, and price agrees. When only the line has changed, you are trading a lagging average by itself.
The one that lost, and the button on it
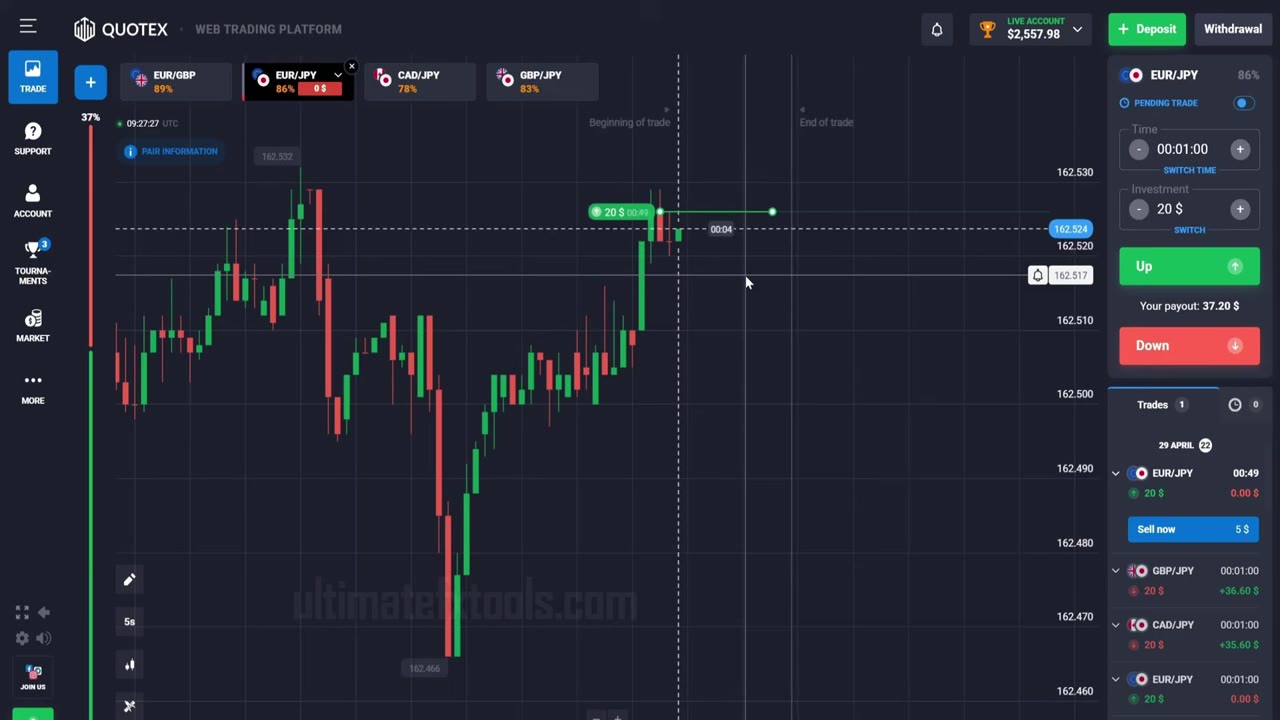
The EUR/JPY uptrend trade went the wrong way. As it ran, Quotex offered Sell now — $5: close early and take $5 back on the $20 rather than lose the lot.
That button deserves a rule rather than a reflex. Used with a plan — if the trade is against me at the halfway mark, I take the partial — it is a legitimate way to cap a loss. Used in the moment, on a trade you are already losing, it quietly teaches you to bail out of positions early, and the habit does not stay confined to the losers. Decide before the session or leave it alone.
Payouts still set the bar
The four pairs in this session paid between 78% and 89%, and the payout on each one moves during the day — EUR/GBP reads 88% in one frame and 89% a few minutes later. That range matters more than it looks:
| Payout | Win rate needed to break even | Pair in this session |
|---|---|---|
| 89% | 52.9% | EUR/GBP (later) |
| 86% | 53.8% | EUR/JPY |
| 83% | 54.6% | GBP/JPY |
| 78% | 56.2% | CAD/JPY |
CAD/JPY needs you to be right 3.3 percentage points more often than EUR/GBP for exactly the same work. If two alerts arrive together and you can only take one, that is the tiebreaker. We went through this arithmetic in more depth in the payout filter post.
The risk rule, and where we would tighten it
The video states its money management plainly: keep each trade to about 2–5% of your balance, and set both a daily target and a daily stop so one bad run cannot take the day with it. The daily stop is the part most people skip and the part that matters most.
One observation, though. The stake used on screen is $20 against a balance of roughly $2,550 — that is 0.8%, not 2–5%. What is actually demonstrated is far more conservative than what is recommended, and the demonstrated version is the better one. At 5% per trade, a run of six losses — entirely normal at these payouts — takes about a quarter of the account. We would stay near the number the video actually traded rather than the number it quoted.
How we would run it
- Wait for the candles to agree. The colour shift opens the question; price action answers it. The best entry in this session had both.
- Skip the white stretches. If the line has been white and flat, a shift out of it is far weaker than a shift after a real move.
- Let the payout break ties. Simultaneous alerts do happen — two fired at once here. Take the better-paying pair.
- One expiry, one stake. A minute and a flat amount. The session's discipline is the reason it is readable at all.
- Set the daily stop before you start. Not after the third red.
- Demo first. The alert parameters come from prior CCI and trend work, and a 1-minute expiry will not suit every pair. Find out which ones on an account that cannot cost you anything.
Two things to know
Dream X 3 and Dream X are the same engine. They ship as separate products and customers own them under both names, but our own signal-by-signal comparison across six markets found them identical on every bar. Load whichever you have; loading both onto one chart just draws the same line twice. The MT5 build is in the same package as the MT4 one.
The recording is not from this week. The MetaTrader time axis reads 29 April 2025. The workflow, the indicator and the alert behaviour are unchanged, but do not carry the payout numbers across — check what your own account is quoting today, because as the table above shows, that is the number doing the heavy lifting.
Why 4 and not 5
The workflow is genuinely good and the session is honest about it: a losing trade named on camera, returns that reconcile with the stated payouts, a demo terminal used openly, and risk rules given as numbers rather than platitudes. Four charts from one terminal is a real answer to the problem of one-minute setups producing too few signals.
It falls short of a 5 on evidence rather than method. Four narrated trades on one April morning does not tell you how the alert behaves across a week of different conditions, and the stated 2–5% risk band is looser than what the session itself demonstrates. Take the layout and the discipline. Establish the rest on demo.
The session
Dream X 3 is our own indicator and is included in the $39 lifetime package, so read this as our tool in our video. The payout arithmetic is broker maths and holds whatever you trade with. Trading carries substantial risk and you can lose your capital; nothing here guarantees a result and past performance does not predict future performance. Practise on a demo account first.