Two Setups, One Channel
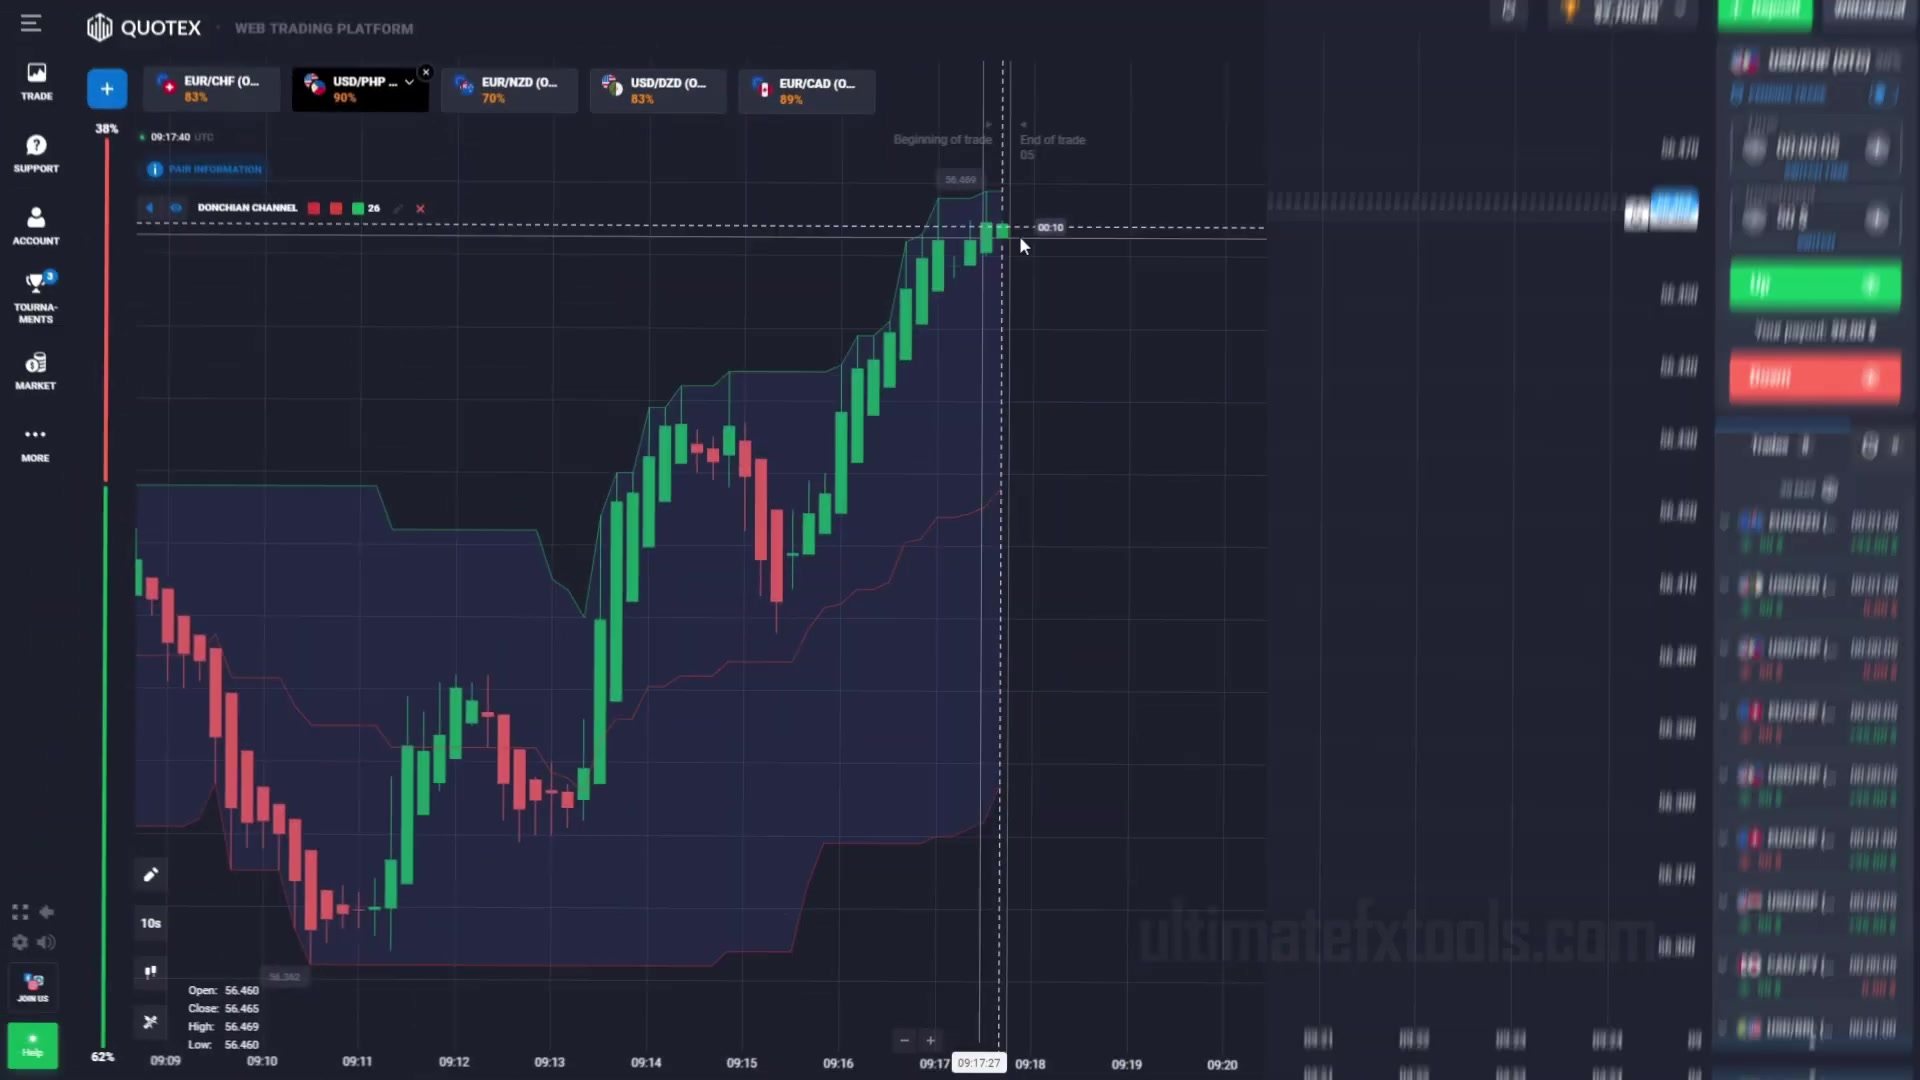
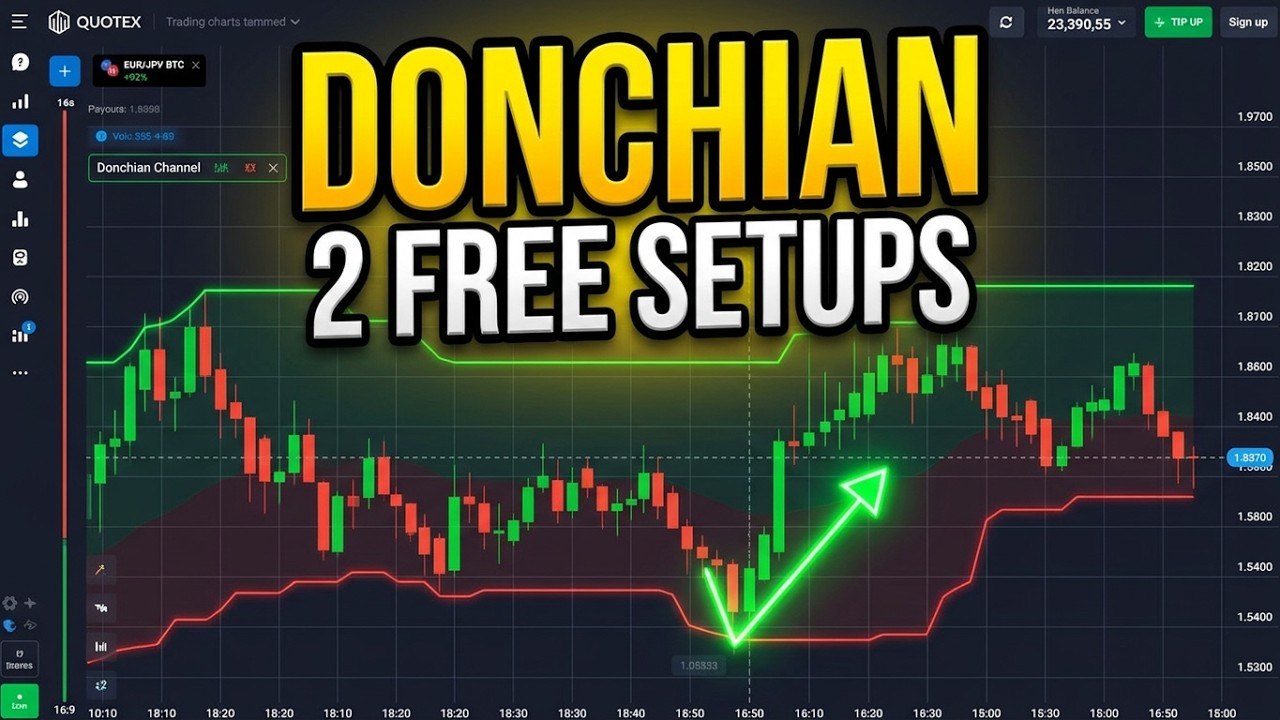
The Donchian Channel is the simplest channel there is. Its top line is the highest high of the last 20 candles, its bottom line the lowest low, and the middle line sits halfway between. When price touches the top line, it has just made a new 20-candle high. When it touches the bottom, a new 20-candle low.
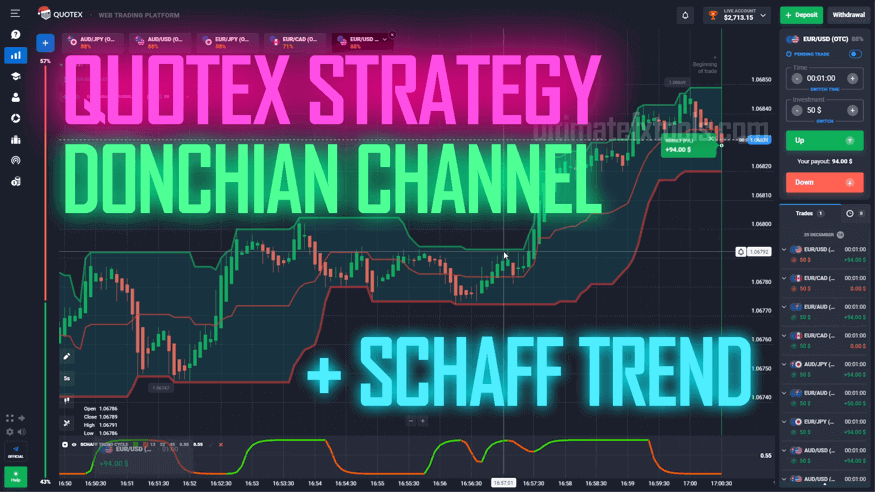
Both setups in this video use that idea the same way: when price runs hard into the edge of the channel, look for a turn back the other way and trade it for one minute. What changes is the second indicator that confirms the turn — SuperTrend in Setup 1, Schaff Trend Cycle in Setup 2. Everything ships with Quotex, so there is nothing to download.
We went through the video frame by frame and logged every trade: 7 trades, 5 wins, 2 losses — 3 for Setup 1 (2 won) and 4 for Setup 2 (3 won). The video description gives the same count, and both losses are shown on screen.
Setup 1: Donchian Channel + SuperTrend
Settings, exactly as shown
- Donchian Channel: period 20
- SuperTrend: period 12, multiplier 3 (green line under price in an uptrend, magenta line above price in a downtrend)
- Chart: Japanese candles on the 15-second timeframe
- Trade time: 1 minute
- Stake: $10 per trade, 80% payout
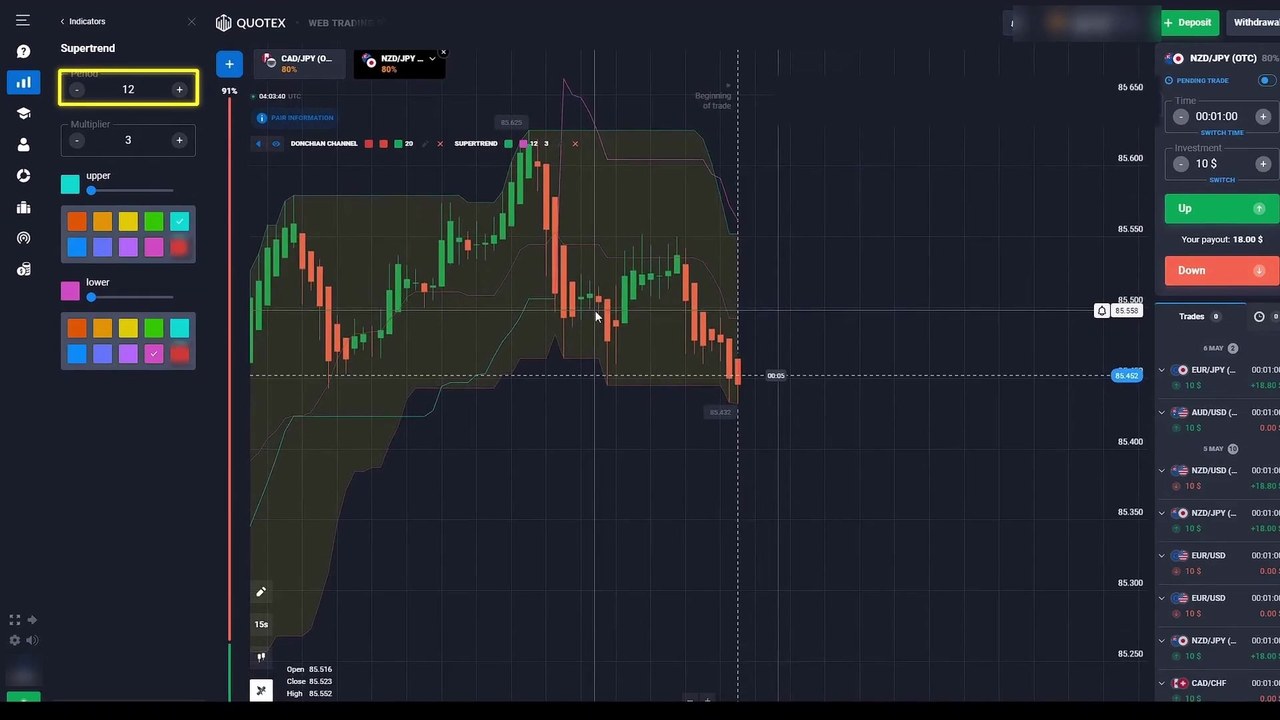
A multiplier of 3 keeps the SuperTrend line well away from price, so it does not flip on every small wiggle. When it does flip, the move behind it was a real one.
The entry rules
- Price runs into the top of the channel. Look for a fast run of green candles that reaches the upper Donchian line.
- SuperTrend is magenta above price. Either it has just flipped from green to magenta, or it was already magenta and price has rallied up toward it.
- Sell for 1 minute as the run stalls at the top of the channel.
All three trades in the video were sells. The mirror buy — price at the bottom of the channel with SuperTrend green below it — follows the same logic, but it was not shown, so test it before you trust it.
A sell after a fast rally: NZD/JPY OTC
NZD/JPY OTC had already dropped to the bottom of the channel, with SuperTrend magenta above price. A burst of green candles then carried price straight back up to the top of the channel. The trader sold $10 for one minute at the top of that run.
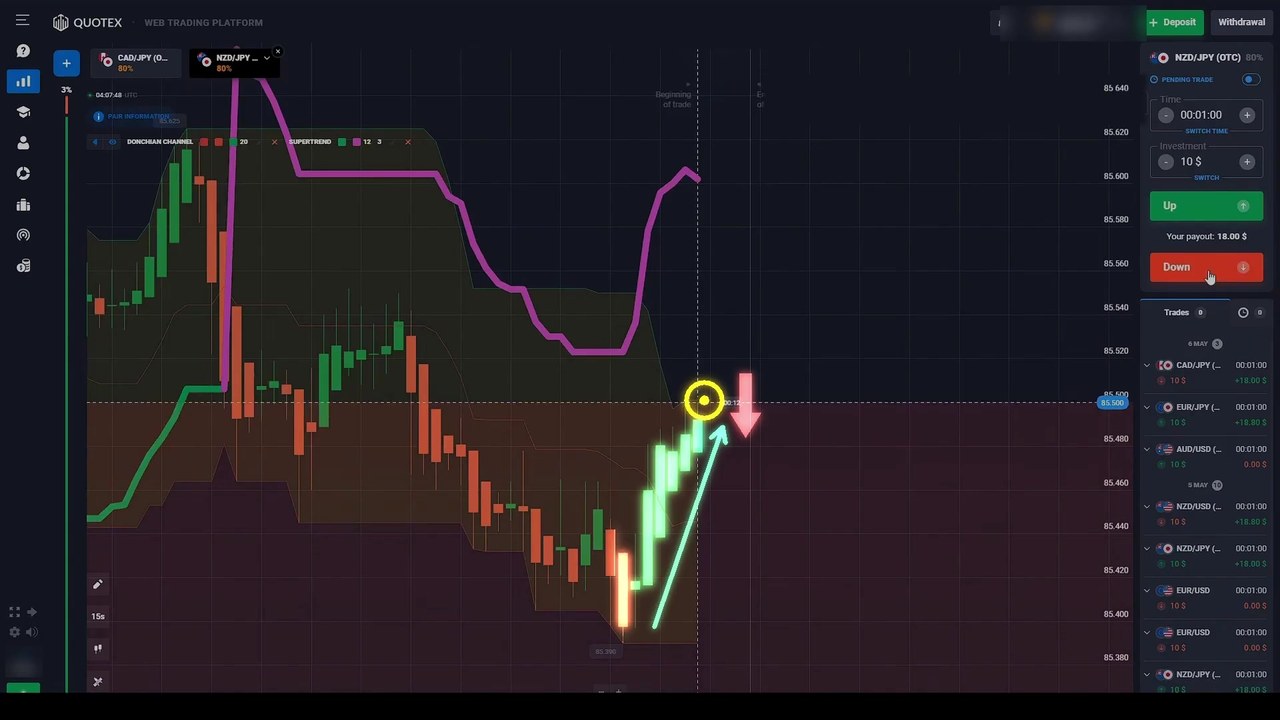
Price turned back down inside the minute. Result: $18 back, $8 profit.
The one that did not work: CAD/JPY OTC
CAD/JPY OTC climbed in a long line of green candles into the upper band, and SuperTrend flipped to magenta — the same picture as the first winning trade on this pair. The trader sold. This time price kept pushing higher and closed the minute above the entry.
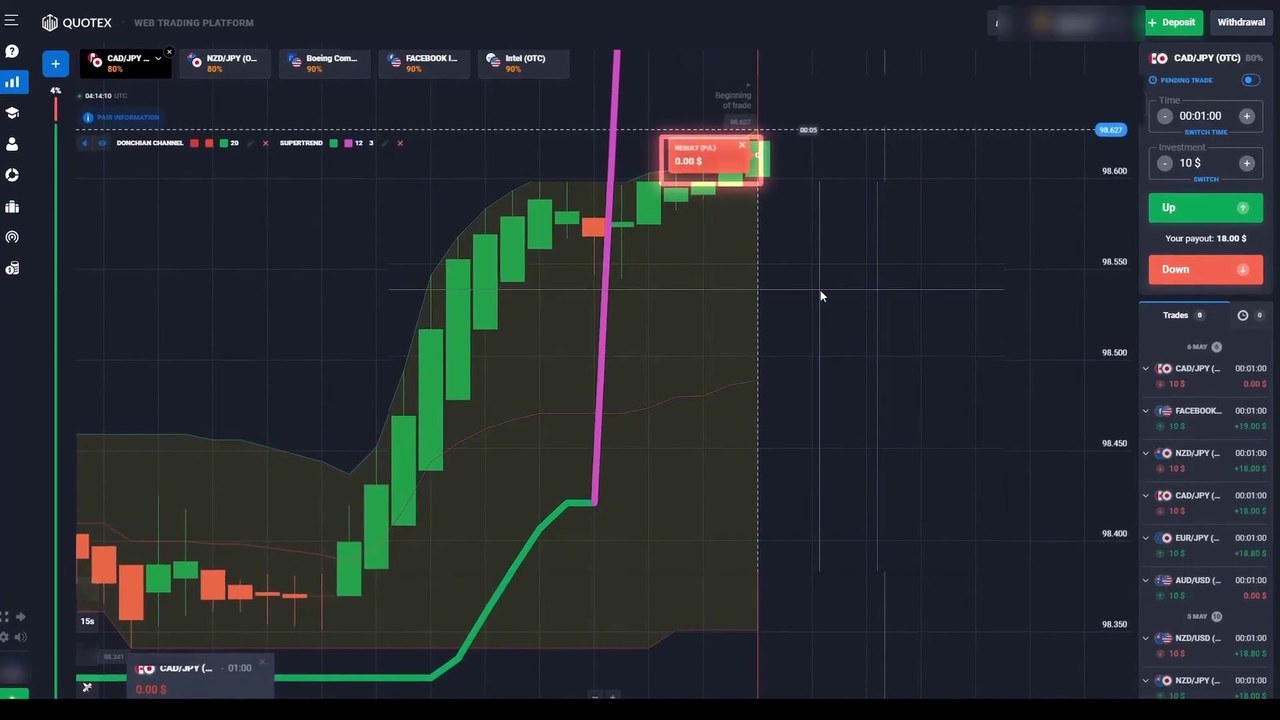
Result: $0 back, −$10. A strong trend can keep making new highs, and the channel simply moves up with it.
Setup 1 trades
- CAD/JPY OTC — sell at the top of the channel, SuperTrend flips to magenta: win, $18 back (+$8)
- NZD/JPY OTC — sell after a rally into the top of the channel: win, $18 back (+$8)
- CAD/JPY OTC — sell at the top of the channel, SuperTrend flips to magenta: loss, $0 back (−$10)
Setup 1 total: 3 trades, 2 wins, 1 loss, +$6 on $30 staked.
Setup 2: Donchian Channel + Schaff Trend Cycle
Settings, exactly as shown
- Donchian Channel: period 20
- Schaff Trend Cycle: 13, 22, 45 (the two factor values stay at Quotex’s 0.55 default)
- Chart: Japanese candles on the 5-second timeframe
- Trade time: 1 minute
- Stake: $50 per trade, 88% payout
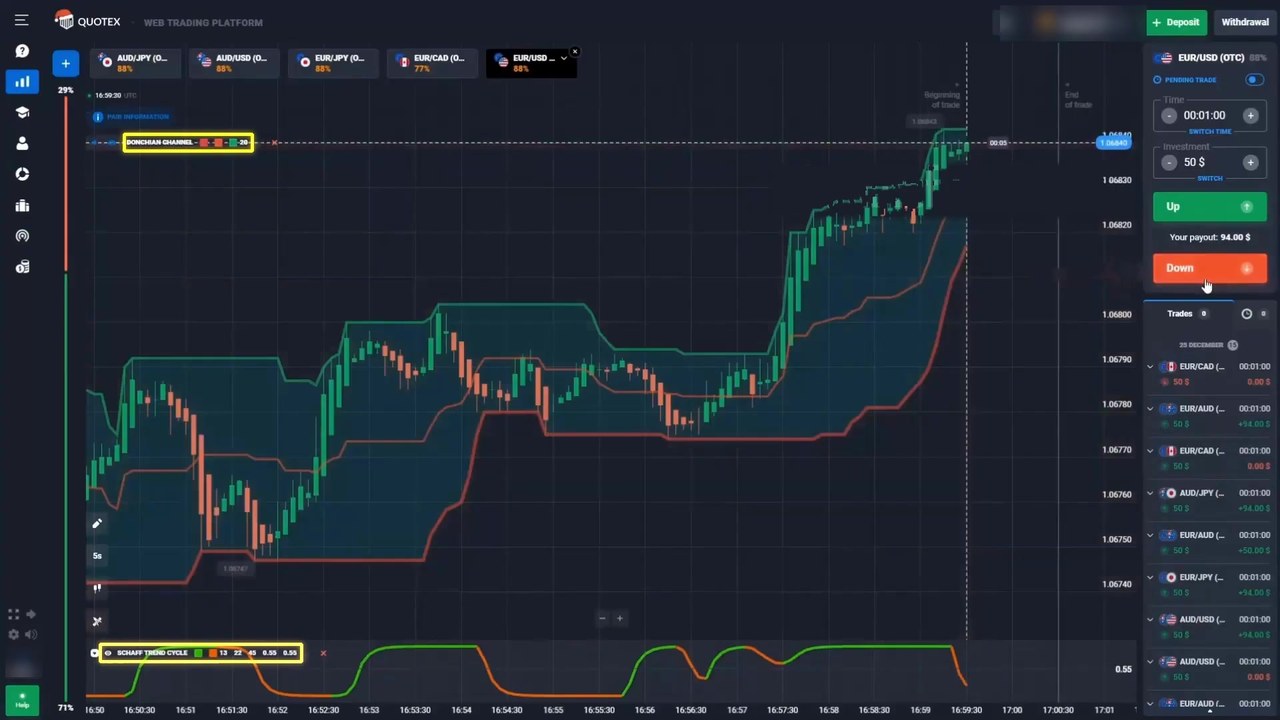
The Schaff Trend Cycle runs between 0 and 100 and spends most of its time flat at one end or the other. Pinned at the top (green) means the short-term push is up and stretched. Pinned at the bottom means the push is down. The moment it starts to bend away from the edge is the early sign of a turn.
The entry rules
- Price reaches the edge of the channel. The upper Donchian line for a sell, the lower line for a buy.
- Check the Schaff Trend Cycle. For a sell it should be pinned at the top. For a buy it should be at the bottom and starting to turn up.
- Enter for 1 minute at the edge of the channel.
A sell at the top of the channel: AUD/USD OTC
AUD/USD OTC bounced off the bottom of the channel and ran all the way to a fresh high at the top line. The Schaff Trend Cycle had swung from the bottom to the top. The trader sold $50 for one minute.
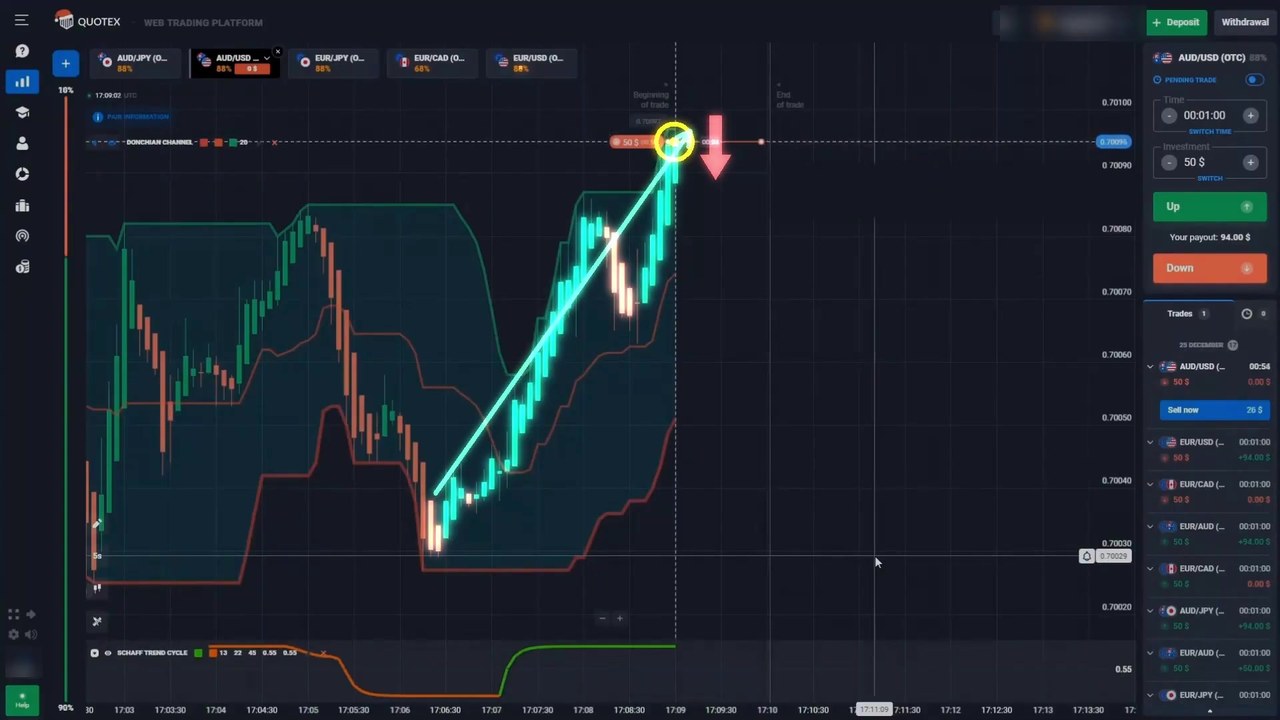
Price turned back inside the minute. Result: $94 back, $44 profit.
A buy at the bottom of the channel: NZD/CHF OTC
NZD/CHF OTC slid down the lower line in a long run of red candles, with the Schaff Trend Cycle flat at the bottom. As the first green candles appeared, the indicator started to turn up and the trader bought $50 for one minute at 0.59238.
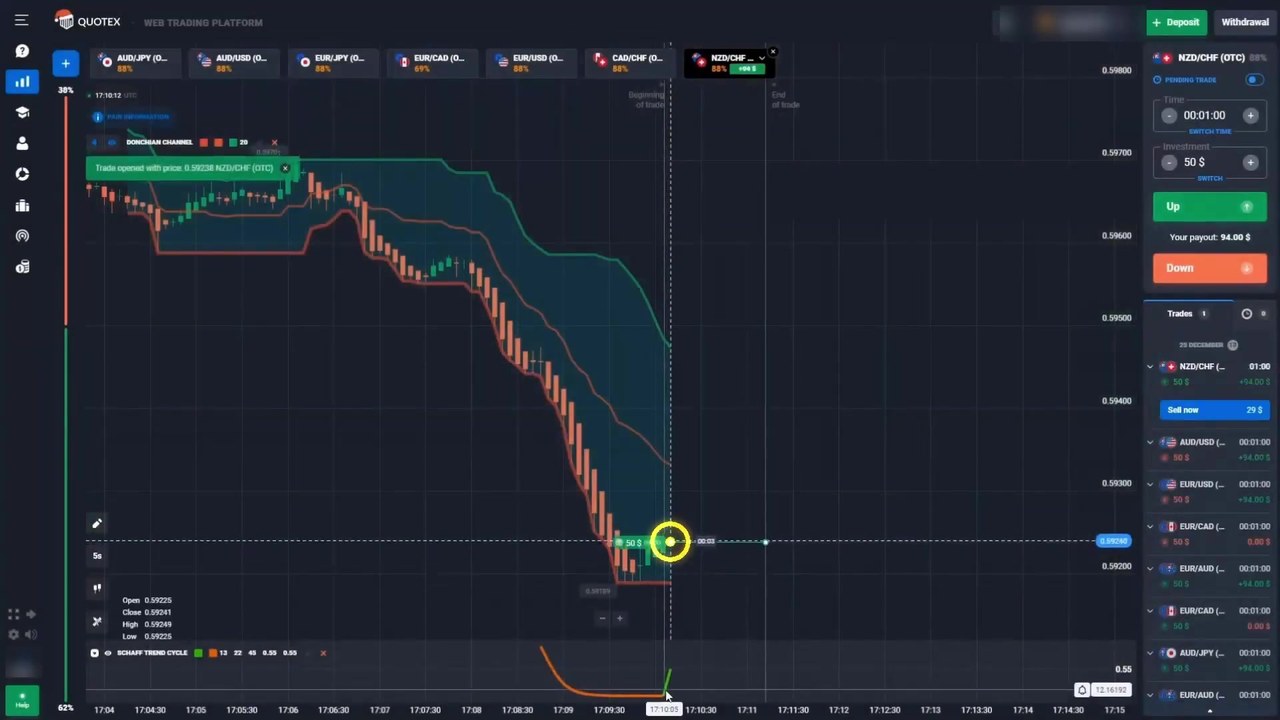
Price climbed back through the minute. Result: $94 back, $44 profit.
The loss: CAD/CHF OTC
CAD/CHF OTC was in a long, steady fall. Price reached the lower line again and the Schaff Trend Cycle was rising from the bottom, so the trader bought. Price kept sliding along the bottom of the channel.
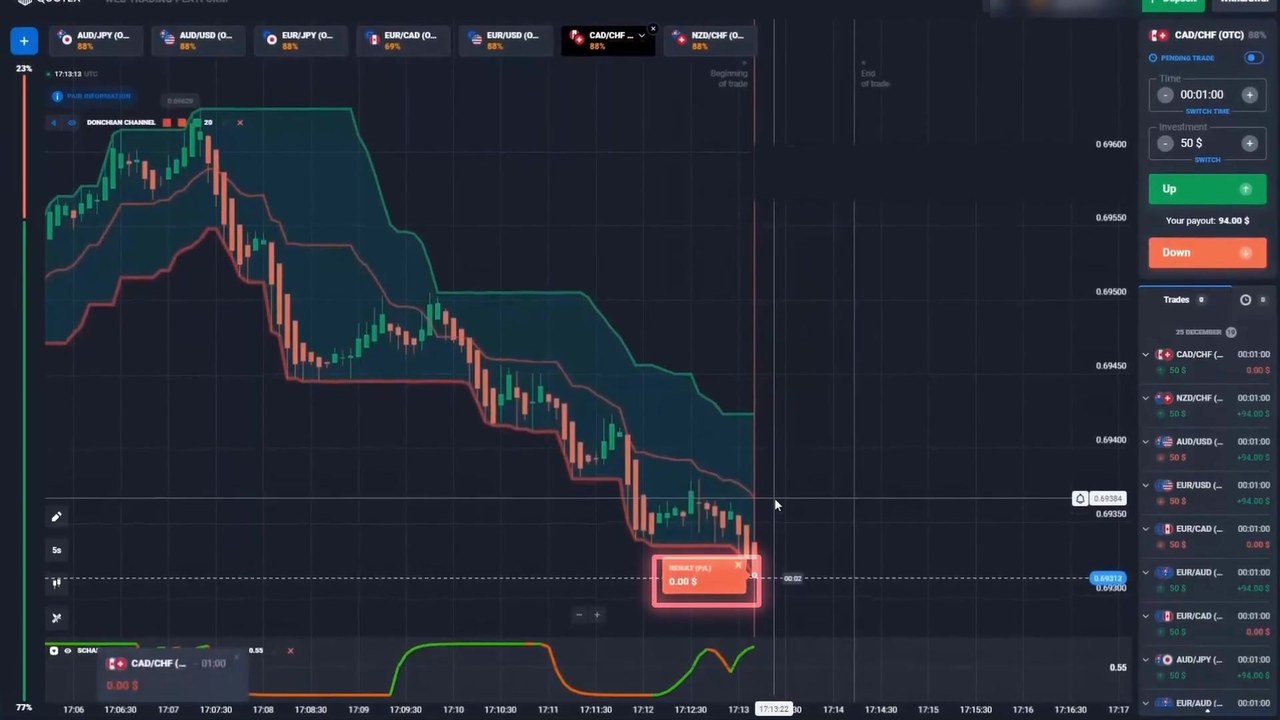
Result: $0 back, −$50. In a clean downtrend, the lower Donchian line is not a floor — it keeps moving down with every new low.
Setup 2 trades
- EUR/USD OTC — sell at the top of the channel: win, $94 back (+$44)
- AUD/USD OTC — sell at the top of the channel: win, $94 back (+$44)
- NZD/CHF OTC — buy at the bottom of the channel: win, $94 back (+$44)
- CAD/CHF OTC — buy at the bottom of the channel: loss, $0 back (−$50)
Setup 2 total: 4 trades, 3 wins, 1 loss, +$82 on $200 staked.
Both Setups Together
7 trades, 5 wins, 2 losses, +$88 on $230 staked. Every trade was a single entry at a flat stake — no doubling after a loss and no stacked entries. The stakes were different, though: $10 for Setup 1 and $50 for Setup 2, so most of the dollar result comes from Setup 2.
Know your break-even before you start. At an 80% payout you need to win about 56% of trades just to stay level; at 88%, about 53%. Seven trades cannot tell you whether either setup clears that line.
All Seven Trades Were on OTC Pairs
CAD/JPY, NZD/JPY, EUR/USD, AUD/USD, NZD/CHF and CAD/CHF were all traded in their OTC versions. OTC prices come from the broker’s own feed, not the interbank market, so these results say nothing about how the setups behave on regular market pairs. Test on the market you actually plan to trade.
Watch the Video
Both setups, the settings screens and all seven trades, including the two losses:
Honest Weaknesses
- Both setups fade the move. A new 20-candle high is also how every strong trend begins. Both losses here are a trend that kept going through the edge of the channel.
- Setup 1 was only shown on sells. The buy side is a reasonable mirror, but there is no trade in the video to back it up.
- “Fast run into the band” is judged by eye. The video gives no minimum number of candles, so two traders will not pick the same entries.
- Seven trades on OTC pairs is a demonstration, not a test.
Turning It Into Rules You Can Test
- Pick one setup and copy the settings exactly.
- Give the run a number — for example, at least 6 candles in one direction before price touches the band.
- Skip the band touch if the trend is clean — for example, when the channel has been sloping one way for the whole visible chart. That filter alone would have kept you out of the CAD/CHF loss.
- One entry per setup, flat stake.
- Log 50 trades on a demo account, then compare your win rate with the break-even for your payout.
Risk Management
- Keep one stake for the session — no doubling after a loss.
- Set a daily loss limit and a maximum number of trades, and stop at either.
- Know your break-even: about 56% at an 80% payout, about 53% at 88%.
- Practise on a demo account first, and never trade money you cannot afford to lose.
Frequently Asked Questions
What are the settings for the Donchian SuperTrend strategy?
Donchian Channel period 20 and SuperTrend period 12 with multiplier 3, on 15-second Japanese candles with 1-minute trades.
What are the settings for the Donchian Schaff Trend Cycle strategy?
Donchian Channel period 20 and Schaff Trend Cycle 13, 22, 45 (the two factor values stay at Quotex's 0.55 default), on 5-second candles with 1-minute trades.
When do you buy and when do you sell?
Sell when price runs into the upper Donchian band and the second indicator agrees: SuperTrend magenta above price, or Schaff Trend Cycle pinned near its top. Buy is the mirror: price at the lower band with Schaff Trend Cycle at the bottom and turning up. The SuperTrend setup was only shown on sells.
What was the result in the video?
7 trades: the SuperTrend setup won 2 of 3 at $10 each (+$6) and the Schaff Trend Cycle setup won 3 of 4 at $50 each (+$82), for +$88 in total. Every trade was a single flat-stake entry on an OTC pair.
The Verdict
4 out of 5. Two clear setups from free, built-in Quotex indicators, with the exact settings on screen and every trade kept in, losses included. The Schaff Trend Cycle version is the more complete of the two: it was shown on both buys and sells.
The missing star: all seven trades were on OTC pairs, the SuperTrend setup was only shown on sells, and seven trades is far too few to call either one proven. Pick one, put numbers on its rules, and let a logged demo sample decide.
#Quotex #DonchianChannel #SuperTrend #SchaffTrendCycle #TradingStrategy #1MinuteTrading #TechnicalAnalysis
This content is for educational purposes only and is not financial advice. Trading involves substantial risk; you can lose some or all of your capital. No result is guaranteed and past results do not indicate future outcomes. Always practise responsible money management, limit your daily trades, and trade only what you can afford to lose.
Related reading: an earlier Donchian Channel and Schaff Trend Cycle setup on Quotex, SuperTrend with the Keltner Channel, and last week’s two free ZigZag strategies. For more on this platform, see the Quotex hub and the strategy library.