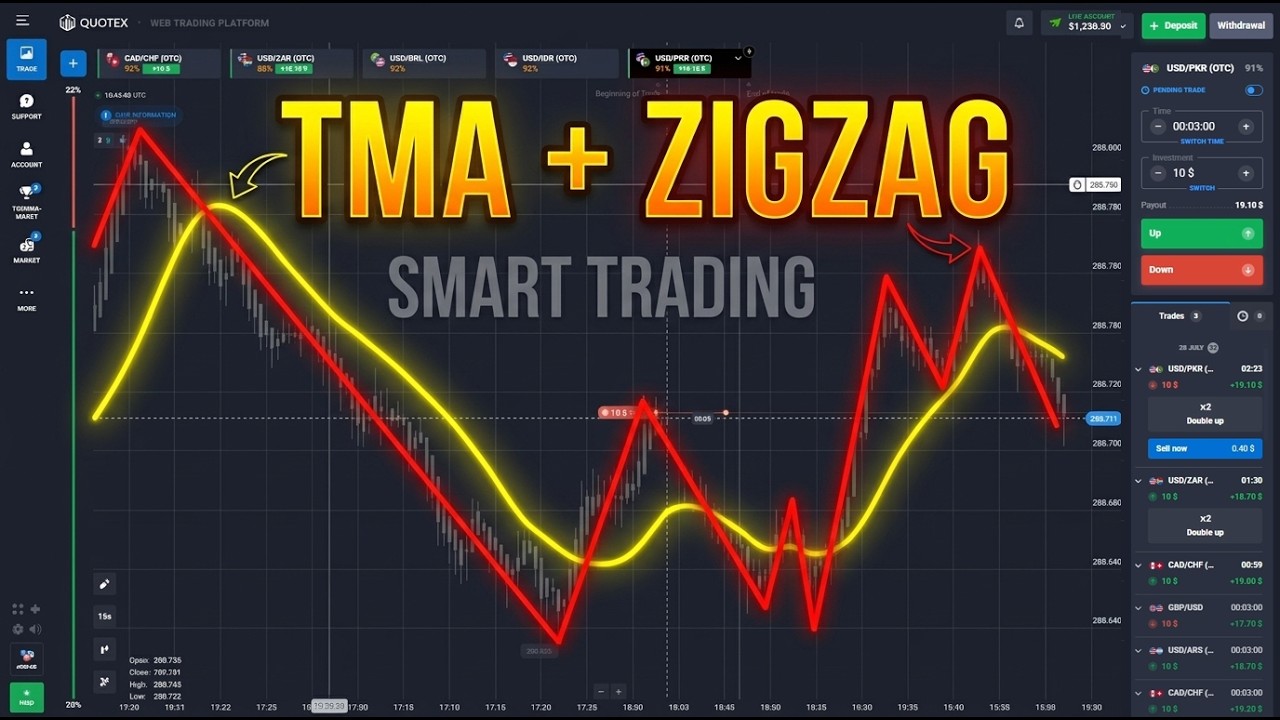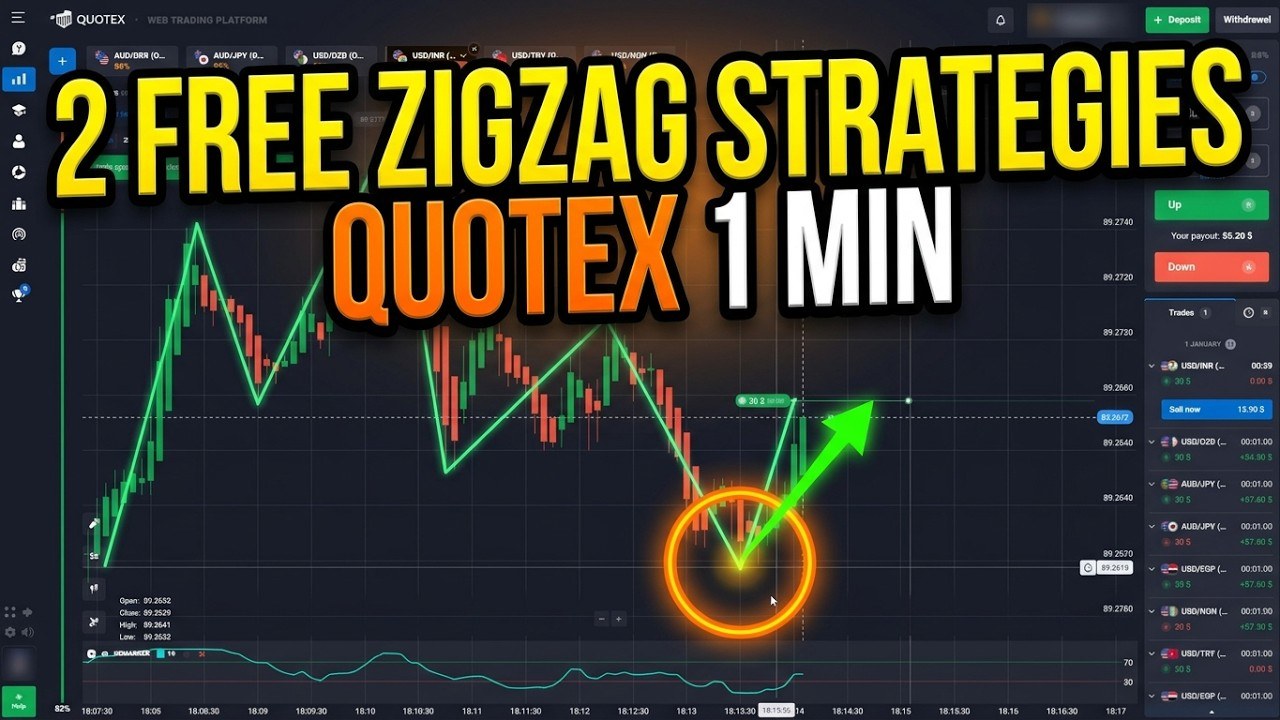
Two Strategies, One Idea
Both strategies in this video are built from indicators that already ship with Quotex — nothing to download, nothing to install. Each one starts with the ZigZag, which draws a line between the swing highs and lows so you can see at a glance how far the latest leg has run. A second tool then tells you when that leg is stretched: Bollinger Bands plus RSI in Strategy 1, DeMarker in Strategy 2.
The idea is the same in both. When a ZigZag leg has pushed hard in one direction and the second tool says the move is overdone, you trade the turn for one minute. After a long drop you buy. After a long rise you sell.
We went through the video frame by frame and logged every trade: 10 trades, 8 wins, 2 losses — 6 for Strategy 1 (5 won) and 4 for Strategy 2 (3 won). The video description gives the same count, and the losses are shown on screen, not cut.
Strategy 1: ZigZag + Bollinger Bands + RSI
Settings, exactly as shown
- ZigZag: 3, 13, 2 (teal line)
- Bollinger Bands: period 12, deviation 3
- RSI: period 12, levels 80 / 20
- Chart: Japanese candles on the 5-second timeframe
- Trade time: 1 minute
- Stake: $20 per trade
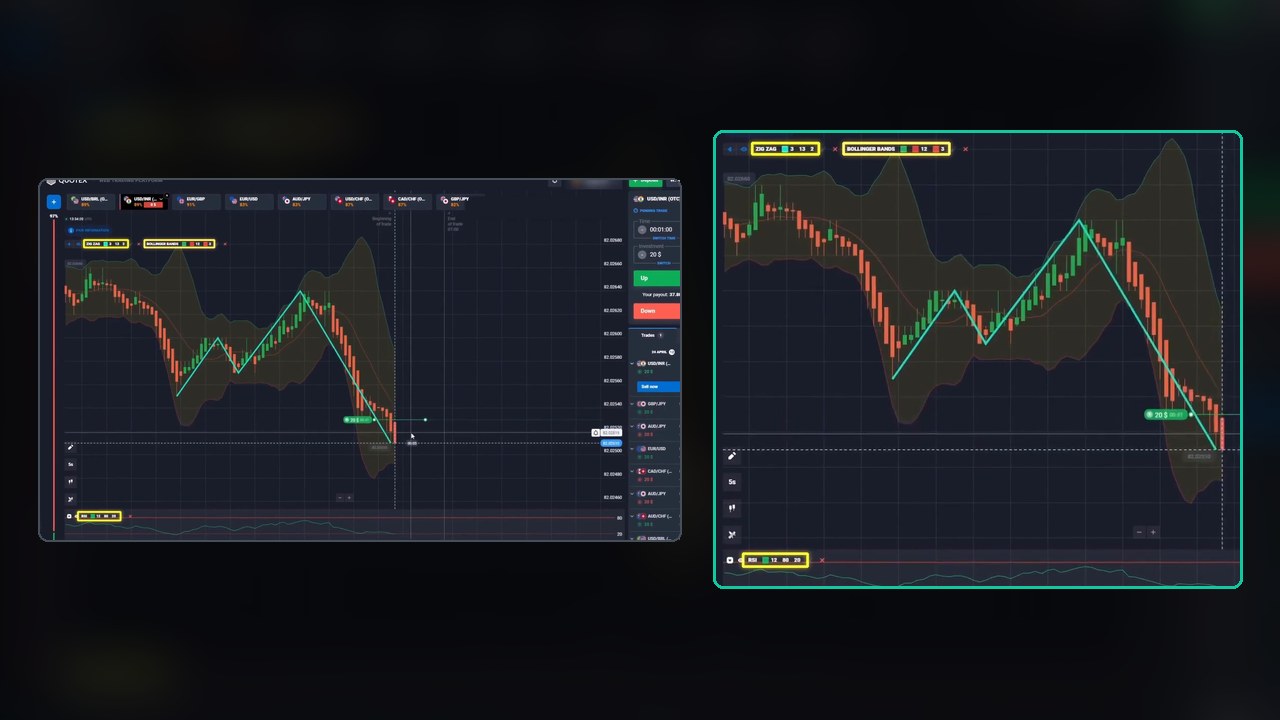
Two details matter here. A deviation of 3 puts the Bollinger Bands much further out than the usual 2, so price touches them far less often — when it does, the move really is stretched. And the RSI levels are set at 80 / 20 instead of 70 / 30 for the same reason: fewer signals, but more extreme ones.
The entry rules
- Find a long ZigZag leg. The last teal leg should be a clear one-way run, not a short wiggle.
- Price reaches the outer band. For a buy, the leg has driven price down to the lower Bollinger Band. For a sell, up to the upper band.
- Check the RSI. It should be pushed toward 20 for a buy or toward 80 for a sell. The video highlights the RSI pane at the entry each time.
- Enter on the turn, for 1 minute. Wait for the first candle that moves back against the leg, then take the trade.
A sell at the top of the band: CAD/CHF OTC
CAD/CHF OTC climbs in a steady line of green candles, riding the upper Bollinger Band for most of the chart. When the first red candle appears at the top, the trader sells $20 for one minute.
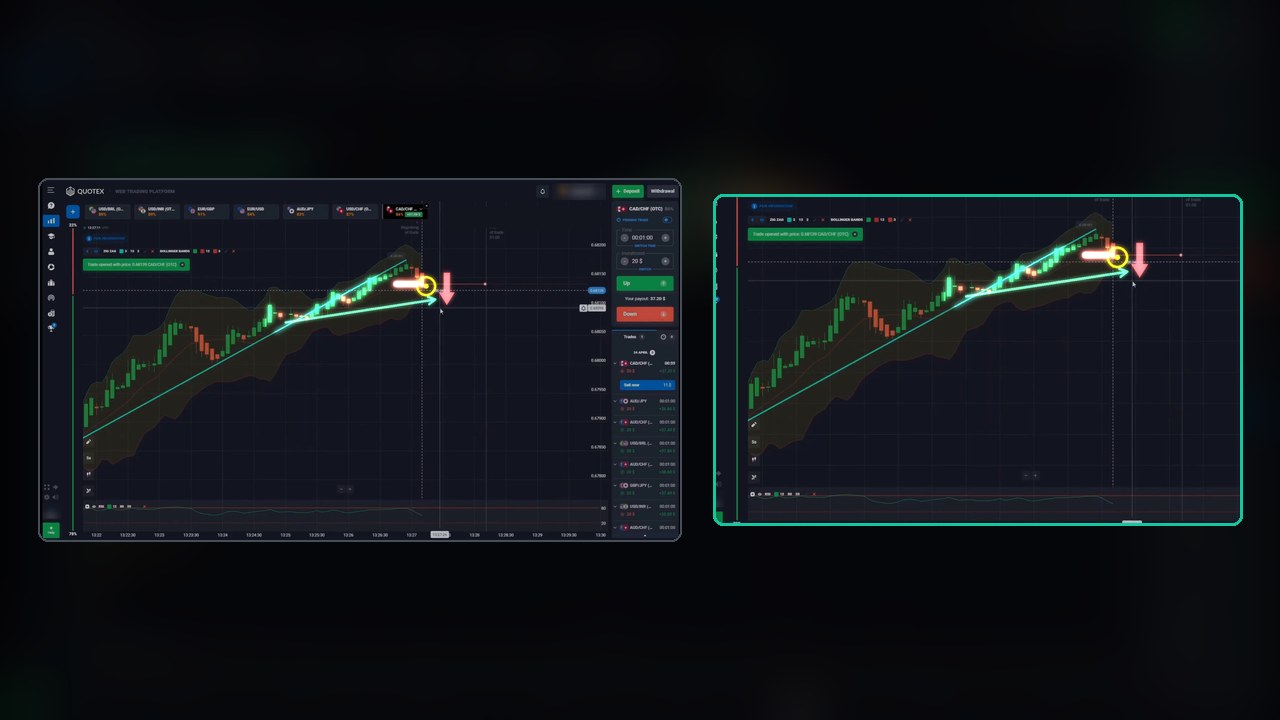
Price rolls over straight away and keeps falling for the whole minute. Result: $37.20 back, $17.20 profit at an 86% payout.
The one that did not work: GBP/JPY
GBP/JPY (the regular market pair, 82% payout) dropped sharply off a ZigZag high into the lower band — the same picture as the winning buys. The trader bought. Price went sideways instead of bouncing and the trade closed at the entry level or below.
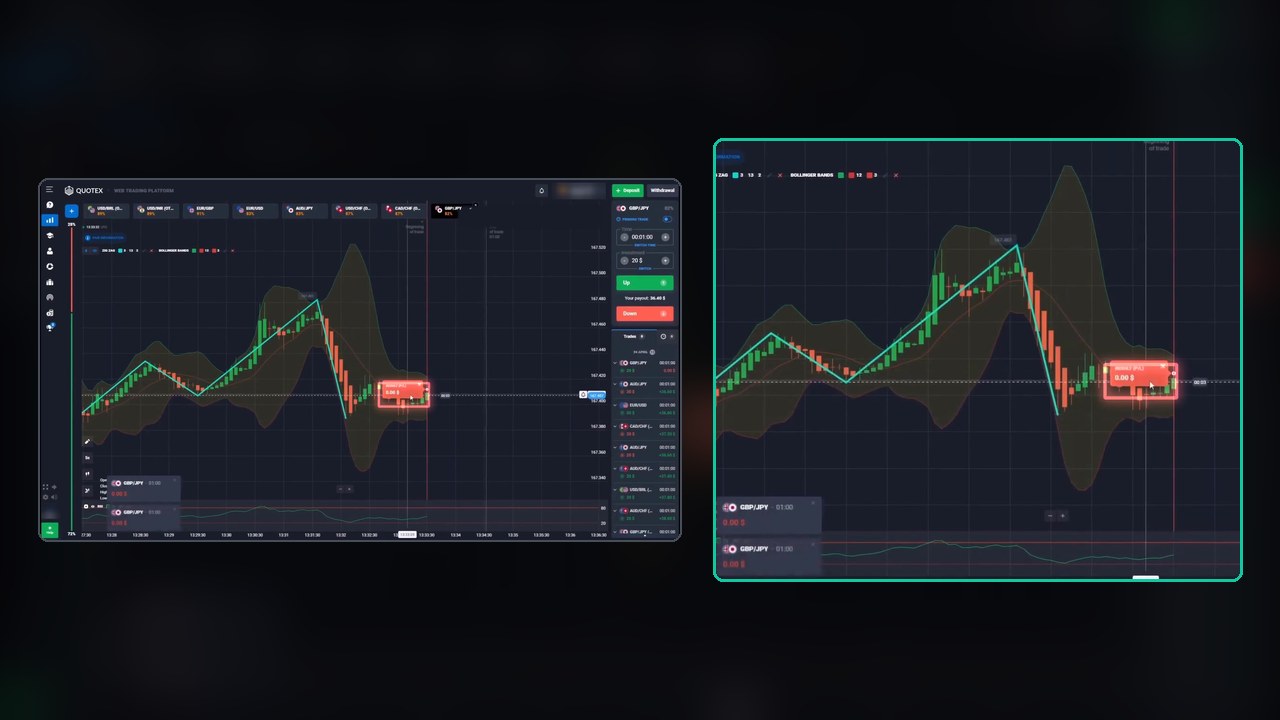
Result: $0.00 back, −$20. Nothing in the setup looked different beforehand, which is the honest point: a stretched move can simply stay stretched.
Strategy 1 trades
- CAD/CHF OTC — sell after a rise: win, $37.20 back (+$17.20)
- EUR/USD — buy after a drop: win, $36.60 back (+$16.60)
- AUD/JPY — sell after a rise: win, $36.60 back (+$16.60)
- GBP/JPY — buy after a drop: loss, $0.00 back (−$20)
- USD/INR OTC — buy after a drop: win, $37.80 back (+$17.80)
- EUR/GBP — buy after a pullback: win, $38.20 back (+$18.20)
Strategy 1 total: 6 trades, 5 wins, 1 loss, +$66.40 on $120 staked.
Strategy 2: ZigZag + DeMarker
Settings, exactly as shown
- ZigZag: 5, 10, 2 (red line)
- DeMarker: period 14, levels 70 / 30
- Chart: Japanese candles on the 5-second timeframe
- Trade time: 1 minute
- Stake: $30 per trade
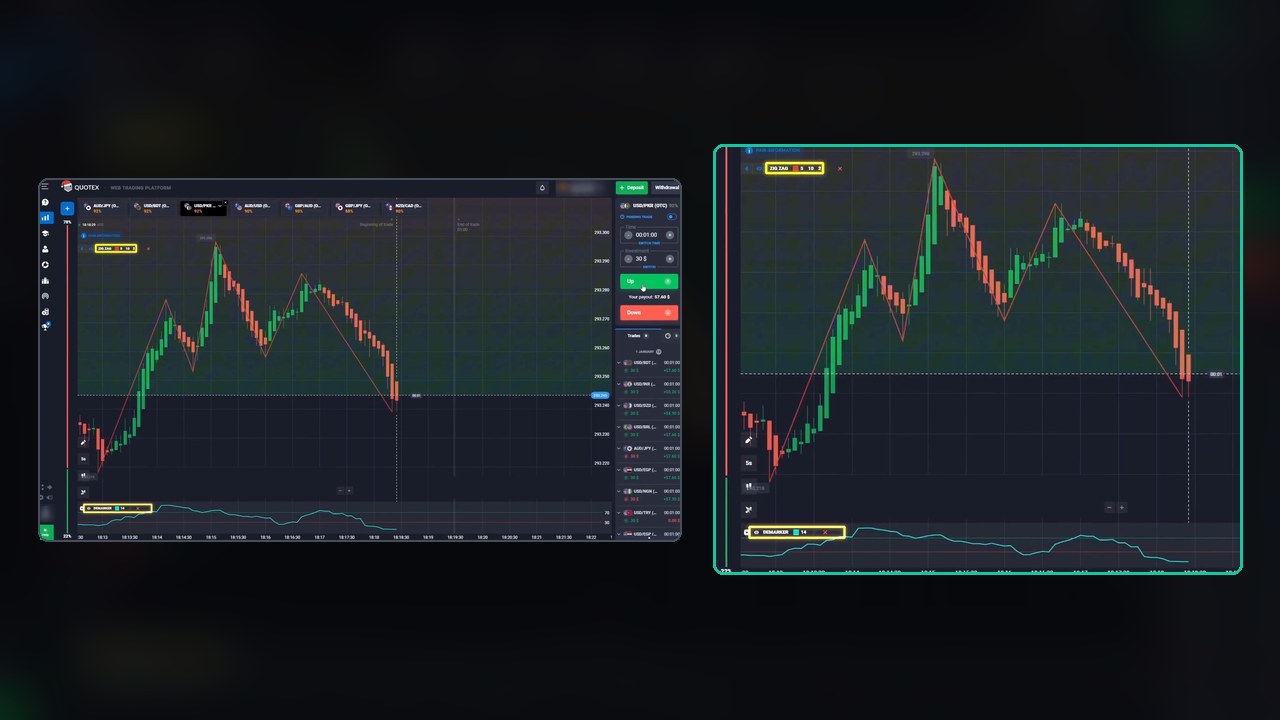
This one is simpler: one line on the chart and one oscillator underneath. DeMarker compares each candle's high and low with the one before it, so it reacts quickly to a run of lower lows or higher highs — a good fit for 5-second candles.
The entry rules
- Find a long ZigZag leg — a clear run down or up, not a choppy section.
- DeMarker at the extreme. Below 30 after a drop means buy. Above 70 after a rise means sell.
- Enter on the turn, for 1 minute. Wait for the first candle back against the leg.
A buy with DeMarker under 30: GBP/JPY OTC
GBP/JPY OTC falls from a ZigZag high in a long run of red candles. In the panel, DeMarker sinks under the 30 line and flattens (the yellow box in the video). The first green candle appears and the trader buys $30 for one minute.
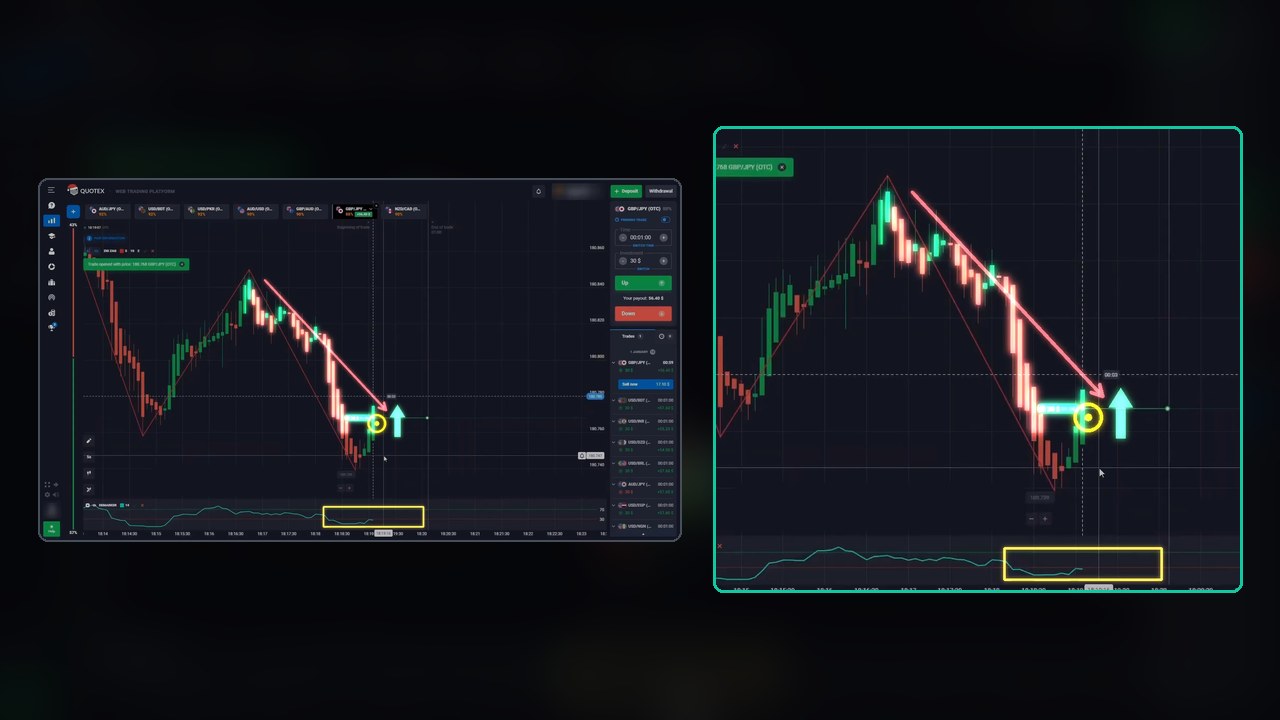
Price climbs back up through most of the leg. Result: $56.40 back, $26.40 profit at an 88% payout.
The loss: AUD/JPY OTC
AUD/JPY OTC rallied hard to a new ZigZag high, DeMarker went above 70, and the trader sold as the first red candles appeared. Price dipped, then chopped sideways and finished just above the entry.
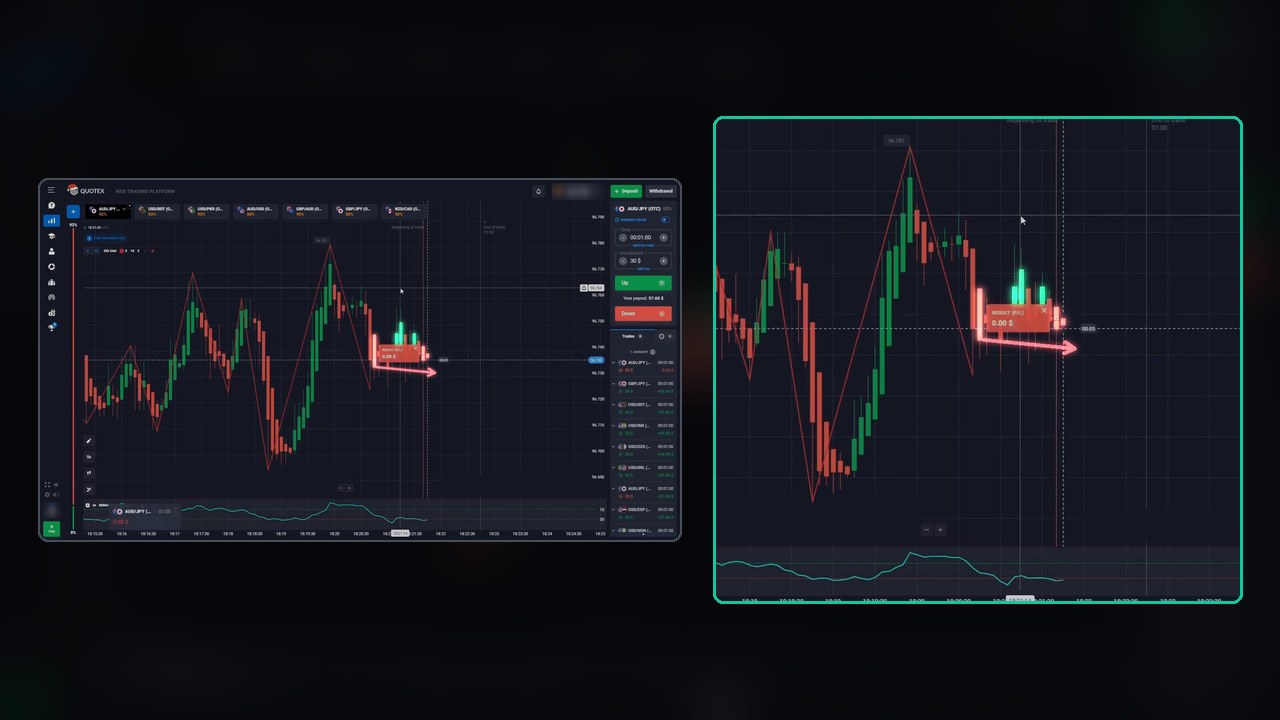
Result: $0.00 back, −$30.
Strategy 2 trades
- USD/INR OTC — buy after a drop: win, $55.20 back (+$25.20)
- USD/BDT OTC — buy after a drop: win, $57.60 back (+$27.60)
- GBP/JPY OTC — buy after a drop: win, $56.40 back (+$26.40)
- AUD/JPY OTC — sell after a rise: loss, $0.00 back (−$30)
Strategy 2 total: 4 trades, 3 wins, 1 loss, +$49.20 on $120 staked.
Both Strategies Together
10 trades, 8 wins, 2 losses, +$115.60 on $240 staked. Every trade was a single entry at a flat stake — no doubling up after a loss and no stacked entries, so the result comes from the signals alone. Payouts ranged from 82% to 92%; at around 85% you need to win roughly 54% of trades just to break even.
That is a good-looking session, and ten trades is still a very small sample. Use it as a reason to test the rules, not as proof that they work.
OTC and Regular Pairs
Strategy 1 was shown on a mix: EUR/USD, AUD/JPY, GBP/JPY and EUR/GBP are regular market pairs, while CAD/CHF and USD/INR are OTC. Every Strategy 2 trade was on an OTC pair. OTC prices come from the broker's own feed rather than the interbank market, so results on one kind of pair tell you nothing about the other. Test on the market you actually plan to trade.
Watch the Video
Both setups, the settings screens and all 10 trades, including the two losses:
Honest Weaknesses
- The ZigZag repaints. Its last leg keeps moving until a new swing is confirmed, so a leg that looks finished can still extend. Always judge the entry on the candles, not just the line.
- “Long leg” is judged by eye. The video gives no minimum length, so two traders will not pick the same setups.
- Fading a move fails when the move keeps going. Both losses here are a stretched move that went sideways instead of turning.
- Ten trades is a demonstration, not a test.
Turning It Into Rules You Can Test
- Pick one strategy and copy the settings exactly.
- Give “long leg” a number — for example, at least 15 candles in one direction — so you take the same trades every time.
- Only trade when the second tool agrees: price at the outer band with RSI near 20/80, or DeMarker past 30/70.
- One entry per setup, flat stake.
- Log 50 trades on a demo account before using real money, and compare your win rate with the break-even for your payout.
Risk Management
- Keep one stake for the session — no doubling after a loss.
- Set a daily loss limit and a maximum number of trades, and stop at either.
- Know your break-even: about 54% at an 85% payout, higher when the payout drops.
- Practise on a demo account first, and never trade money you cannot afford to lose.
Frequently Asked Questions
What are the settings for the ZigZag Bollinger RSI strategy?
ZigZag 3, 13, 2; Bollinger Bands period 12 with deviation 3; RSI period 12 with levels 80 and 20. Japanese candles on the 5-second chart with 1-minute trades.
What are the settings for the ZigZag DeMarker strategy?
ZigZag 5, 10, 2 and DeMarker period 14 with levels 70 and 30, on 5-second candles with 1-minute trades.
When do you buy and when do you sell?
After a long ZigZag leg down, when price reaches the lower Bollinger Band with RSI near 20, or DeMarker drops below 30, you buy for 1 minute on the first candle back up. After a long leg up, with price at the upper band and RSI near 80, or DeMarker above 70, you sell.
What was the result in the video?
10 trades: Strategy 1 won 5 of 6 at $20 each (+$66.40) and Strategy 2 won 3 of 4 at $30 each (+$49.20), for +$115.60 in total. Every trade was a single flat-stake entry.
The Verdict
4.5 out of 5. Two clear strategies built from free, built-in Quotex indicators, with the exact settings shown on screen and every trade kept in, losses included. No stacking, no doubling — the result comes from the rules alone, which makes this one of the cleaner sessions we have logged.
The missing half star: the ZigZag repaints, the “long leg” is judged by eye, and ten trades is far too few to call either strategy proven. Pick one, give its rules a number, and let a logged demo sample decide.
#Quotex #ZigZag #TradingStrategy #BollingerBands #RSI #DeMarker #1MinuteTrading #TechnicalAnalysis
This content is for educational purposes only and is not financial advice. Trading involves substantial risk; you can lose some or all of your capital. No result is guaranteed and past results do not indicate future outcomes. Always practise responsible money management, limit your daily trades, and trade only what you can afford to lose.
Related reading: an earlier ZigZag and DeMarker setup on Quotex and ZigZag with TMA on 15-second candles. For more on this platform, see the Quotex hub and the strategy library.