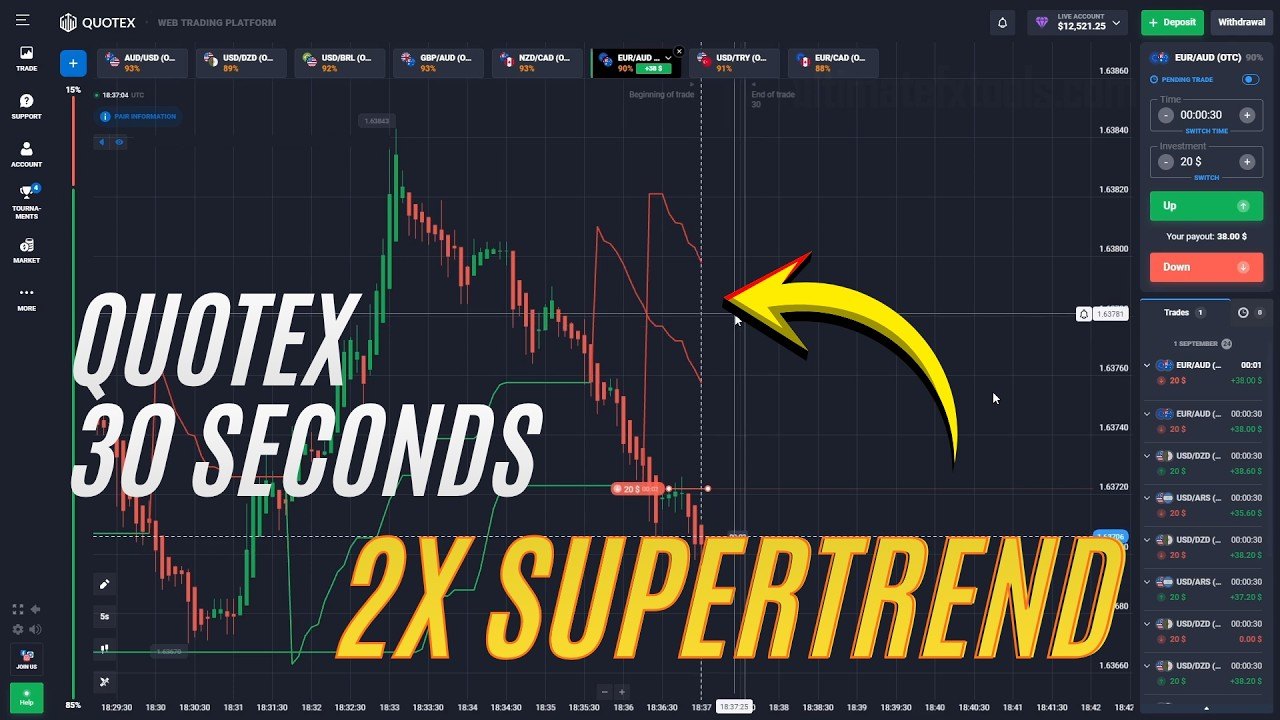
The video says "the exact settings are in the guide linked below." This is that guide.
The setup itself is about as cheap as trading gets: one free built-in indicator, added to the chart twice, at two different speeds. No download, no purchase, nothing to install. What makes it work is that the two copies are given different jobs.
The chart
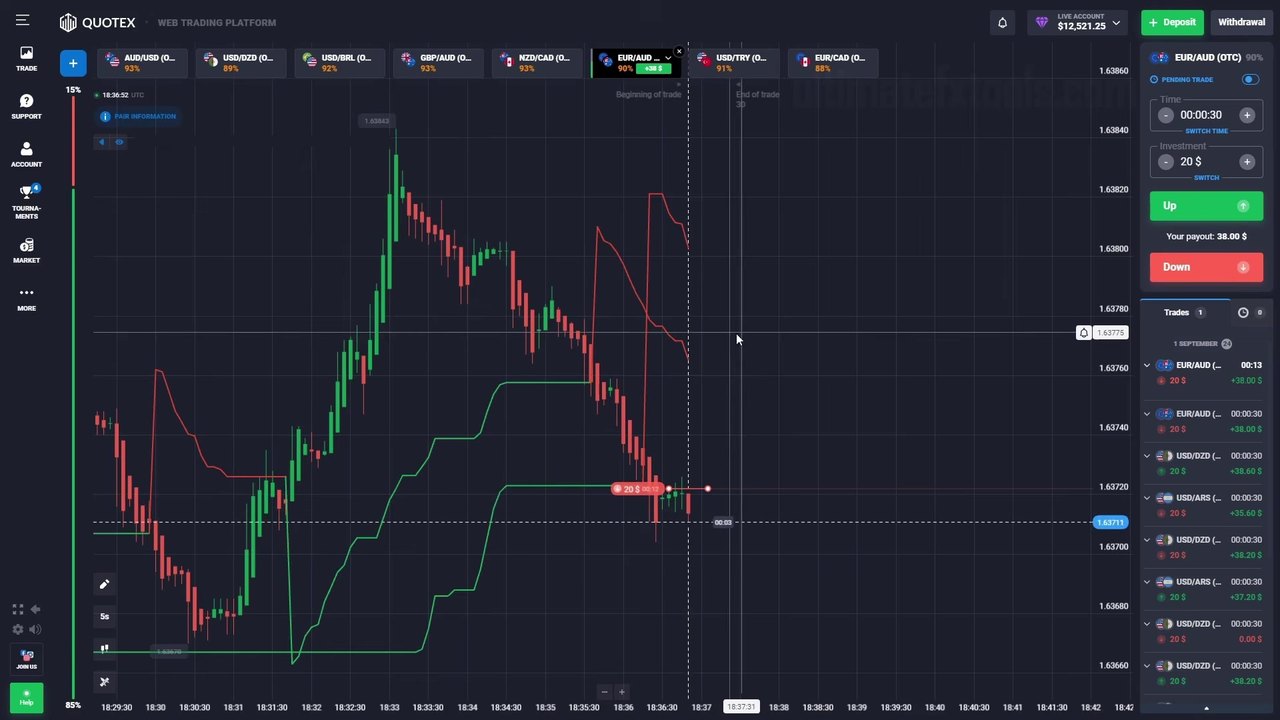
| Setting | Value | Why |
|---|---|---|
| Market | Quotex OTC | Available at weekends; broker-generated prices |
| Candle time | 5 seconds | About six candles form inside each trade |
| Chart type | Heikin Ashi | Smooths the noise — read the caution below |
| Expiry | 30 seconds | Long enough for the fast line to be proved right or wrong |
| Stake | $20 flat | No increasing after a loss |
| Payouts seen | 88–93% | Break-even 51.8–53.2% |
The settings the video leaves out
SuperTrend takes two numbers: an ATR period and a multiplier. The period sets the volatility window it measures; the multiplier sets how far from price the line sits, and therefore how willing it is to flip. Two pairs are published on this site, and they are not interchangeable — they trade at different speeds:
| Pair | Fast line (timing) | Slow line (direction) | Character |
|---|---|---|---|
| Responsive | ATR 10, multiplier 1 | ATR 10, multiplier 3 | More signals; shared period so both read the same window |
| Calmer | period 14, multiplier 4 | period 15, multiplier 7 | Far fewer signals; survives chop better |
Start with one pair. If the fast line flips too often on your pair, raise its multiplier toward 1.5 or 2 rather than changing both numbers at once — change one thing and you can tell what the change did.
The rule
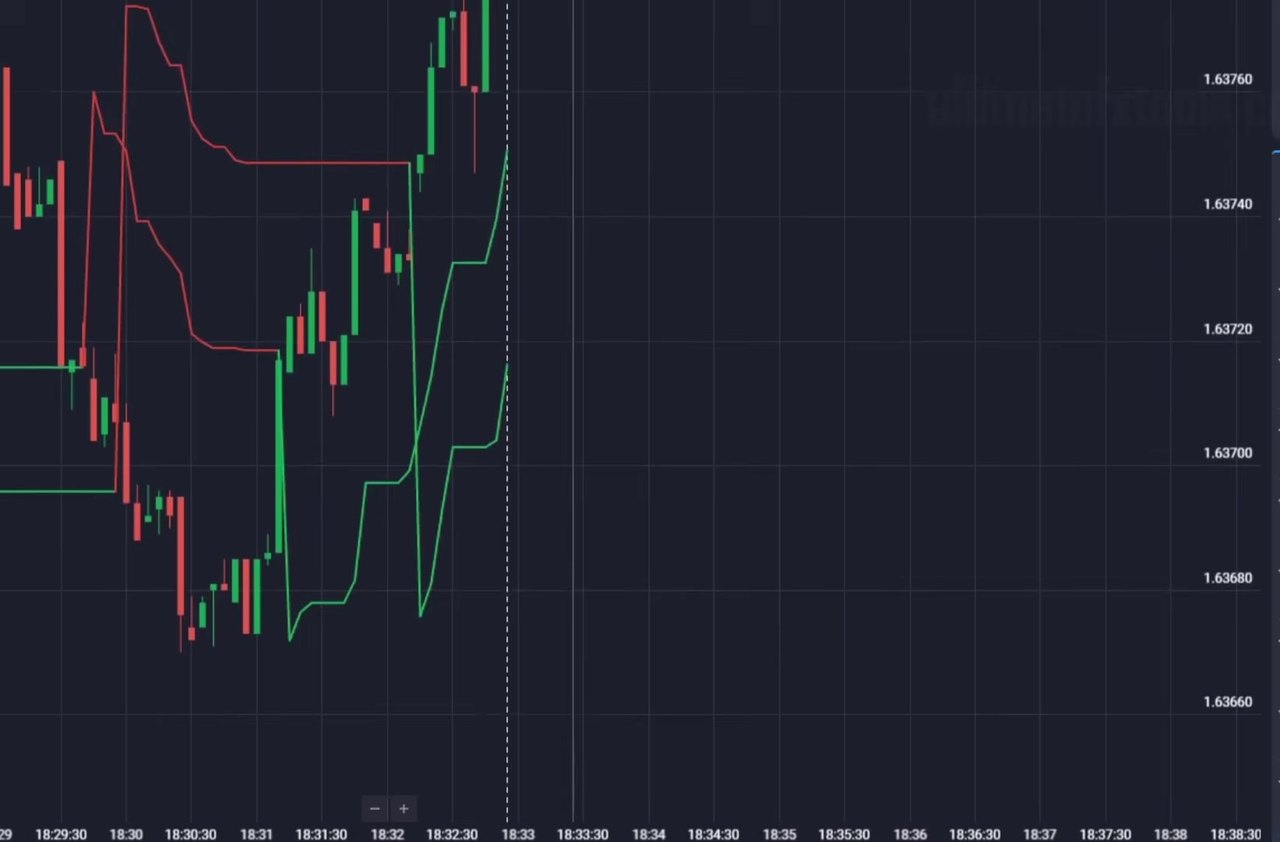
The two lines split the work, and the whole method is that split:
- The slow line sets direction. While it is red you may only look for downs; while it is green, only ups.
- The fast line times the entry. When it flips into the direction the slow line already points, that is the trade.
- Disagreement is a skip. Two lines pointing opposite ways means the market is ranging or turning, which is the condition a 30-second expiry handles worst.
The session repeats exactly this across EUR/AUD, AUD/USD, NZD/CAD and USD/TRY. It is one rule applied to different pairs, which is the sign of a method rather than a story.
The Heikin Ashi catch
This is the part worth more than the settings, and almost nobody mentions it.
A Heikin Ashi candle does not plot the real open, high, low and close. It plots averages of them. That is why the chart looks so much cleaner, and it is genuinely useful for reading trend direction at speed.
But your binary trade settles on the real price, not on the averaged candle. Those are different numbers. A Heikin Ashi candle can still be showing green while actual price has already rolled over — the averaging lags reality by design.
So: use Heikin Ashi to read the shape of the trend. Never read it as confirmation that the last tick went your way, and never be surprised when a trade that "looked green on the chart" settles red. The chart was never showing you the settlement price.
About the 75–85% figure
The video opens with results from its own tracking: "somewhere around 75 to 85% of the time" over the last few sessions, immediately followed by "that is past performance from our own tracking, not a promise for the next trade. So keep the stake small and fixed."
The caveat is the right one and we would not dress it up further. Read the number as a rough self-report rather than a measurement: no sample size is given, and "a few sessions" is a small, self-selected window. For comparison, when we measured hour-of-day effects properly across 23 years of data, we put the sample count and significance next to every single cell — because without those, a percentage is an anecdote with a decimal point.
The more useful number is in the session itself. One alignment trade closed red, and the narration says so as it happens: "Not every alignment works out. That is exactly why the stake stays small and fixed." The closed-trades panel on the right of the screen carries other $0.00 rows too. A method that shows its losses on screen is easier to trust than one quoting a range.
The payout still sets the bar
The pairs in this session pay 88% to 93%, which is the friendly end of OTC. That decides how often you need to be right just to stand still:
| Payout | Win rate to break even |
|---|---|
| 93% | 51.8% |
| 90% | 52.6% |
| 88% | 53.2% |
| 75% | 57.1% |
If two pairs both give you a clean alignment and you can only take one, take the better-paying one. The full arithmetic is in the payout filter post.
Two limits
It is an OTC session. Every pair on screen is OTC — broker-generated prices, available at weekends, and behaving differently from weekday market pairs. Results here do not automatically carry across, so test both. MetaTrader cannot read an OTC feed at all, so there is no cross-checking this setup on MT4 or MT5.
Chop is where it fails. When price drifts sideways, the fast line flips constantly and every flip looks like an alignment for a second or two. The setup has no filter for this. If the slow line has been flat and the fast line has flipped three times in a minute, the honest answer is to stop trading for a while, not to keep taking the flips.
Why 4 and not 5
The method is clean, the indicator is free and built in, the rule is one sentence, and the session applies it consistently across several pairs with a flat stake and a losing trade left in. The Heikin Ashi choice is a genuine improvement to readability at 5-second speed.
It falls short of a 5 on two counts. The video does not state its own settings, which is why this page exists. And the 75–85% range, however well caveated, is a self-tracked figure over a handful of sessions rather than something measured — take the rule, not the percentage.
The session
Trading carries substantial risk and you can lose your capital. Nothing here guarantees a result, self-reported past performance does not predict future performance, and short expiries are the least forgiving format there is. Test on a demo account first and never stake money you cannot afford to lose.