Four Indicators, Three Questions
Stacking indicators usually goes wrong because they all answer the same question — three trend tools agreeing tells you nothing three times over. This setup avoids that by giving each one a separate job:
- EMA 5 crossing EMA 20 — which way? The fast average crossing the slow one is the direction call, and nothing else on the chart overrides it.
- RSI 14 — is there conviction behind it? Not the 70/30 overbought reading, just whether RSI is leaning the same way as the cross.
- Stochastic (14, 3, 3) — is now the moment? The %K/%D turn is the timing trigger, which is what a 1-minute expiry actually lives or dies on.
Direction, conviction, timing. When all three line up you have an entry; when they disagree you have a reason to skip, and the skipping is most of the edge.
The Setup
- Platform: Pocket Option, OTC pairs at 92% payout
- Chart: Heikin Ashi candles on a 5-second timeframe
- Expiry: 1 minute
- Moving averages: EMA 5 and EMA 20 (Moving Average → type EMA)
- RSI: period 14, in its own pane
- Stochastic Oscillator: 14, 3, 3, in its own pane
- Stake: flat $10 on every entry
Both averages are added from the same Moving Average tool — set the period, then switch the type from the default to EMA. That second step is the one people miss: leaving it on SMA gives a slower line that crosses late, which on a 1-minute expiry is the difference between an entry and a post-mortem.
Why Heikin Ashi at 5 Seconds
Five-second candles produce a lot of noise, and Heikin Ashi is a smoothing transform — each candle is averaged with the one before it, so a run of one colour reads as a run instead of a scribble. That is genuinely useful here, and it comes with a cost worth stating plainly: Heikin Ashi candles do not show the real open and close. The wick you would normally use to judge rejection is partly smoothed away, so the price you enter at is not the price the candle appears to show.
The Entry
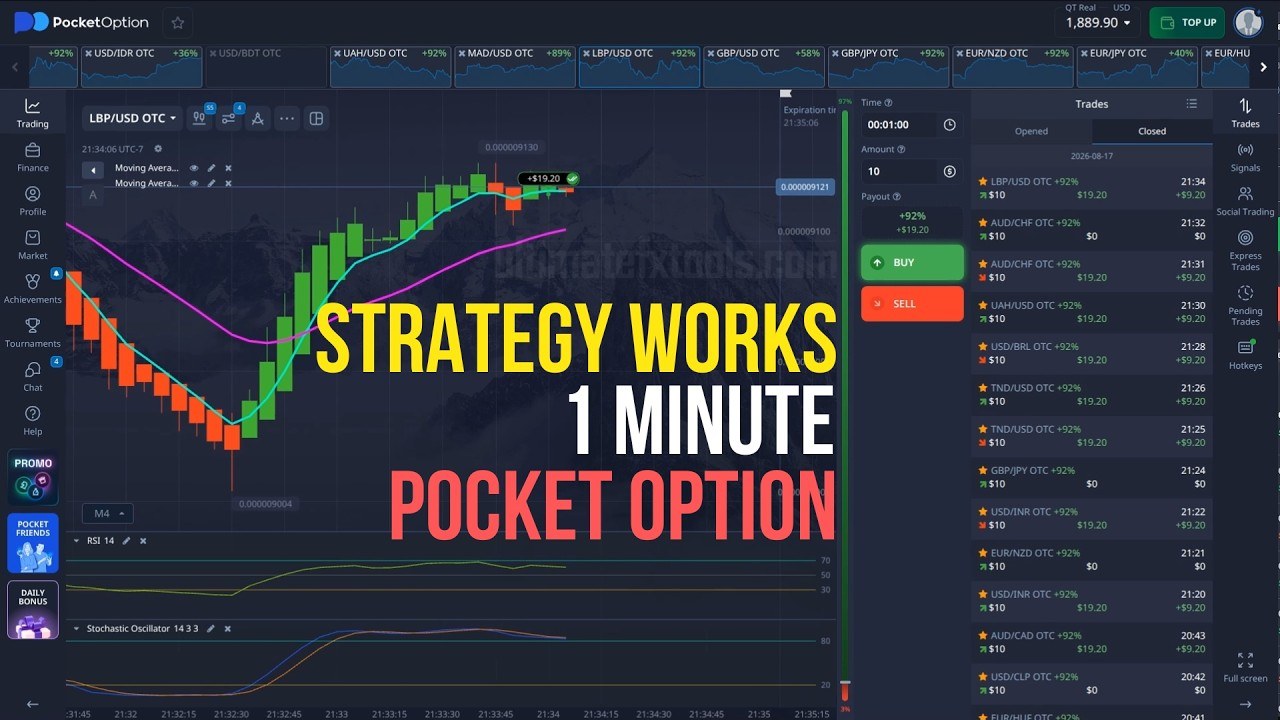
This is the picture the method waits for. EMA 5 has crossed above EMA 20 and both are turning up together; RSI is climbing rather than flat; the Stochastic has turned up out of the lower zone rather than already sitting pinned at the top. The Heikin Ashi candles have flipped green and are holding above the fast average.
The reverse is a sell: EMA 5 crossing below EMA 20, RSI leaning down, Stochastic rolling over from the upper zone. Entry goes in at the open of the next candle, expiry 1 minute, stake unchanged.
The Setup to Skip
The video is worth watching for this one as much as for the winners. Here the cross has technically happened, but price has already run a long way from EMA 20 and the Stochastic is at an extreme rather than turning out of one. Everything a checklist would tick is ticked — and the trade is late.
The rule that follows: the further price sits from EMA 20 when the signal arrives, the worse the entry. A cross is only worth taking while the two averages are still close together, because that is what "the move is starting" looks like. Once they have separated, you are buying the end of a move on a one-minute clock.
The Payout Maths
At the 92% payout on these OTC pairs, break-even is a 52.1% win rate (100 ÷ 192). Worth knowing before the same setup gets taken to a pair paying 70%, where break-even climbs to 58.8% — the strategy did not get worse, the arithmetic did.
The Session, Honestly
Every entry is a flat $10 at 92%, so a win returns $19.20 and a loss costs the stake. The trade log across the session shows 13 entries between 21:20 and 21:39: 10 green and 3 red (EUR/NZD, GBP/JPY and the second AUD/CHF), with the balance moving from $1,845.50 to $1,908.30. Pairs traded: USD/INR, EUR/NZD, TND/USD, USD/BRL, UAH/USD, AUD/CHF, GBP/JPY and LBP/USD.
Three things belong beside that number:
- Thirteen trades is a demonstration, not evidence. Break-even is 52.1%; 10 of 13 clears it comfortably, but a sample this size would look like this fairly often by luck alone. A month of logged sessions is the only thing that settles it.
- These are OTC pairs. Weekend and off-hours OTC pricing is generated by the broker, so nothing here transfers automatically to live-market pairs.
- Two of the losses came on back-to-back entries. AUD/CHF was traded twice in two minutes — the second one lost. Re-entering the same pair immediately is the most common way a good session turns into a bad one.
Watch the Full Setup and Session
The indicator setup from scratch, the entry checks, the weak position, and every trade:
Honest Weaknesses
- Three confirmations can all be wrong together. EMA, RSI and Stochastic are all derived from the same closing prices — they are less independent than the checklist makes them feel, and in a sideways market they agree at exactly the wrong moments.
- Heikin Ashi hides your real entry price. The candle is an average; the fill is not. On a 1-minute expiry that gap matters more than it does on an hourly chart.
- Five-second candles demand constant attention. A signal is stale within seconds. This is not a setup you can check between other things.
- The skip rule is doing the heavy lifting. Most of the value here is in not taking the stretched setups — and that is judgement, not a rule a checklist can enforce for you.
- OTC only in this session. Broker-generated pricing behaves differently from the live market; treat the two as separate questions.
Risk Management Rules
- Flat stake, fixed before the session. Never raise it to win a loss back.
- Skip the cross when price has already stretched away from EMA 20 — late is the same as wrong here.
- One entry per pair at a time, and no immediate re-entry after a loss on that pair.
- Cap the session with a trade count or a loss limit and honour it.
- Run it on a demo account until the three-part check is automatic.
The Verdict
4.5 out of 5. What earns it: every indicator answers a different question, so the confirmations are doing real work rather than repeating each other; all four tools are free inside Pocket Option with nothing to install; the entry check is specific enough to follow; and the video shows a weak setup alongside the winners, which is the part most strategy videos leave out.
The missing half star is honest about what the checklist cannot carry: the tools share the same input data, Heikin Ashi obscures the price you actually get filled at, and the "is it too stretched?" judgement — the one that separates a good entry from a late one — stays with you. Learn that call on demo and the rest of the method is simple enough to run.
#PocketOption #1MinuteStrategy #EMA #RSI #StochasticOscillator #HeikinAshi #BinaryOptions #OTCTrading #TradingStrategy
Frequently Asked Questions
What indicators does this Pocket Option 1-minute strategy use?
Four, all built into Pocket Option: EMA 5 and EMA 20 for direction, RSI 14 for conviction, and the Stochastic Oscillator set to 14, 3, 3 for timing. They are read on Heikin Ashi candles at a 5-second timeframe with 1-minute expiries.
What is the entry rule?
All three checks must agree: EMA 5 crossing EMA 20 gives the direction, RSI leaning the same way confirms conviction, and the Stochastic turning out of a zone provides the timing. The entry is taken at the open of the next candle with a 1-minute expiry.
When should the signal be skipped?
When price has already stretched a long way from EMA 20 by the time the cross happens, or when the Stochastic is sitting at an extreme instead of turning out of one. A cross is worth taking while the two averages are still close together; once they have separated the move is usually over.
Why use Heikin Ashi candles, and what is the drawback?
Heikin Ashi averages each candle with the previous one, which makes a run of direction readable on noisy 5-second data. The drawback is that the candles do not show the real open and close, so the price you are filled at differs from the price the candle appears to show.
What win rate does a 92% payout need to break even?
About 52.1%, calculated as 100 divided by 192. On a pair paying 70% the same setup would need roughly 58.8%, so the payout on the pair changes the maths before the strategy does.
This content is for educational purposes only. Trading involves risk. Past results do not guarantee future outcomes. Always practice responsible money management and only trade money you can afford to lose.
Want a slower version of the same crossover idea? See the DeMarker + MA cross on 15-second candles. For the same Heikin Ashi read with an AI second opinion, see the PipGems AI Chart Scanner setup, or drop indicators entirely with support and resistance. Every setup lives on the strategies hub.