Two Free Indicators, One Simple Reversal Rule
This Olymp Trade session needs nothing you have to download. It uses two indicators already in the platform’s list: Bollinger Bands to show when price is stretched, and Zig Zag to show when a swing has run its full length. When a Zig Zag leg reaches the edge of the bands, the trade goes the other way.
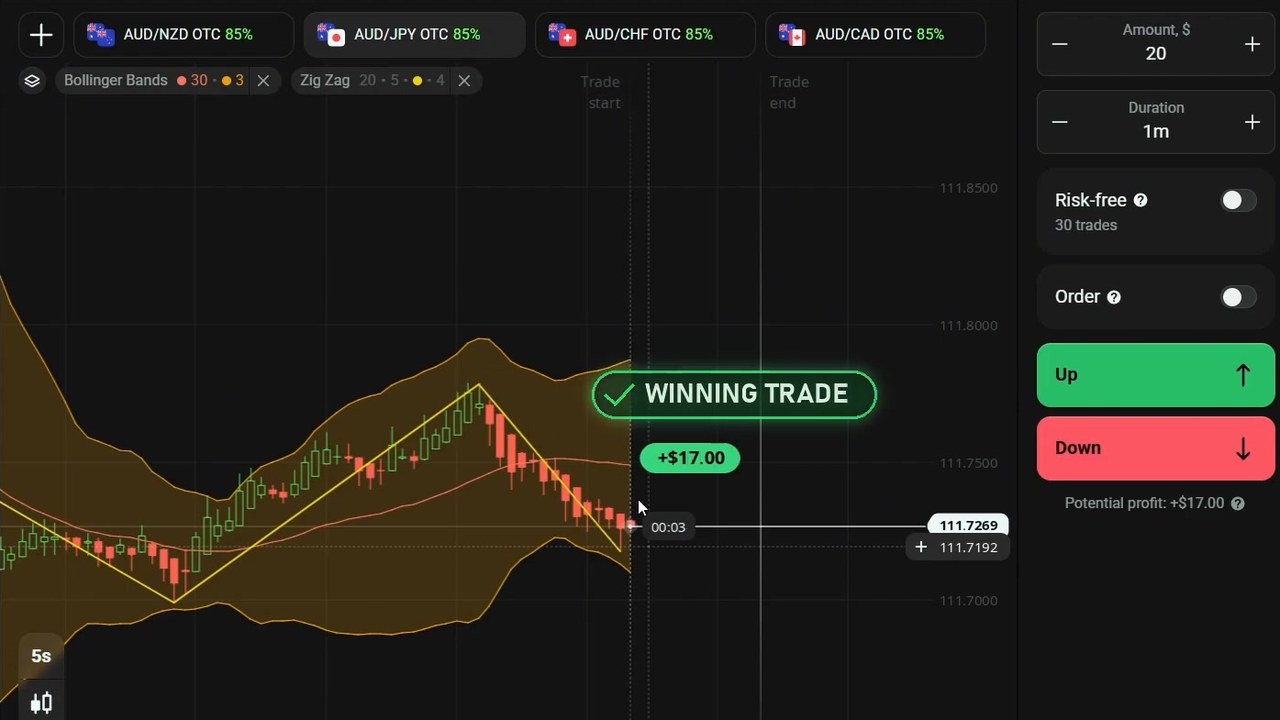
Every trade in the video runs on OTC pairs, with 5-second Heikin Ashi candles, a flat $20 stake, 1-minute expiries and an 85% payout (+$17 on a win). Four trades are taken on screen and all four close green. We read every value off the frames and checked each result against the trade history and the account balance.
The Settings, Exactly as Shown
Both settings panels are opened on camera, so nothing here is a guess:
| Item | Setting |
|---|---|
| Bollinger Bands | SMA 30, Standard deviation 3 (changed from the default 20 / 2) |
| Zig Zag | Depth 20, Deviation% 5, Back Step 4 |
| Chart | Heikin Ashi candles, 5-second timeframe |
| Assets | AUD/NZD, AUD/JPY, AUD/CHF, AUD/CAD and CAD/JPY, all OTC at 85% |
| Trade | Fixed Time, 1 minute, $20 flat, +$17 on a win |
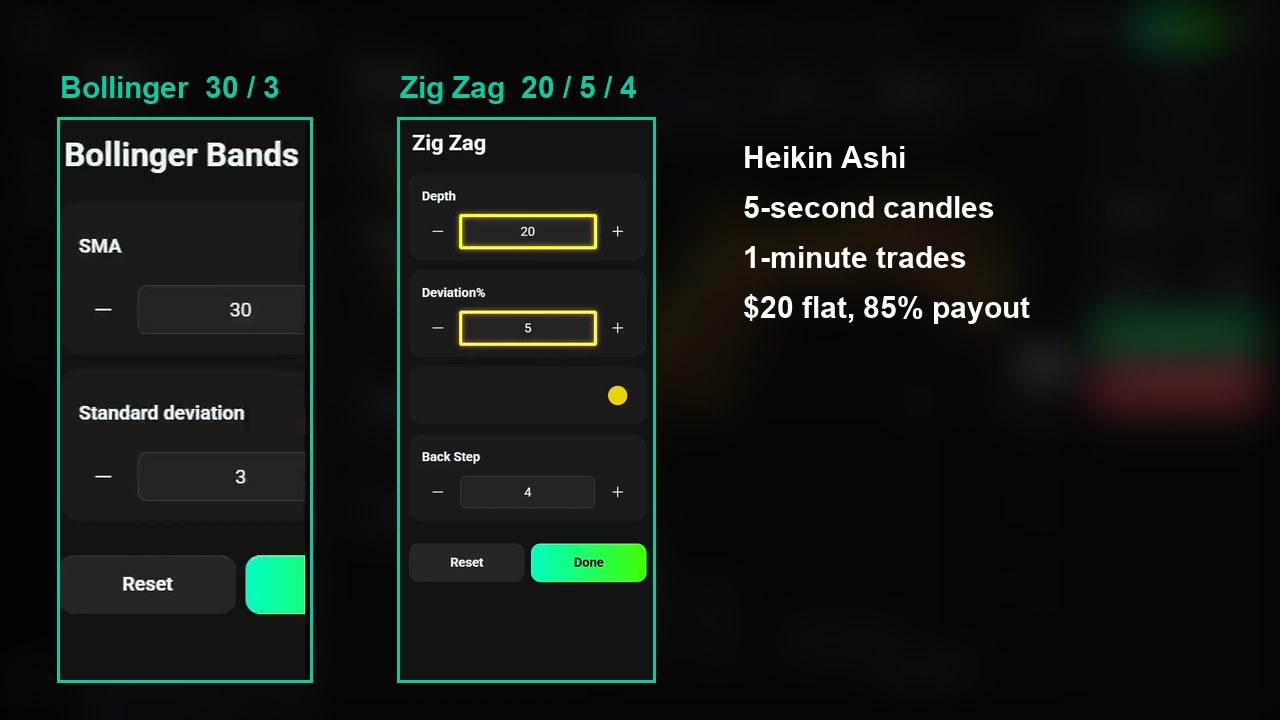
The standard deviation matters most. The trader steps it from 2 to 2.5 and then to 3. At 3 the bands sit much further from the middle line than the default, so price touches them far less often. The setup only fires after a real stretch, and that is the point of the change.
What Each Indicator Does
Bollinger Bands: How Far Price Has Stretched
The middle line is a 30-period simple moving average. The upper and lower bands are drawn 3 standard deviations above and below it. When volatility rises the bands open out, and when it falls they pinch in. A candle at the outer edge of 3-deviation bands is unusually far from its average.
Zig Zag: Where the Swing Ends
Zig Zag ignores small wiggles and joins the swing highs and lows with straight lines. At Depth 20 and Deviation 5 it draws a few long legs instead of many short ones. A leg that has climbed or fallen all the way to a band is a move that has already gone a long way, which is what you want before you trade against it.
One caution. The last Zig Zag leg is always provisional. It keeps extending while price moves, and it can redraw. Use it to read the size of the swing, not as a signal that has already been confirmed.
How to Add Them on Olymp Trade
- Open an OTC pair. The video works across AUD/NZD, AUD/JPY, AUD/CHF, AUD/CAD and CAD/JPY OTC, all paying 85%.
- Set the timeframe to 5s and the chart type to Heikin Ashi from the buttons at the bottom-left of the chart.
- Open Technical Analysis → Indicators, add Bollinger Bands, and change it to 30 and 3.
- Add Zig Zag from the same list and set 20 / 5 / 4.
- Set the trade to 1m and keep the stake the same on every trade.
The Entry Rules
The video has no voiceover. The rules below come from the boxes and arrows the trader draws on screen just before each entry:
- DOWN: a Zig Zag leg climbs all the way to the upper band and price pokes into it. Enter DOWN when the first red Heikin Ashi candle appears.
- UP: the mirror image. A leg falls to the lower band and price pushes through it. Enter UP as the candles stop falling.
- Expiry: 1 minute, flat stake.
- Skip: when price is in the middle of the bands, or the Zig Zag leg is short, there is no stretch to fade. Wait.
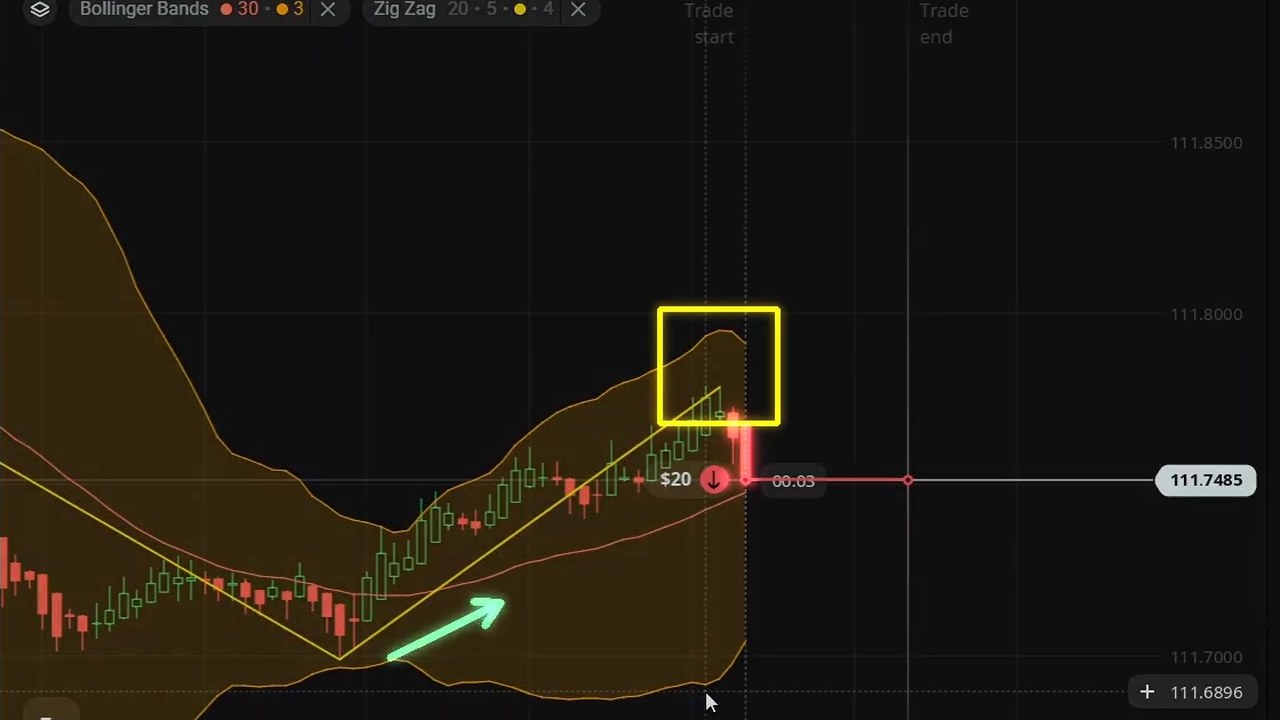
Trade 1 is the cleanest example. The trader draws an arrow along the rising leg, boxes the spot where it reaches the upper band, and places a $20 DOWN trade as the first red candle forms.
All Four Trades, Checked
The balance before the first trade is $1,400.74. Each trade takes $20 off the balance when it opens and pays back $37 on a win ($20 stake plus $17 profit), so every step can be read from the top of the screen.
| # | Asset | Direction | What the chart showed | Result |
|---|---|---|---|---|
| 1 | AUD/JPY OTC | DOWN | Zig Zag leg up into the upper band, first red candle | +$17.00 |
| 2 | AUD/CHF OTC | UP | Steep leg down, price pushed below the lower band | +$17.00 |
| 3 | AUD/JPY OTC | DOWN | Second leg up to the upper band | +$17.00 |
| 4 | CAD/JPY OTC | DOWN | Long rally riding the upper band, leg tip at the top | +$17.00 |
The balance steps match. It goes from $1,400.74 to $1,380.74 as trade 1 opens and to $1,417.74 when it wins. The same pattern repeats through trade 3, which leaves the balance at $1,451.74. The video freezes while the counter is still updating after trade 4, but the history panel lists that trade as +$17.00. Four wins of $17 is +$68 for the session.
The history panel also shows earlier trades from that day, including two −$20 losses on AUD/NZD. Those are not taken on camera, so they are not counted here, but they are a reminder that the session shown is not the whole day.
Trade 1: AUD/JPY, the Textbook Entry
The leg climbs steadily from the lower band and reaches the top band. The first red Heikin Ashi candle appears and the trader goes DOWN at 111.7485. Price rolls over right away and the trade closes at 111.7269, comfortably in profit.
Trade 2: AUD/CHF, Red Before It Went Green
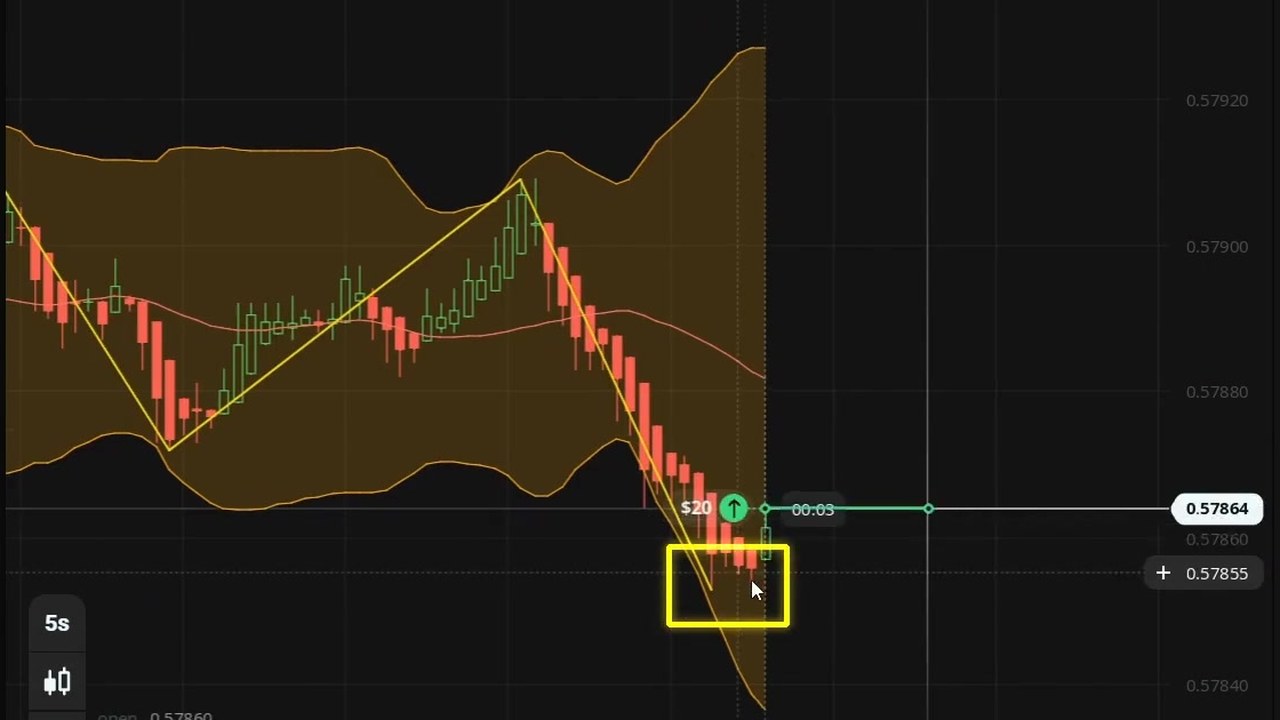
AUD/CHF drops in one steep leg and pushes through the lower band. The trader boxes the spot and goes UP at 0.57864. For the first few seconds price keeps falling (0.57851 at one point), so the trade starts out losing. Then the bounce comes and it closes +$17. On a 1-minute expiry, fading a hard push can mean sitting through a red start.
Trade 3: AUD/JPY Again
Back on AUD/JPY, a second leg up brings price back to the upper band. The trader boxes it, adds an arrow along the leg, and goes DOWN at 111.7450. The trade wins +$17.
Trade 4: CAD/JPY, Selling Into a Strong Trend
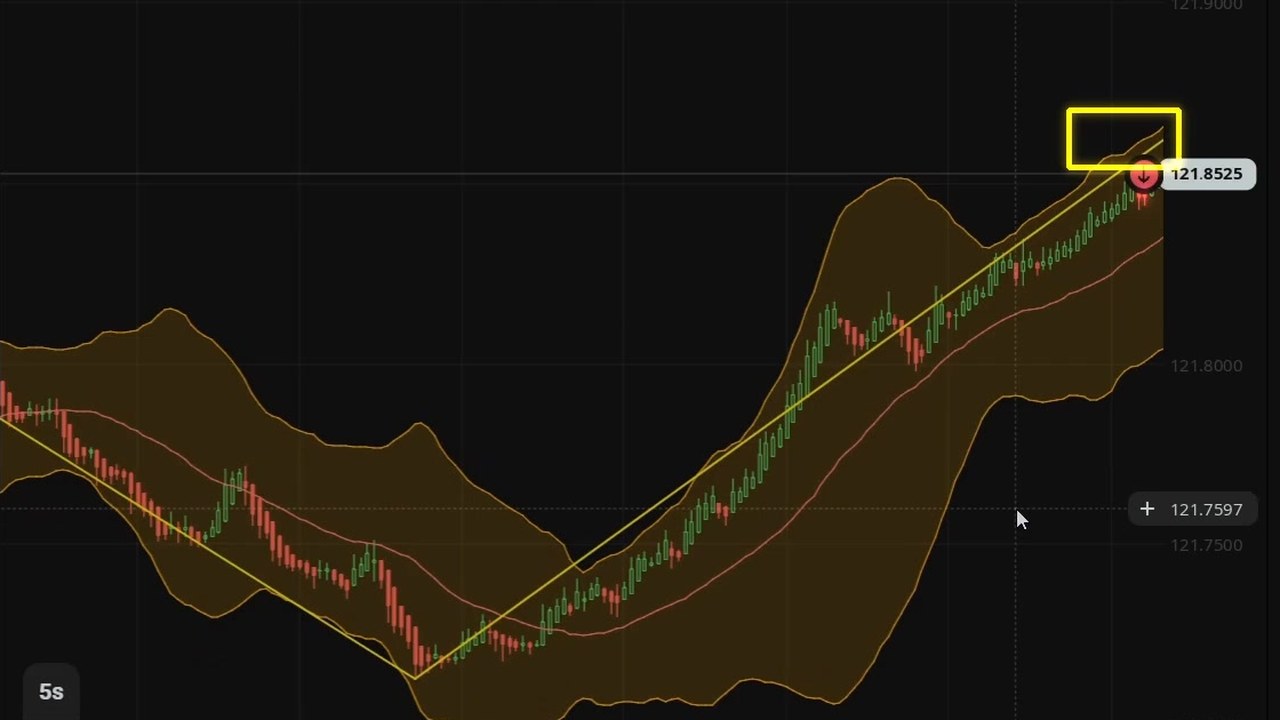
The last trade is the riskiest in the video. CAD/JPY has rallied for several minutes and price is riding the upper band rather than just touching it. The trader marks the tip of the Zig Zag leg at the top and goes DOWN near 121.85. A small pullback comes in time and the trade wins. Still, a market that keeps closing along the upper band is a trend, not a stretch, and that is where this rule usually loses. Treat this win as luck of the timing, not as proof.
Video Chapters
- 0:00 Preview of two winning trades
- 0:16 The bare chart and the four OTC pairs
- 0:32 Heikin Ashi on 5-second candles
- 0:36 Adding Bollinger Bands, set to 30 / 3
- 0:52 Adding Zig Zag, set to 20 / 5 / 4
- 1:04 What a full leg into the band looks like
- 1:28 Trade 1: AUD/JPY DOWN, won
- 2:00 Trade 2: AUD/CHF UP, won after a red start
- 2:36 Trade 3: AUD/JPY DOWN, won
- 3:08 Trade 4: CAD/JPY DOWN against the trend, won
Watch the Video
Just over four minutes, with both settings panels and all four trades:
Limits to Keep in Mind
- Four trades is a demonstration, not a record. At an 85% payout you need to win about 54% of trades just to break even. Four wins in a row cannot tell you whether the method clears that.
- OTC prices are set by the broker. OTC pairs run when the real market is closed, on the broker’s own price feed. A setup that works on OTC may behave differently on a regular pair.
- Zig Zag redraws. The leg you see at the moment of entry can extend after you trade. Judge the size of the swing, and wait for the candle colour to change before you enter.
- No narration. The rules come from the trader’s boxes and arrows. Write your own version down before you test it.
- Strong trends break the rule. When price rides the band for many candles, fading the touch is how this setup loses. Trade 4 got away with it.
Risk Management
- Keep the stake flat. The video uses $20 on every trade, with no doubling.
- Set a daily loss limit and a maximum number of trades before you start, and stop when you hit either one.
- Practise on the Olymp Trade demo account, then log at least 50 trades before you risk real money.
- Binary and fixed-time trading is restricted in some countries, so check the rules where you live, and only trade money you can afford to lose.
Frequently Asked Questions
What are the Bollinger Bands and Zig Zag settings in this Olymp Trade strategy?
Bollinger Bands: SMA 30, standard deviation 3 (changed from the default 20 and 2). Zig Zag: depth 20, deviation 5 percent, back step 4. The chart uses Heikin Ashi candles on the 5-second timeframe, and trades are 1-minute Fixed Time on OTC pairs paying 85 percent.
What is the entry rule?
Wait for a Zig Zag leg to run all the way to a Bollinger Band. If the leg climbs to the upper band, enter DOWN on the first red Heikin Ashi candle. If it falls to the lower band, enter UP as the candles stop falling. Skip setups where price is in the middle of the bands.
Why use a standard deviation of 3 instead of 2?
At 3 the bands sit much further from the middle line, so price touches them far less often. The setup then only fires after a real stretch, which cuts the number of weak signals.
Does the Zig Zag indicator repaint?
Its last leg does. The final Zig Zag line keeps extending while price moves and can redraw, so use it to judge how far a swing has run, and wait for the candle colour to change before you enter.
What was the result in the video?
Four $20 trades at an 85 percent payout, all four wins at +$17, for +$68. The balance steps match each trade. The history panel also shows two earlier $20 losses on AUD/NZD that are not taken on camera. Four trades is too few to judge the method, so test it on a demo account first.
The Verdict
4.5 out of 5. Both settings panels are shown clearly, the change from 20 / 2 to 30 / 3 is visible, the entry rule is simple enough to see on every trade, and all four results check out against the balance and the history panel. It loses half a point because nothing is explained out loud, the sample is small, and the last win came from selling into a strong trend, which is the setup’s weak spot.
As a starting point it is one of the cleaner OTC setups on the channel. Wide Bollinger Bands for the stretch, a full Zig Zag leg for the swing, and the first opposite candle as the trigger. Test it on a demo account, add your own skip rule for trending markets, and let your own log decide.
#OlympTrade #BollingerBands #ZigZag #OTCTrading #HeikinAshi #BinaryOptions #1MinuteStrategy
This content is for educational purposes only and is not financial advice. Trading involves substantial risk; you can lose some or all of your capital. No result is guaranteed and past results do not indicate future outcomes. Always practise responsible money management, limit your daily trades, and trade only what you can afford to lose.
Related reading: Zig Zag is paired with an EMA cross in Olymp Trade ZigZag + EMA Cross on 5-second candles, and with live signals in ZigZag + AI Scanner on Olymp Trade. For a trend-following setup instead, see the 3 moving averages 1-minute strategy. For more, browse the Olymp Trade hub or the full strategy library.