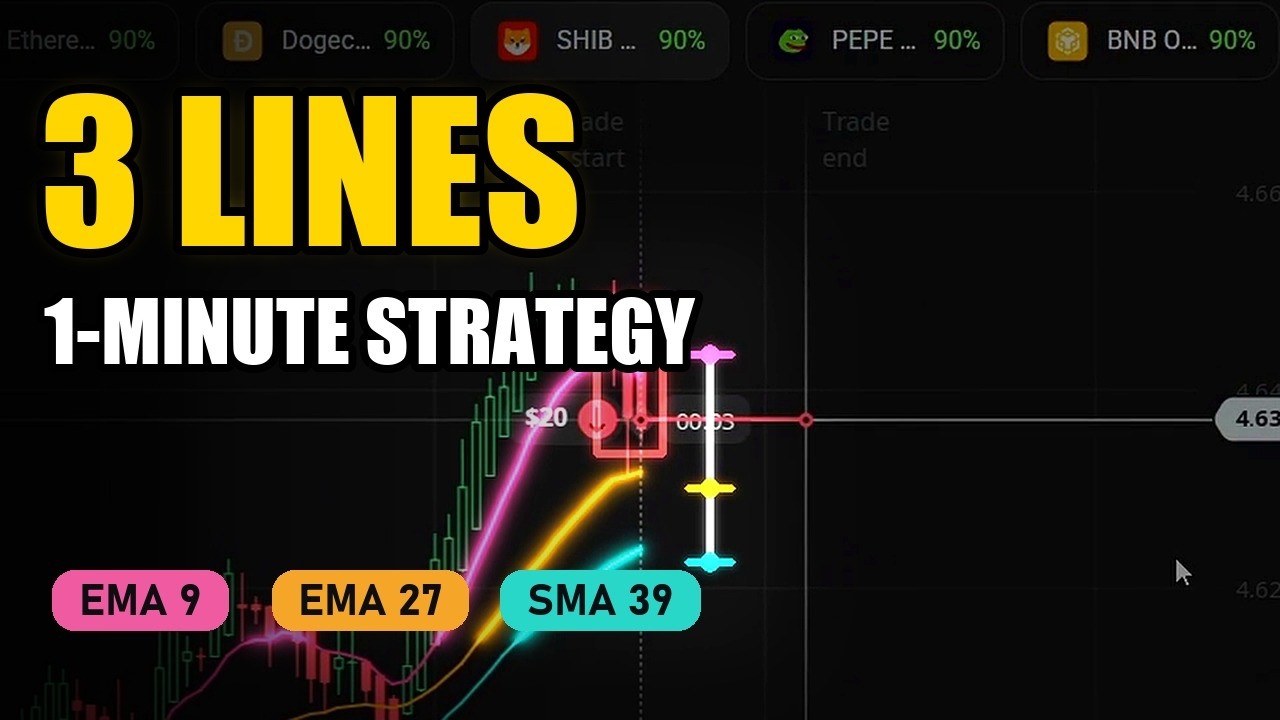
Three Lines, One Rule That Matters
This is one of the cleanest strategies on the channel. Three moving averages, one minute per trade, and a single condition that decides whether you trade at all: the three lines have to be far apart. When they are bunched together, you skip. When they spread out, price is stretched, and you wait for the candles to show it snapping back.
The video sets up the chart from scratch, then takes six live trades on Olymp Trade at $20 each on crypto OTC assets paying 90%. Five close green and one closes red, and the loss stays in the video. We checked every result against the account balance, and it matches to the cent.
The Settings, Exactly as Shown
- EMA 9 — pink, the fast line
- EMA 27 — orange, the middle line
- SMA 39 — teal, the slow line (a simple moving average, not an EMA)
- Trade duration: 1 minute
- Stake: $20 per trade, the same on every entry
- Assets: BNB, Ethereum, Solana, Dogecoin, SHIB and Litecoin OTC, all paying 90%
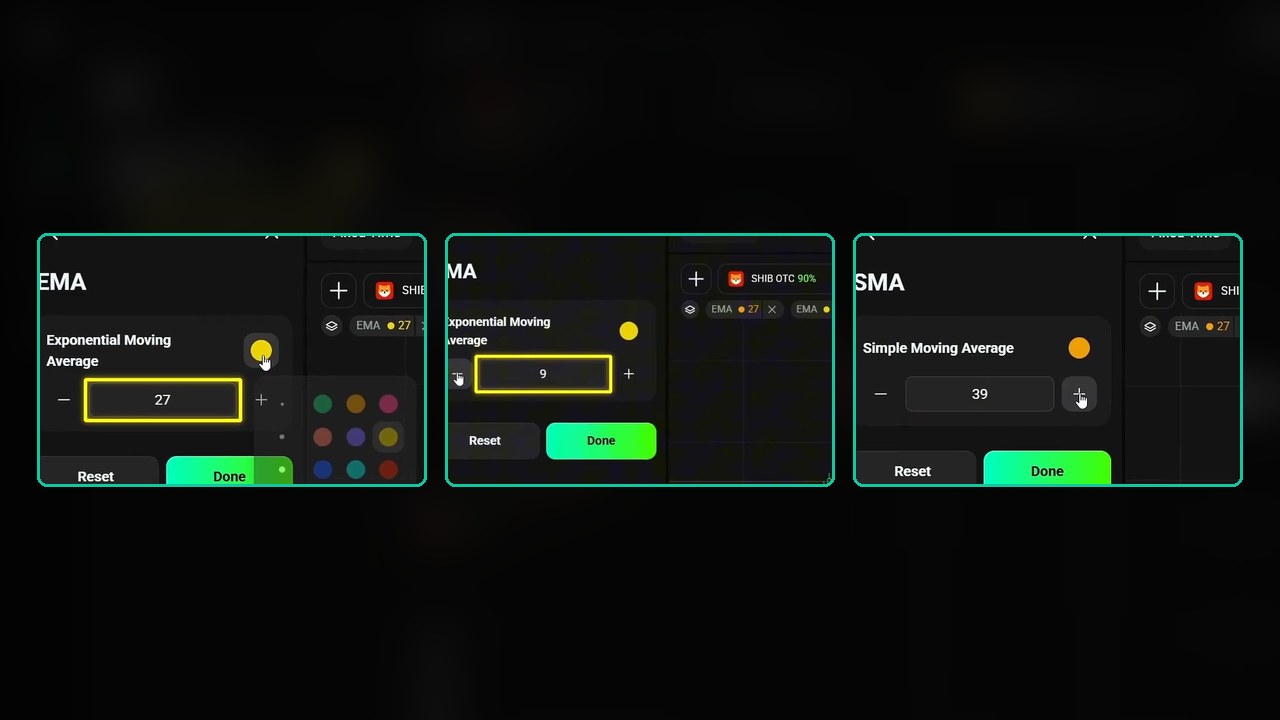
The colours are not decoration. With three lines on a fast chart you need to tell them apart at a glance: pink hugs price, teal lags furthest behind, and orange sits between them. The mix of two EMAs and one SMA matters too. The SMA 39 reacts more slowly than an EMA of the same length would, so the gap between the lines opens wider when price runs.
The Rules
- Filter first: only trade when the three lines are clearly spread apart. Lines close together or crossing each other — skip.
- UP: price has run far below the lines, and two green candles push up from the bottom.
- DOWN: price has run far above the lines, and the top candle turns red (or two red candles push down from above).
- Expiry: 1 minute. Same stake every time.
Read those together and it is clear what the strategy really is: a snap-back trade. “Lines far apart” means price has moved a long way from its averages, and the entry bets that the next minute brings it partly back. The candles are the trigger that says the move has paused.
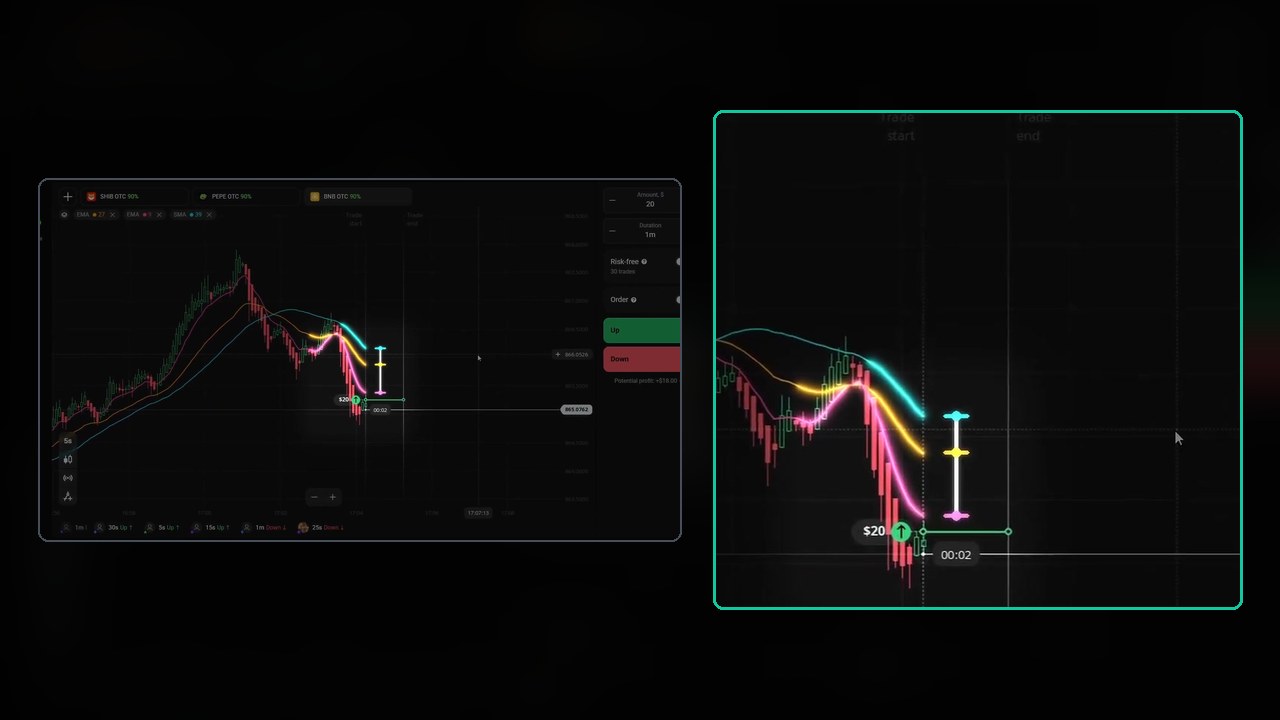
The first trade shows it cleanly. BNB has fallen hard, the three lines are fanned out wide above price, and two green candles push up from the low. UP at $20 — it closes green, +$18.
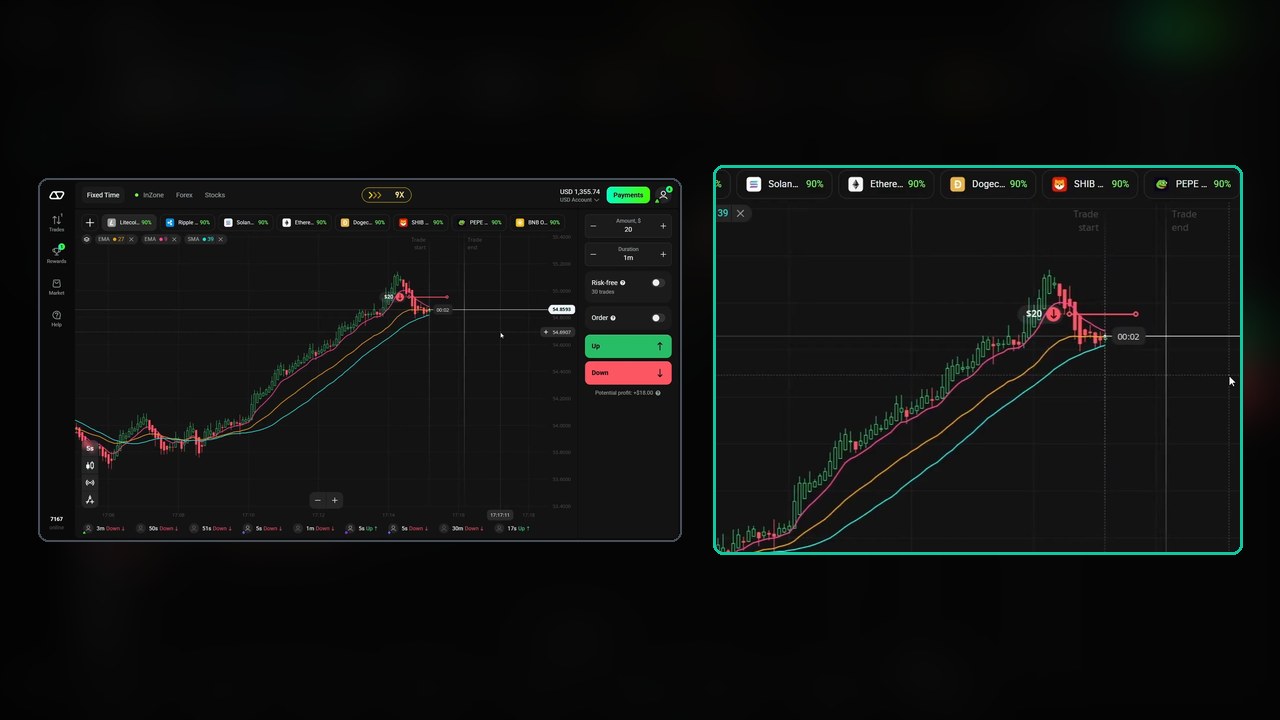
The down version, on Litecoin: a long rally, price well above all three lines, and the top candle turns red. DOWN — green again.
All Six Trades, Checked Against the Balance
- BNB OTC UP — won, +$18
- Ethereum OTC UP — won, +$18 (it dipped first, then climbed back above the lines)
- Solana OTC DOWN — won, +$18 (price stretched above the lines, top candle red)
- Dogecoin OTC UP — lost, −$20
- SHIB OTC DOWN — won, +$18
- Litecoin OTC DOWN — won, +$18
The balance goes from $1,323.74 before the first trade to $1,393.74 after the last: +$70.00, which is exactly five wins at $18 and one loss at $20. Every stake and every payout lines up.
The Loss Is the Most Useful Trade
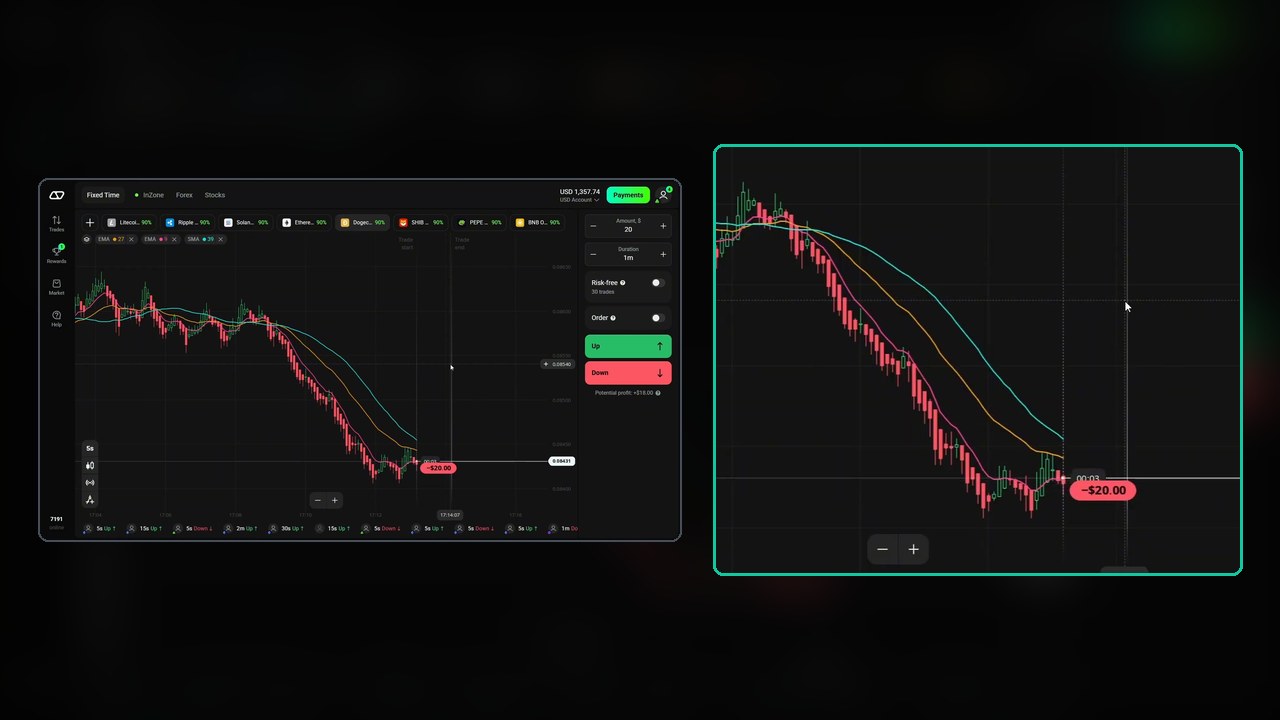
Trade 4 follows the UP rule to the letter: the lines are far apart, green candles appear at the bottom, and the trade goes in. But Dogecoin is in a strong, steady slide, and the green candles are just a pause. The next minute keeps falling and the trade closes at −$20.
That is the risk built into every snap-back strategy. “Far apart” means stretched, but it also means a strong trend — and strong trends can stay stretched for a long time. Two practical ways to reduce it: prefer setups where the move has already slowed (smaller candles near the extreme), and skip when the fast pink line is still pulling away from the others rather than flattening.
How to Practise It
- Set it up once: EMA 9 pink, EMA 27 orange, SMA 39 teal, 1-minute trades.
- Define “far apart” for yourself — for example, a clear gap between each line that you could see from across the room. Write it down so you judge every chart the same way.
- Wait for the trigger: two green candles off a low for UP, a red top candle for DOWN. No trigger, no trade.
- Same stake every time. The video says it too: follow the rules, not your feelings.
- Log 50 trades on demo. At a 90% payout you need to win about 53% to break even. Six trades show how the rules work, not what they will do over a month.
Watch the Video
Under four minutes: the chart setup, all six trades and the loss:
What to Keep in Mind
- “Far apart” is a judgement call. There is no number for it, so two traders will see different setups on the same chart until they define it.
- Crypto OTC only. All six trades are on OTC feeds, which are broker-generated and can behave differently from the real market.
- Six trades is a demonstration, not a record. Five out of six is a good video; treat it as a starting point for your own log.
- Strong trends are the enemy. The one loss came from exactly that, so the skip rule deserves more attention than the entry rule.
Risk Management
- Keep the stake flat — no doubling after a loss.
- Set a daily target and a stop-loss before you start, as the video recommends, and stop when either is hit.
- Know your break-even: about 53% at a 90% payout.
- Practise on a demo account first, and only trade money you can afford to lose. Binary options are restricted in some countries, so check the rules where you live.
Frequently Asked Questions
What are the moving average settings for this strategy?
Three lines: an EMA with period 9 in pink (fast), an EMA with period 27 in orange (middle) and a Simple Moving Average with period 39 in teal (slow). Trades are 1 minute.
When should I skip a trade?
Whenever the three lines are close together or crossing each other. The strategy only trades when the lines are clearly spread apart, which shows that price has moved far from its averages.
When do you trade up and when do you trade down?
Up when price is stretched below the lines and two green candles push up from the bottom. Down when price is stretched above the lines and the top candle turns red.
What was the result in the video?
Six $20 trades on crypto OTC assets paying 90%: five wins at +$18 and one loss at −$20, for a net of +$70. The balance moved from $1,323.74 to $1,393.74, which matches the trades exactly.
The Verdict
5 out of 5. This is how a strategy video should be made. The rules are written in the description before a single trade is taken, the settings are built on screen step by step, the skip condition gets as much airtime as the entries, the loss is shown and explained, and the risk warnings are specific rather than boilerplate. Every number we checked lines up with the balance.
It is also simple enough to test honestly: three lines, one filter, two triggers. Define “far apart” in your own words, respect the skip rule on strong trends, and let a demo log decide whether it works for you.
#OlympTrade #MovingAverage #EMA #SMA #1MinuteStrategy #BinaryOptions #TradingStrategy
This content is for educational purposes only and is not financial advice. Trading involves substantial risk; you can lose some or all of your capital. No result is guaranteed and past results do not indicate future outcomes. Always practise responsible money management, limit your daily trades, and trade only what you can afford to lose.
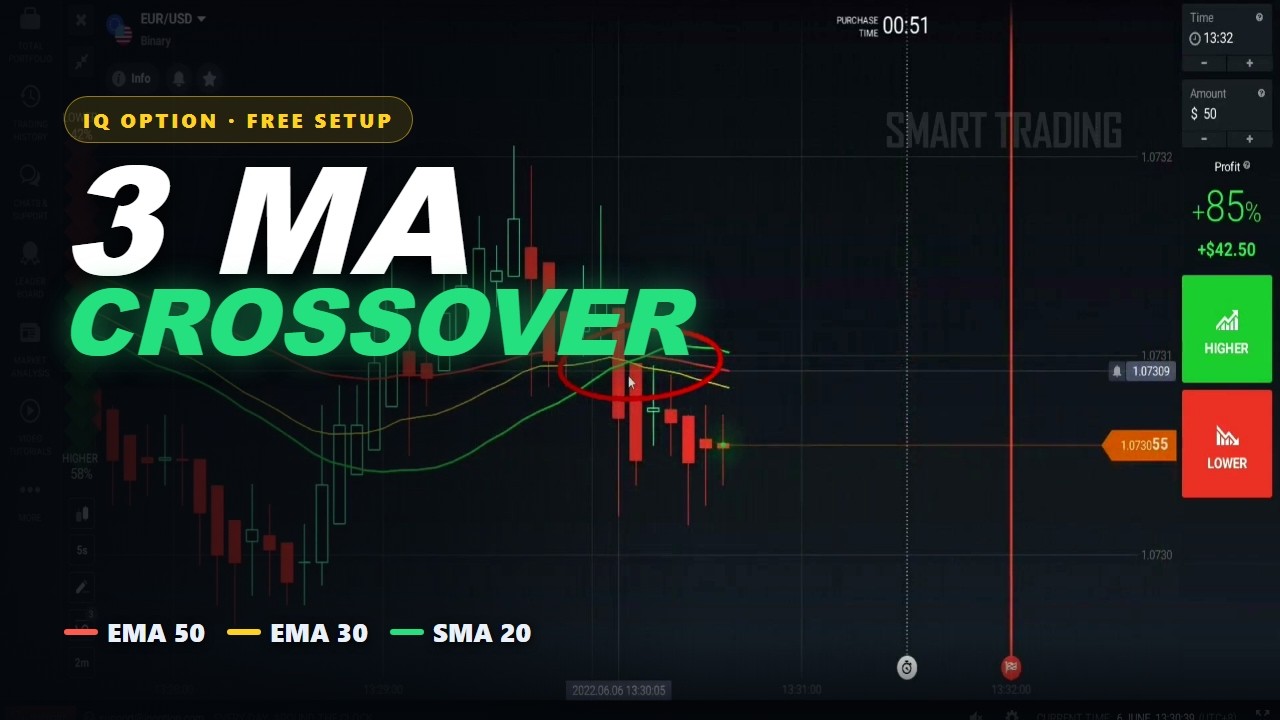
Related reading: the 4 EMA crossover on Olymp Trade uses moving averages for crossovers instead of stretch, and the 3 moving average crossover on IQ Option runs a similar three-line setup on another broker. For more, browse the Olymp Trade hub or the full strategy library.