Two Lines, and Every Number Visible
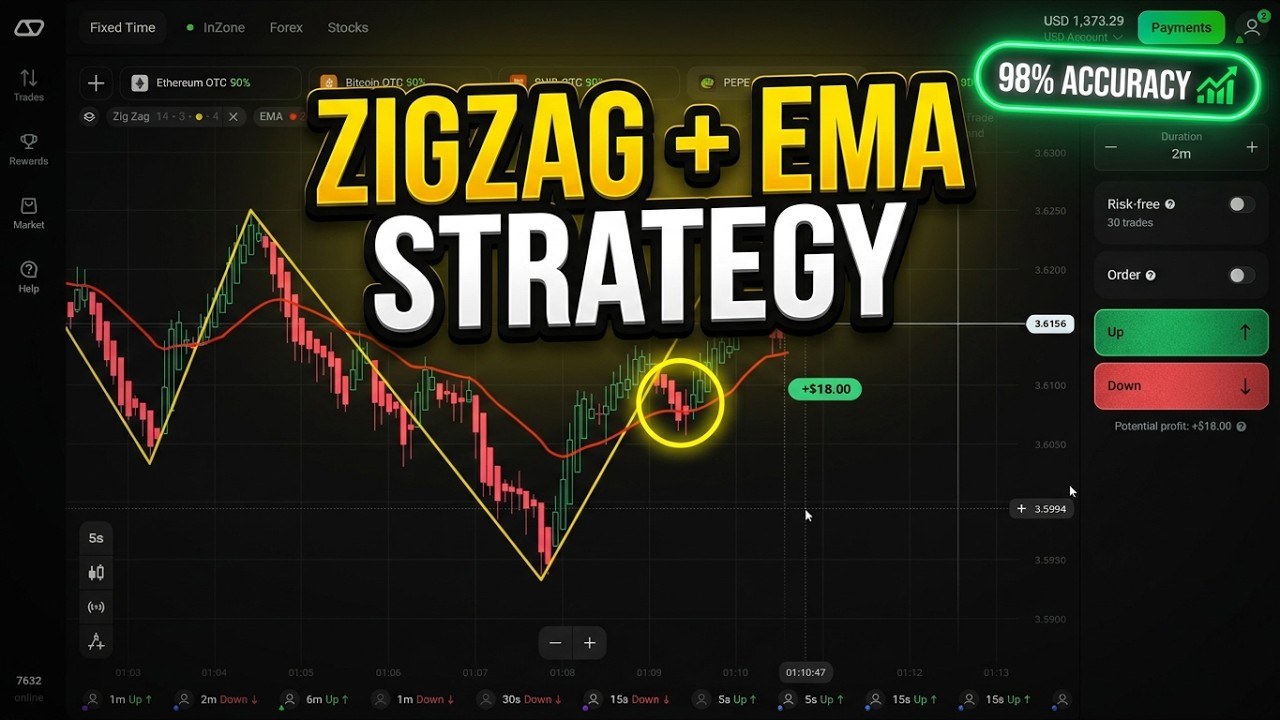
This is a twelve-minute Olymp Trade session running one of the simplest combinations there is: the ZigZag indicator and a single EMA. The trader opens both settings panels on camera, so nothing here has to be guessed — and that matters, because the two indicators are configured well away from their defaults.
It is also a combination with a problem that almost no video mentions: the ZigZag redraws its own last leg. That is not a reason to ignore the setup, but it completely changes what “the yellow line crossed the red line” is allowed to mean. We will get to that after the settings.
The Setup, Exactly as Shown
- Platform: Olymp Trade, Fixed Time mode, real account
- Chart: Heikin Ashi candles on the 5-second timeframe
- Trade duration: 2 minutes — the narration says the combination suits 2 to 5 minute expiries
- Stake: flat $20 on every entry
- Payouts on screen: 80–82% on the forex pairs, 90% on the OTC crypto assets traded after the forex session closed
- Indicators: ZigZag (yellow) and EMA (red), both free on the platform
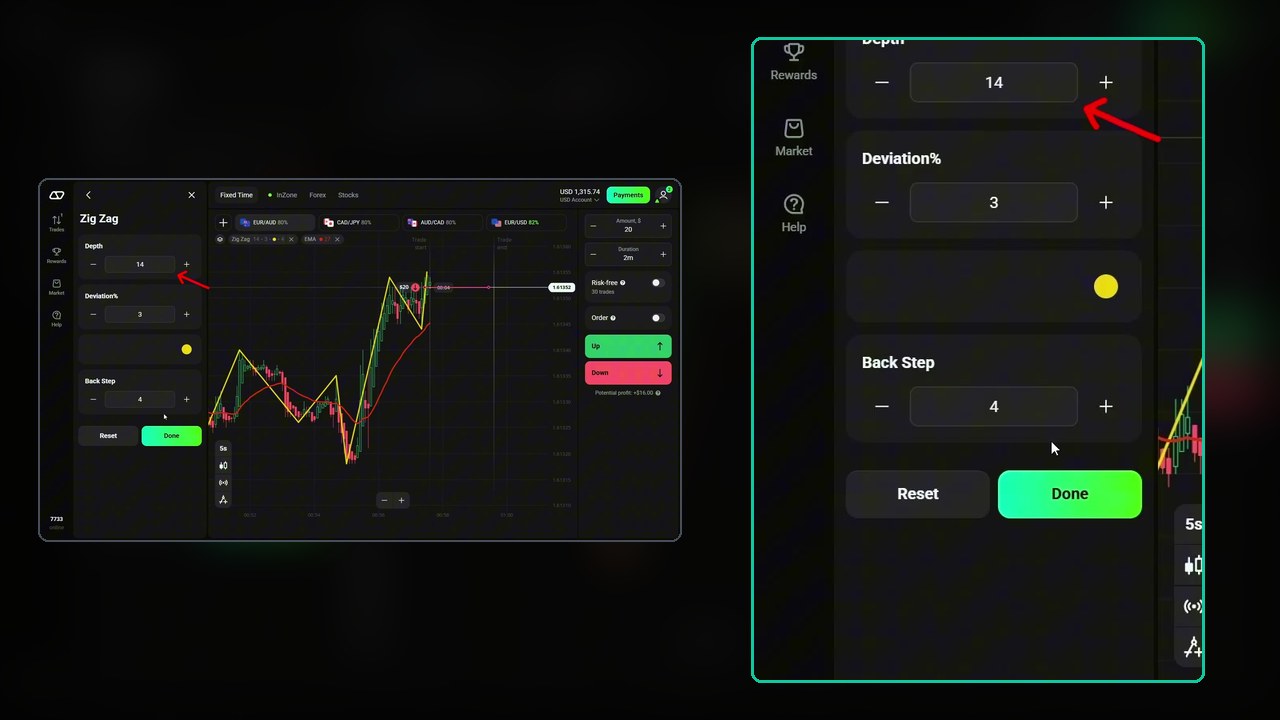
The ZigZag is set to depth 14, deviation 3, back step 4. In plain terms:
- Depth is the minimum number of bars the indicator looks back before it will accept a new swing point. Higher depth means fewer, larger swings.
- Deviation is how far price must reverse, in percent, before a swing counts as a swing rather than noise.
- Back step is how many bars must separate two swing points, which stops the line from zig-zagging on adjacent candles.
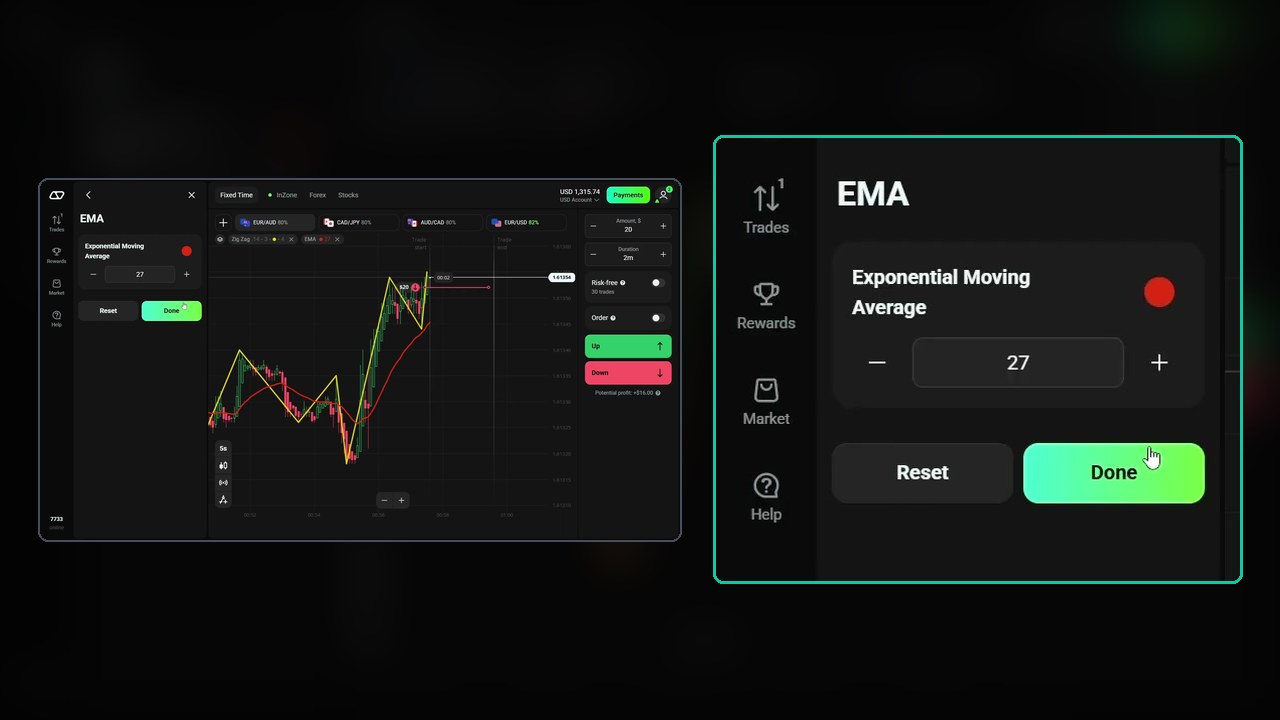
The EMA is a single line at period 27, drawn in red. On 5-second candles that is a little over two minutes of price history — conveniently, about the length of one trade.
The Rule as Narrated
The entry rule in the video is one sentence: when the yellow ZigZag line crosses the red EMA, trade in the direction of the cross. Yellow crossing down through red is a Down trade; yellow crossing up through red is an Up trade. The first entry is marked on screen by hand.
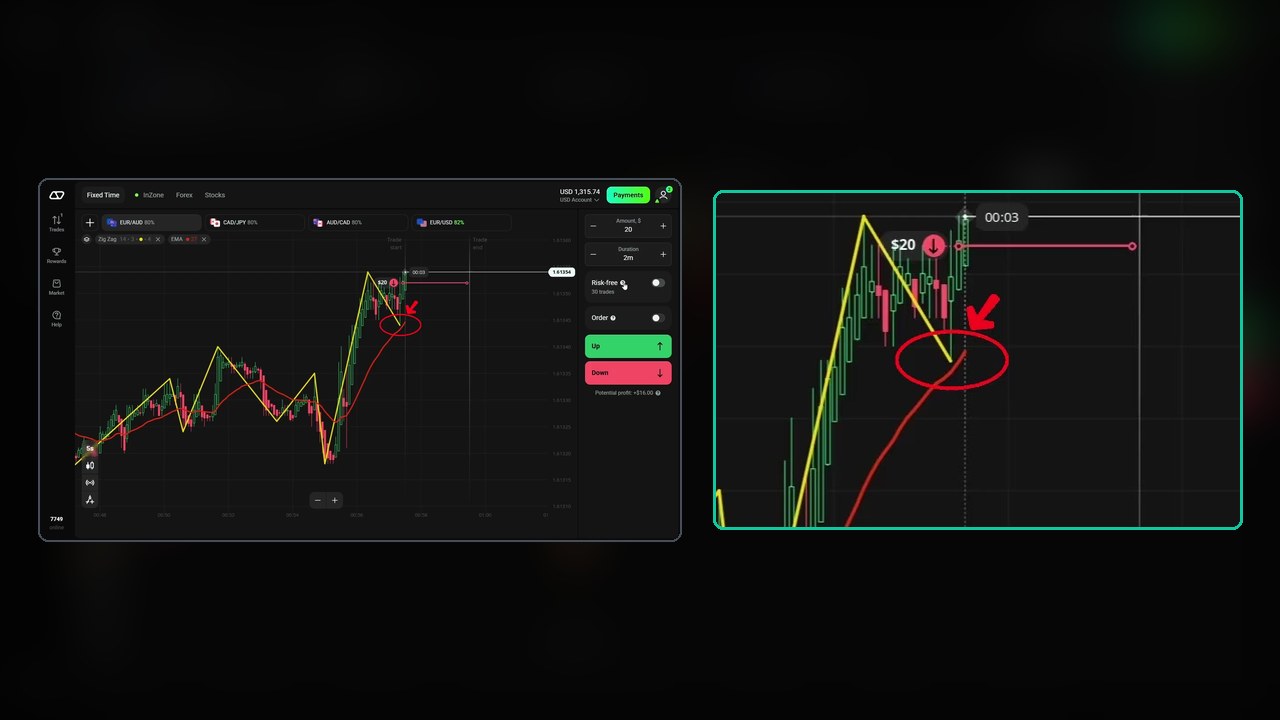
That is the whole strategy as stated. No filter, no confirmation step, no rule about which crosses to skip.
The Part the Video Does Not Say: ZigZag Repaints
This is the single most important thing to understand before you trade this setup, and it is not a criticism of the trader — it is how the indicator is built.
The ZigZag only draws a line between confirmed swing points. Its last leg, the one attached to current price, is provisional: while price is still moving, that leg stretches, shortens, and can flip to the other side entirely. When a new extreme forms, the previous leg is erased and redrawn from the new point. Scroll back on any chart and the ZigZag looks flawless, because you are looking at a line that has already been corrected with hindsight.
The consequence for this strategy is specific: a cross you act on in real time may not be there ten seconds later. The leg that crossed the EMA can be redrawn to a different angle, or removed, once price makes a new high or low. On a 5-second chart that happens constantly.
So how do you trade it honestly? Three options, in increasing order of discipline:
- Treat the cross as a prompt, not a signal. When the yellow line crosses, look at where price actually is relative to the EMA and enter on that — price closing on the far side of the EMA is not a repainting event.
- Wait for the leg to be confirmed. A ZigZag leg stops moving once the next swing point is established. Waiting costs you the first part of the move but removes the repaint from the decision entirely.
- Log both. Record what you saw at entry and what the chart looked like two minutes later. If they routinely disagree, you were trading a line that did not exist.
There is a second, smaller version of the same problem in the candles themselves. Heikin Ashi candles are averaged, so the body you see is not the real open and close. They smooth the chart beautifully — and they lag. Your fill is at the real market price, not at the tidy Heikin Ashi close.
What the Session Actually Did
The first trade is on a forex pair at 80%, taken on a down-cross. It settles green. The narration then notes that the regular market has closed, and the session moves to OTC crypto assets at 90% — SHIB, PEPE, Ethereum, Bitcoin, BNB and Ripple OTC all appear as tabs.
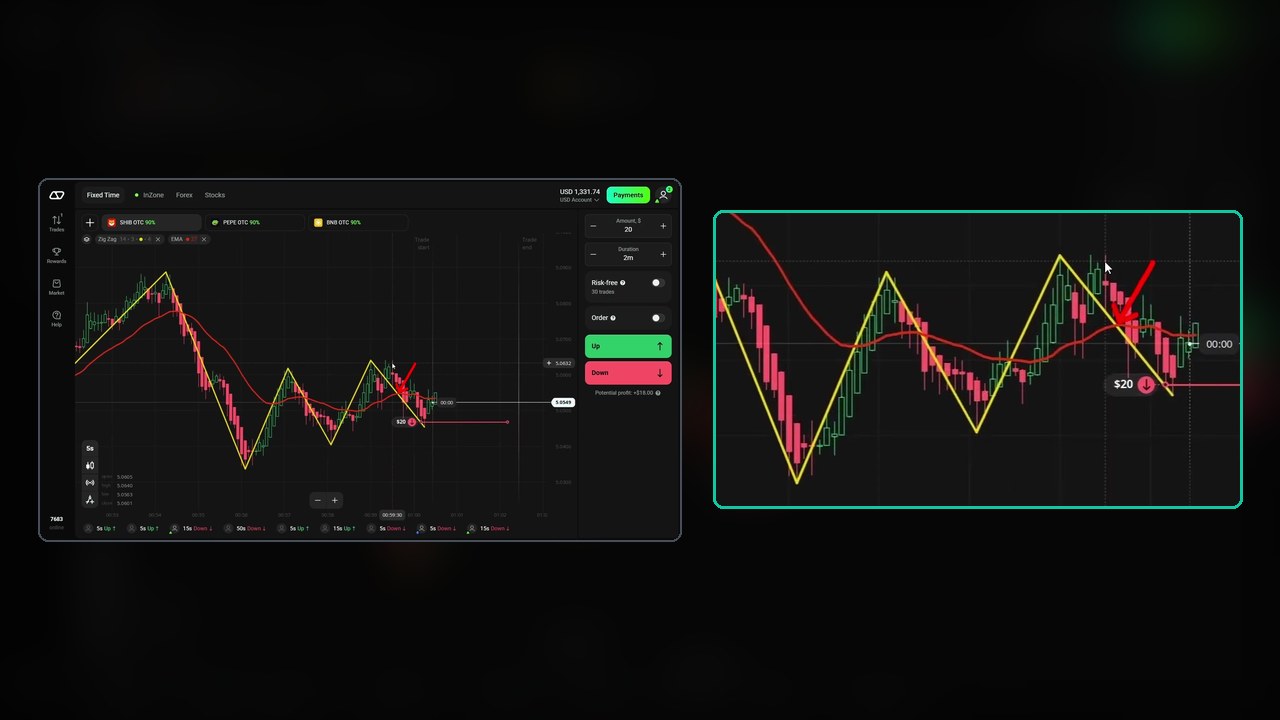
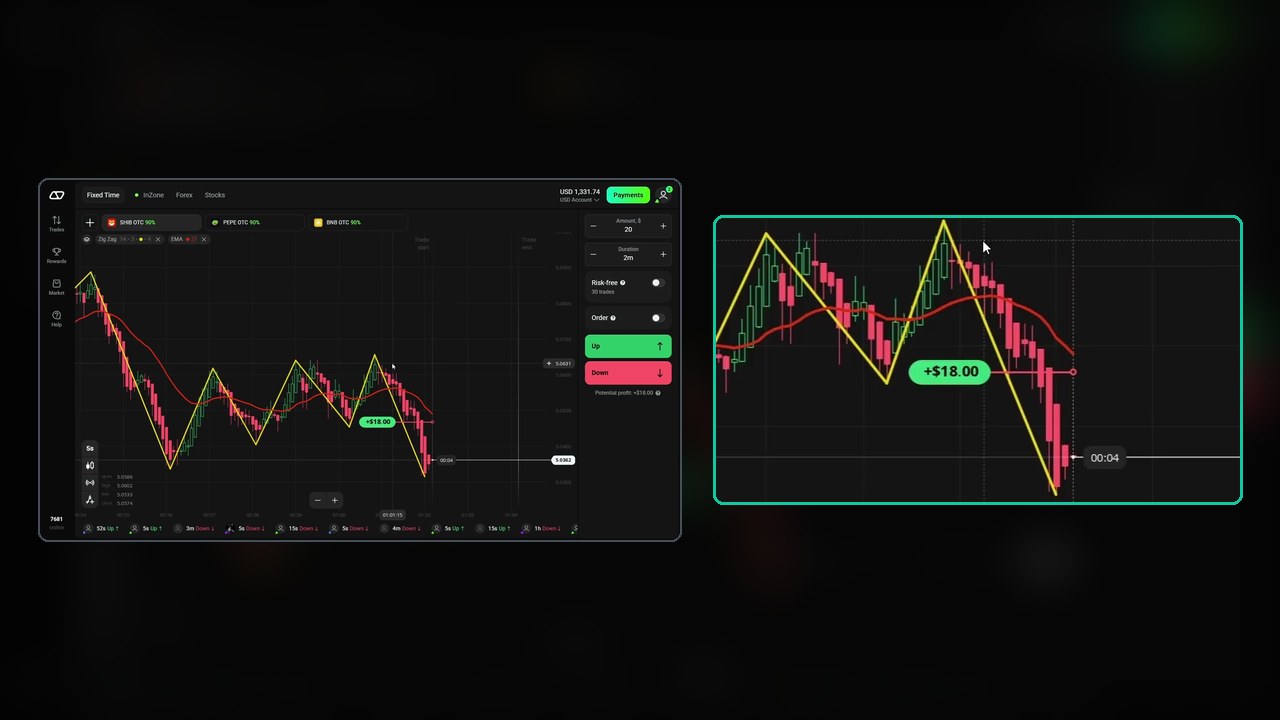
The wins on the OTC assets pay +$18.00 on a $20 stake, exactly the 90% on the tab. The next entry shown is an Up trade on PEPE OTC after an up-cross.
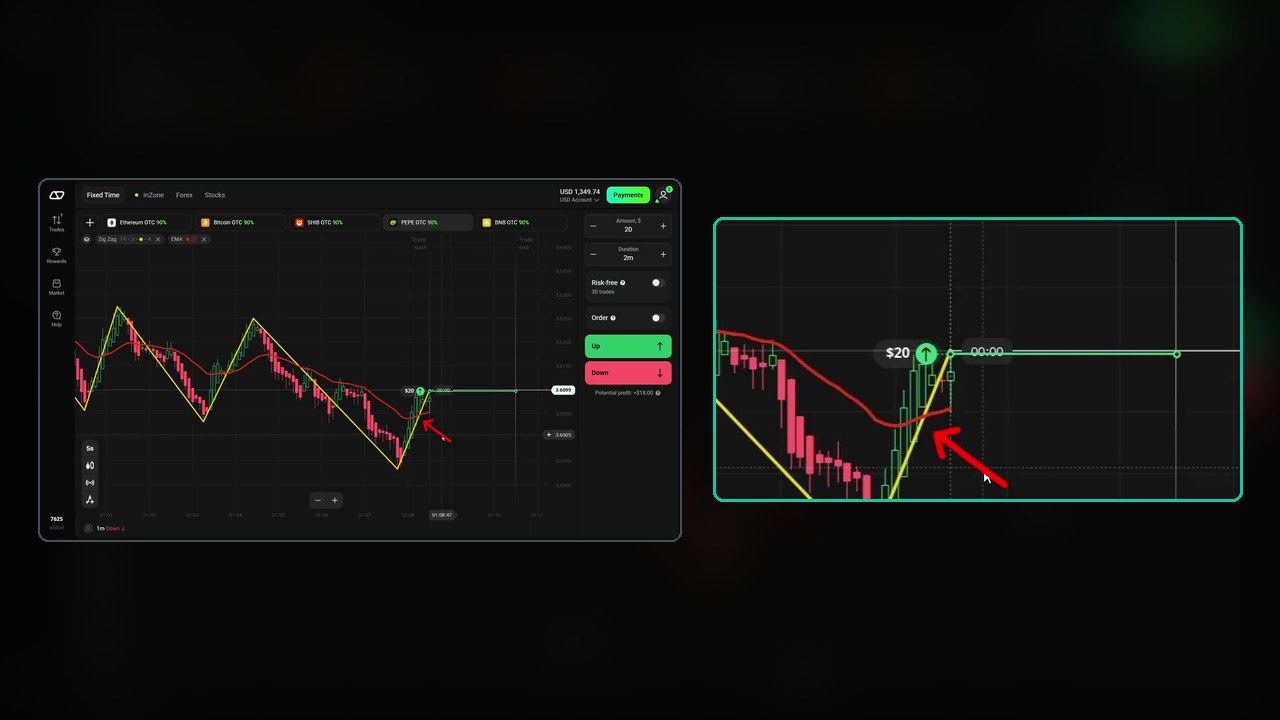
The balance is the honest scoreboard here. It opens the clip at $1,315.74 and reads $1,403.74 in the final seconds — +$88.00 across twelve minutes. Part of that comes from trades that were already running when the recording started, and the trader keeps several assets open at once, so a clean per-trade tally cannot be read off the video.
What can be read off it: not every trade won. One entry around the four-and-a-half-minute mark never returns to the balance — the account simply sits at the reduced figure until the next entry is placed. That is a loss, and it is worth saying plainly, because the clip does not stop to mention it.
The Payout Maths
Two different payouts run in this session, and they set two different bars:
- At 80% (the forex pairs), break-even needs about a 55.6% win rate.
- At 90% (the OTC crypto), break-even needs about 52.6%.
That gap is the real reason the session moved to OTC after the forex close, whether or not it was the stated reason. Three percentage points of required accuracy is a large edge to hand yourself for free — but OTC assets are the platform’s own synthetic series, so behaviour you measure on them does not automatically carry to a live pair.
Turning It Into Something You Can Test
- Set it up as shown: ZigZag 14 / 3 / 4, EMA 27, 5-second Heikin Ashi candles, 2-minute expiry, flat stake.
- Write the trigger down in a form that cannot repaint — for example: a ZigZag cross plus price trading on the same side of the EMA at the moment you click.
- Add the filter the clip lacks. Skip crosses where the EMA is flat and price is chopping across it; those are the ones the ZigZag will redraw.
- Prefer the higher payout when the same signal exists on two assets, and know the break-even number for each.
- Fifty logged trades on demo before any of this touches real money, with the repaint check in step 1 of this section noted on every one.
Watch the Session
Twelve minutes — the settings panels, the marked entries, and the OTC switch:
Honest Weaknesses
- The repaint is structural. Any screenshot of a ZigZag strategy is flattering by construction. Judge this one on live entries only.
- 5-second candles into a 2-minute expiry is a mismatch worth thinking about. You are timing with a very fast chart and being paid on a much slower outcome; the noise that triggers the cross may be irrelevant by settlement.
- No skip rule. With two lines and no filter, the setup fires often, and the clip does not show a single skipped cross.
- OTC assets are platform-specific. Convenient when the market is closed, but they are not the interbank market and should not be treated as one.
- Overlapping positions hide the record. Several assets are traded at once, which is fine in practice but makes the session impossible to audit trade by trade.
Risk Management
- Flat stake, set before the session. The clip never moves off $20 and neither should a test.
- Cap trades per session and set a daily loss limit — fast charts make twenty entries feel like five.
- Know your break-even: 55.6% at 80%, 52.6% at 90%.
- Demo first, with a written log, until you have a real sample rather than an impression.
Frequently Asked Questions
What ZigZag and EMA settings are used in this Olymp Trade video?
ZigZag with depth 14, deviation 3 and back step 4, drawn in yellow, plus a single EMA at period 27 drawn in red. The chart is Heikin Ashi candles on the 5-second timeframe, and trades are placed for 2 minutes at a flat $20 stake.
Does the ZigZag indicator repaint?
Yes. The ZigZag draws between confirmed swing points, so its most recent leg is provisional and is redrawn when a new high or low forms. A cross you act on in real time can be redrawn afterwards, which is why historical charts always look perfect. Confirm the cross against where price sits relative to the EMA, or wait for the leg to be confirmed.
Are the trades 5 seconds long?
No. The 5 seconds is the candle length. The trades in the video are Fixed Time trades with a 2-minute duration; the narration says the combination suits 2 to 5 minute expiries.
What were the results in the video?
The account balance moves from $1,315.74 at the start of the clip to $1,403.74 at the end, about +$88 over twelve minutes, with winning OTC trades paying +$18.00 on a $20 stake at 90%. At least one entry loses, and because several assets are traded at once, a per-trade tally cannot be read from the video.
The Verdict
4.5 out of 5. It earns the rating for transparency: both settings panels are opened on camera, the entries are marked, the payouts and stake are visible throughout, and the balance is on screen the whole time so the result can be checked rather than believed. Two free indicators, a rule you can state in one sentence, and enough detail to reproduce it exactly.
The missing half star is the repaint. A ZigZag cross is not a fixed event, and a strategy built on one needs a confirmation step the video never states. Add that step, keep the stake flat, and let a demo log tell you whether the cross is worth trading.
#OlympTrade #ZigZag #EMA #HeikinAshi #FixedTime #BinaryOptions #TradingStrategy #OTC
This content is for educational purposes only and is not financial advice. Trading involves substantial risk; you can lose some or all of your capital. No result is guaranteed and past results do not indicate future outcomes. Always practise responsible money management, limit your daily trades, and trade only what you can afford to lose.
More on these tools: the ZigZag with the AI scanner reads the same line with a second opinion attached, the 4 EMA crossover drops the ZigZag entirely, and the strategy library has the rest of the platform.