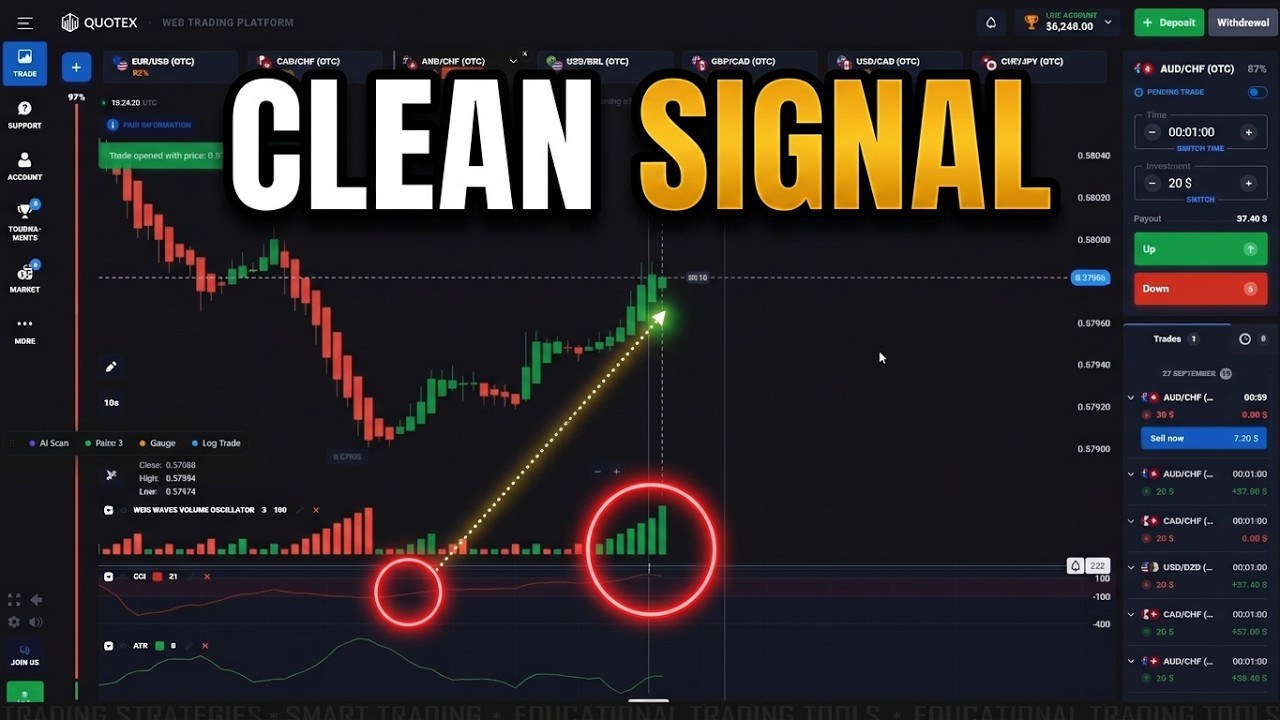
Three Free Indicators, One Minute, No Paid Tools
Everything in this setup is already built into Quotex: the Commodity Channel Index (CCI), the Weis Waves Volume Oscillator and the Average True Range (ATR). No downloads, no MetaTrader, no signal service. The video is pitched at beginners, and it earns that label: the rules fit in three sentences and the narrator reads the settings out loud.
The session is on a Quotex live account, 1-minute trades, a flat $20 per entry, on OTC pairs paying 85–92%. The first two and a half minutes are narrated; the remaining nine are the same method running without commentary. We logged all of it: eleven entries, eight green, three red. The part that matters most for anyone copying it is how that result was made, and it is covered below.
The Settings, Exactly as Shown
- Chart: 10-second candles, Heikin Ashi candle type
- Weis Waves Volume Oscillator: length 3, opacity 100
- CCI: period 21
- ATR: period 8, second period 8
- Expiry: 1 minute on every trade in the video; the narration says 2–3 minutes also works
- Stake: $20 per entry
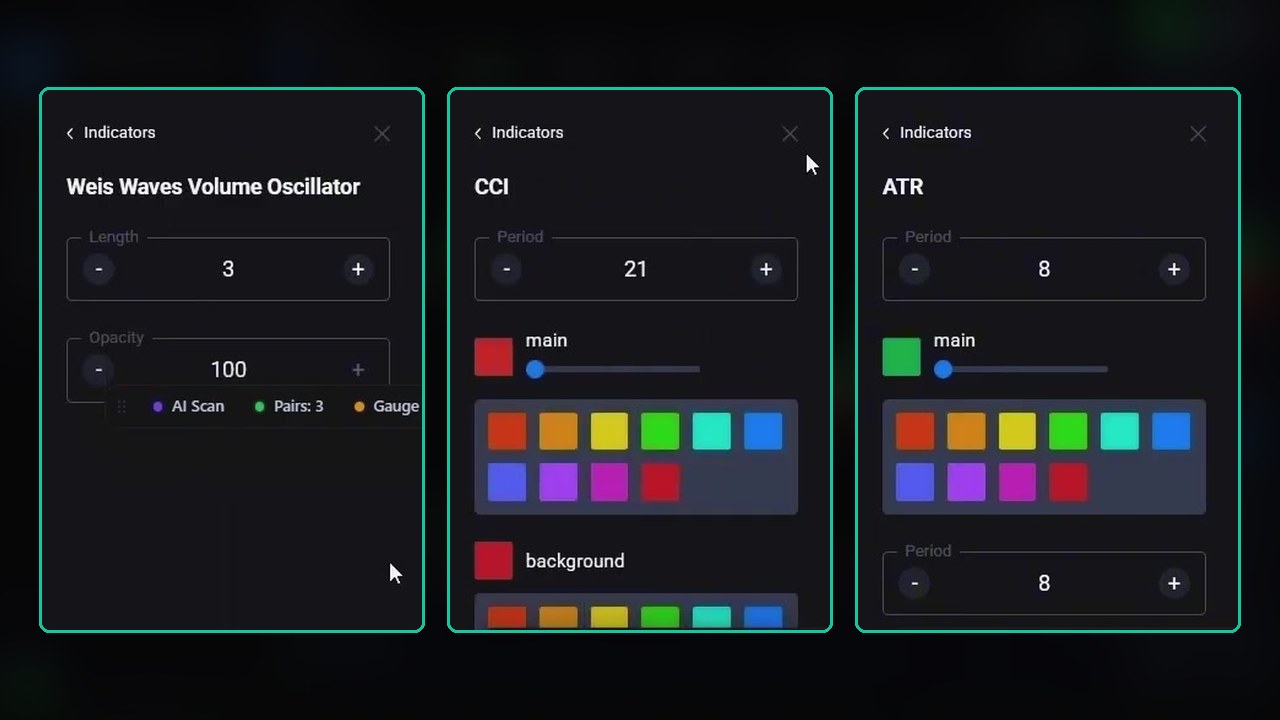
On the Quotex CCI panel the shaded band runs from −100 to +100. When the narration says “below the red zone”, it means the CCI line is under −100; “into the red zone” means it is crossing back above −100.
The Entry Rules
Up (CALL)
- The CCI is at the bottom, below −100, and the line starts turning up.
- The Weis Waves oscillator shows a run of four to six bars — the narration’s “good to trade” condition.
- The ATR is optional. When it is used, a change of direction (rising, then turning down) is read as a second sign that price is about to turn.
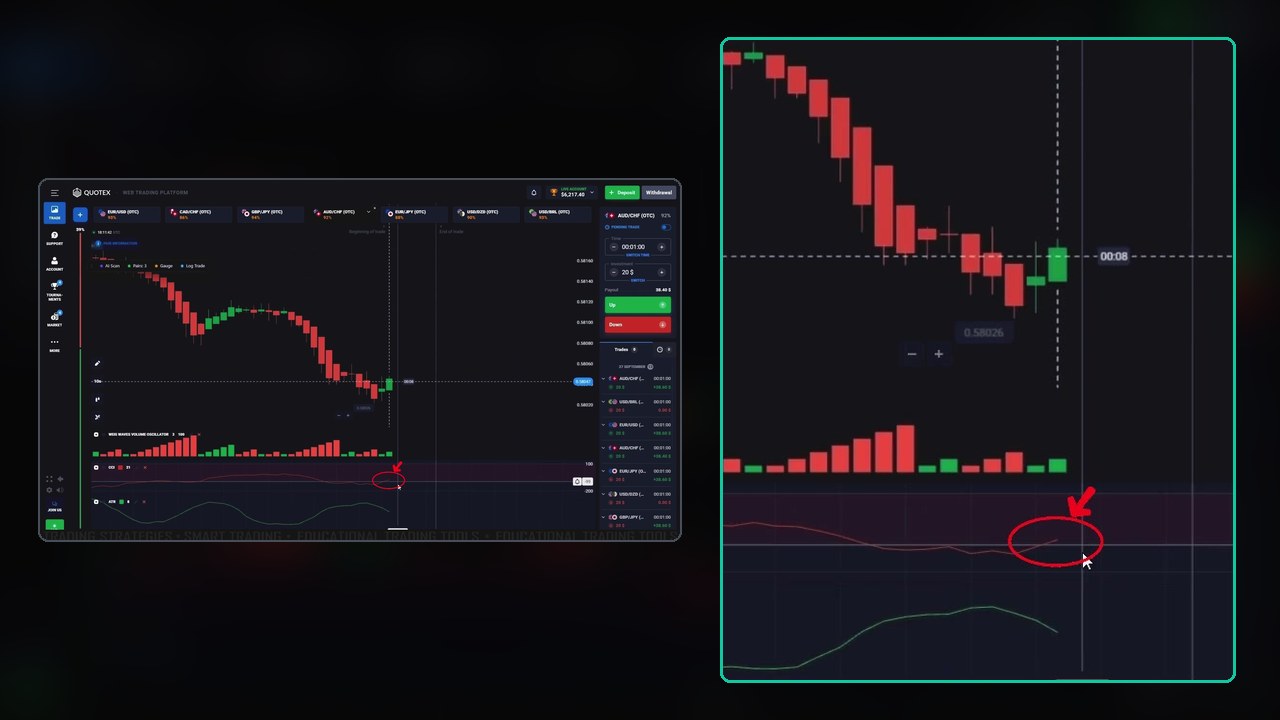
The first entry is exactly that picture: AUD/CHF has fallen hard, the CCI is under −100 and just starting to hook up (the trader circles it on screen), and a CALL goes in at $20. It closed green at 92% — $38.40 back. The second narrated setup, on CAD/CHF, adds the ATR check: CCI coming up out of the bottom into the band, and the ATR that had been rising now turning down. CALL, green, $37 back.
Down (PUT)
The mirror image, and the narration spells it out on the third trade: price has been printing all-green candles, the Weis Waves shows eight green bars in a row, the CCI is coming down from the top, and the ATR is flat. PUT.
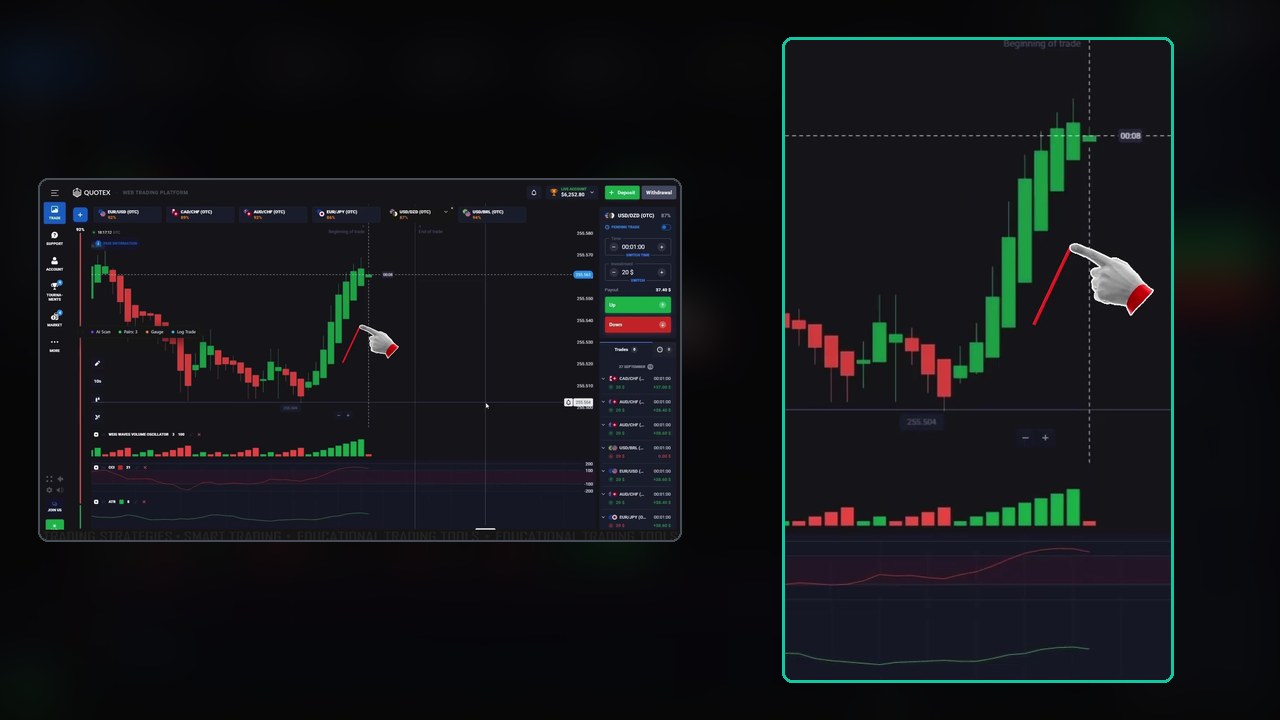
USD/DZD at 87% — green, $37.40 back. Notice that this setup has eight Weis bars, not the four to six the up-rule asks for. The video treats a long streak as exhaustion on the way down and a short streak as a green light on the way up, but never says so in one sentence. Treat the bar count as a rough guide, not a hard number.
The Full Session, Trade by Trade
After the narration ends at 2:45 there is no more commentary, so we rebuilt the rest from the screen. The account balance is visible in the top bar until 9:25, and the trades list on the right runs to the end. Every stake drop and every payout credit matches an entry in that list:
- AUD/CHF CALL — won, +$18.40 (92%)
- CAD/CHF CALL — won, +$17.00 (85%)
- USD/DZD PUT — won, +$17.40 (87%)
- CAD/CHF — lost, −$20
- AUD/CHF — won, +$17.80 (89%)
- AUD/CHF — won, +$17.40 (87%)
- USD/BRL — lost, −$20
- GBP/CAD PUT — lost, −$20
- GBP/CAD PUT × 3 — all won, +$18.00 each (90%)
The balance moves from $6,217.40 to $6,265.40 across the first seven trades (+$48.00, which matches the list to the cent), and the last four add −$20 + $54 = +$34. Net for the session: +$82.00 on eleven $20 entries.
Read This Part Before You Copy the Result
Trade 8 is a GBP/CAD PUT taken while price is still climbing hard, and it loses. Less than a minute later, the trader places three more GBP/CAD PUTs a second apart — $60 on the same idea that had just failed. This time the move turns and all three pay.
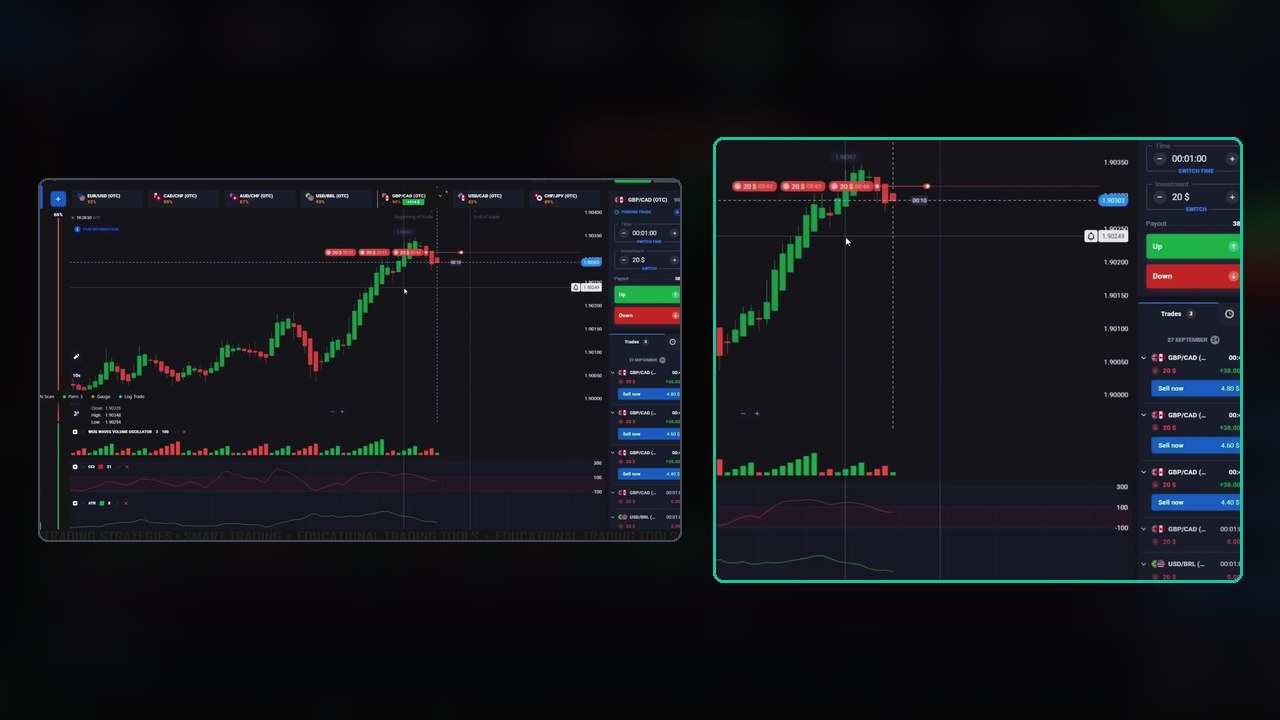
Those three entries are $54 of the $82. Take them out and the session is eight single entries, five green and three red, for +$28. That is still a positive result, and at these payouts it is roughly what a 62% hit rate should look like — but it is a very different picture from the headline number.
Stacking after a loss is a form of recovery betting, and we do not recommend it. Had GBP/CAD kept rising for one more minute, the last four trades would have cost $80 and the session would have finished at −$32 instead of +$82. The stack does not change the odds of the trade; it only changes how much a wrong read costs.
What the Video Does Not Tell You
- How far below −100 counts as “the lowest part”. On 10-second Heikin Ashi candles the CCI dips under −100 constantly. The video’s entries are at clear extremes after a strong move; a shallow dip is not the same setup.
- What “starts moving upward” means in candles. One tick up? One closed candle? At 10-second candles that choice changes your entry price. Pick one and stick to it.
- Why the three losses lost. They are in the unnarrated part, so there is no explanation. Trade 8 is the easiest to read: a PUT into a rally that had not yet turned.
- Where the PipGems toolbar fits in. The chart has the PipGems toolbar docked (AI Scan, Pairs, Gauge, Log Trade), but the video never opens it. Every entry here comes from the three free indicators alone.
Turning It Into Rules You Can Test
- Set it up once: 10-second Heikin Ashi, CCI 21, Weis Waves 3, ATR 8/8.
- CALL: CCI below −100 after a clear drop, and one closed candle with the CCI pointing up. Weis Waves showing a fresh run of four to six bars.
- PUT: CCI above +100 after a clear rise, and one closed candle with the CCI pointing down. A long green Weis streak (seven or more bars) counts in favour.
- ATR as a tie-breaker: if it is turning against the prior move, take the trade; if it is still expanding in the direction of the move, wait.
- One entry per setup, flat stake. After a loss, the next trade needs its own fresh setup — not a re-entry on the same idea.
- Log fifty trades on demo before you trust any of it. At 85–92% payouts you need to win about 52–54% just to break even.
Watch the Session
Twelve minutes: the rules and settings in the first three, then the rest of the session without commentary, including the GBP/CAD sequence:
Honest Weaknesses
- The stacked GBP/CAD entries carry most of the profit, and they are the riskiest thing in the video.
- “Four to six bars” and “lowest part” are not precise. Anyone copying this will have to choose their own thresholds.
- OTC pairs only. Every trade is on an OTC feed, which is broker-generated and trades differently from the real market.
- Eleven trades is not a sample. Eight wins out of eleven is a good session, and it tells you nothing about the next fifty.
Risk Management
- Fix your stake before the session and keep it flat: no stacking, no doubling after a loss.
- Set a daily loss limit and a maximum number of trades, and stop when you reach either one.
- Know the break-even for your payout: about 52% at 92%, 53% at 90%, 54% at 85%.
- Practise on a demo account first, as the video itself says, and only trade money you can afford to lose.
Frequently Asked Questions
What are the indicator settings for this Quotex strategy?
10-second Heikin Ashi candles, the Weis Waves Volume Oscillator at length 3 and opacity 100, the CCI at period 21, and the ATR at period 8 with a second period of 8. All three indicators are built into Quotex and free to use.
When do you take an up trade with the CCI?
When the CCI is below −100, under the shaded band, and starts turning up, with the Weis Waves showing a run of four to six bars. The ATR is optional; a turn in its direction is read as extra confirmation.
What expiry does the setup use?
Every trade in the video is 1 minute. The narration says 2 to 3 minutes also works, but none are shown.
What was the result of the session?
Eleven $20 entries: eight won and three lost, for a net of +$82. Three of the wins were PUTs stacked a second apart on GBP/CAD right after a GBP/CAD loss; without them the result is +$28 on eight single entries.
The Verdict
4.5 out of 5. It is a setup a beginner can build in two minutes with tools already on the platform, the settings are read out and shown on screen, and the entry logic is clear enough to write down. The session keeps its losses in, and the balance reconciles with the trades list to the cent.
The missing half star is the GBP/CAD stack, which supplies two-thirds of the profit, plus two rules (“lowest part”, “four to six bars”) you will have to pin down yourself. Keep the three indicators, drop the stacking, fix your thresholds, and let a logged demo sample decide.
#Quotex #CCI #WeisWaves #ATR #FreeIndicators #HeikinAshi #1MinuteTrades #BinaryOptions #QuotexStrategy
This content is for educational purposes only and is not financial advice. Trading involves substantial risk; you can lose some or all of your capital. No result is guaranteed and past results do not indicate future outcomes. Always practise responsible money management, limit your daily trades, and trade only what you can afford to lose.
Related reading: Super Trend with Weis Waves on Quotex uses the same oscillator with a trend filter, and ADX + CCI on Quotex pairs the CCI with a trend-strength check. For more, browse the Quotex hub or the full strategy library.


