Three Lines, One Question
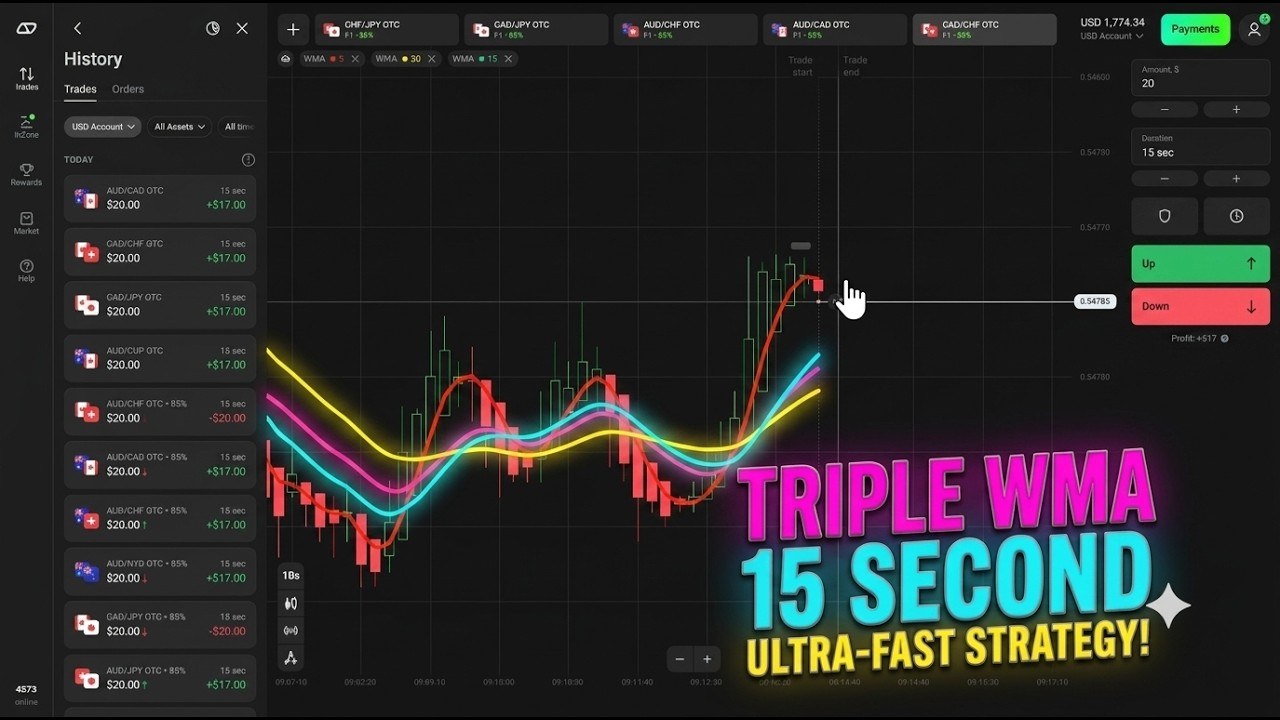
A single moving average tells you where price has been. Three of them, at different speeds, tell you something more useful: whether the short term and the longer term still agree. That is the entire idea behind this setup — and on a 15-second expiry, agreement is about the only thing you have time to check.
The configuration is deliberately small: WMA 5, WMA 15 and WMA 30 on Heiken Ashi candles at a 10-second timeframe, trading a 15-second duration on Olymp Trade. Nothing else on the chart. No oscillator, no bands, no arrows.
The Setup
- Platform: Olymp Trade
- Candles: Heiken Ashi, 10-second timeframe
- Indicators: WMA 5 (red — fast), WMA 15 (green — confirmation), WMA 30 (yellow — slow direction)
- Trade duration: 15 seconds
- Stake: flat $20, unchanged on every entry
- Payouts in the session: 85% on the FX pairs, 90% on Solana
Why weighted rather than simple? A WMA gives the newest candles more influence than the oldest, so it turns faster than an SMA of the same length. On a 10-second chart with a 15-second expiry, that responsiveness is the whole point — a lagging average would confirm the move after your trade had already expired.
Why Heiken Ashi? These candles average away part of the tick-by-tick noise, which at 10 seconds per bar is considerable. The trade-off matters and is covered further down: they also hide the real open and close.
The Entry: WMA 5 Crossing WMA 15
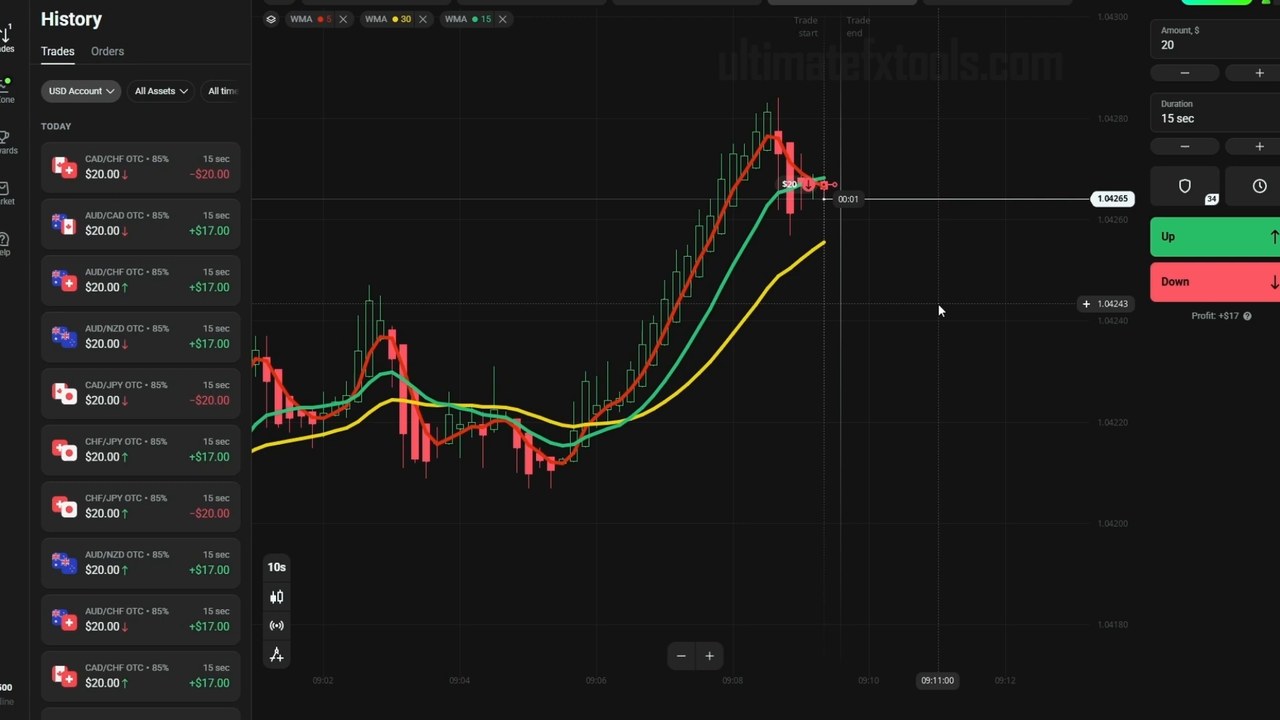
The signal is the red line crossing the green line — WMA 5 through WMA 15:
- Up trade — the red WMA 5 crosses above the green WMA 15, with the yellow WMA 30 below both and the whole fan pointing up.
- Down trade — the red crosses below the green, with the yellow above and the fan pointing down.
The video's timing note is the part worth stealing: the entry is taken as the crossover completes, not several candles after it. On a 15-second expiry you are trading the moment of the turn. Wait for three confirmation candles on a 10-second chart and half your expiry is already gone.
The yellow WMA 30 is not a trigger. It is the tiebreaker — a crossover that happens on the correct side of the slow line is one where the short term and the underlying direction agree, and those are the ones with the cleanest follow-through.
When All Three Lines Merge — the Skip Signal
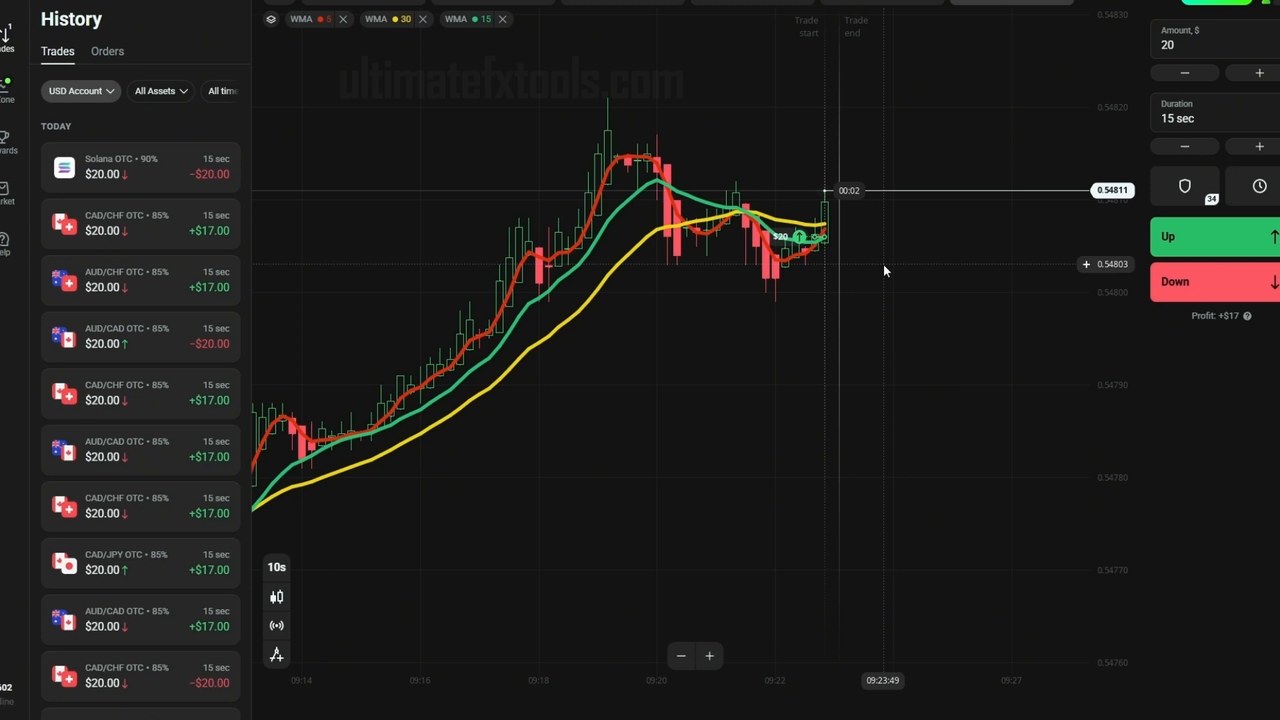
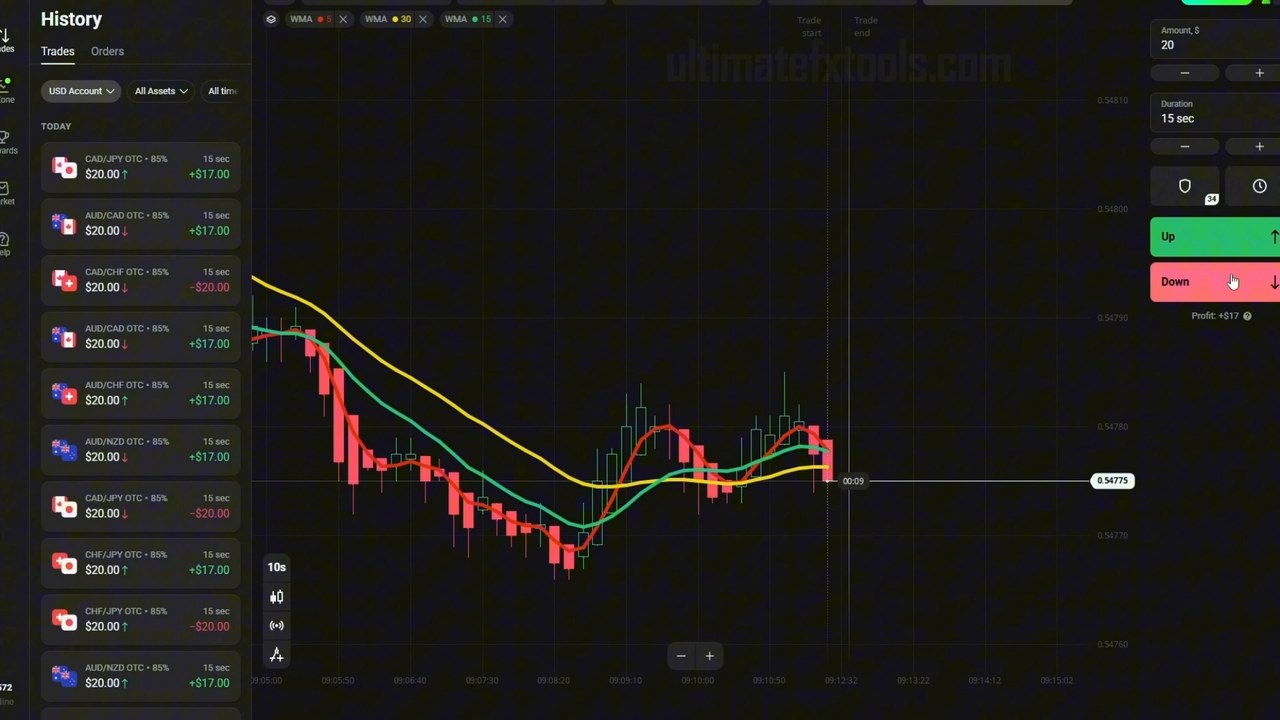
This is the most valuable thing on the chart, and it is not an entry — it is a reason to stay out.
When the three lines bunch together and travel as one, the fast, medium and slow averages are all reading roughly the same value. That is what an indecisive market looks like mathematically. In that state the WMA 5 can flip either side of the WMA 15 on a single candle, then flip straight back — producing crossover after crossover with nothing behind any of them.
The setups worth taking are the opposite picture: the lines separated, fanned out, with visible space between them. Separation means the recent candles are meaningfully different from the older ones, which is another way of saying the market has picked a direction.
The video also flags the unusual case where the red line pulls well away from the other two. That is a sharp short-term move that the medium and slow averages have not caught up to yet — sometimes the start of a real run, often a spike about to snap back. Treat distance from the pack as a warning to be more selective, not as a stronger signal.
The Session, Honestly
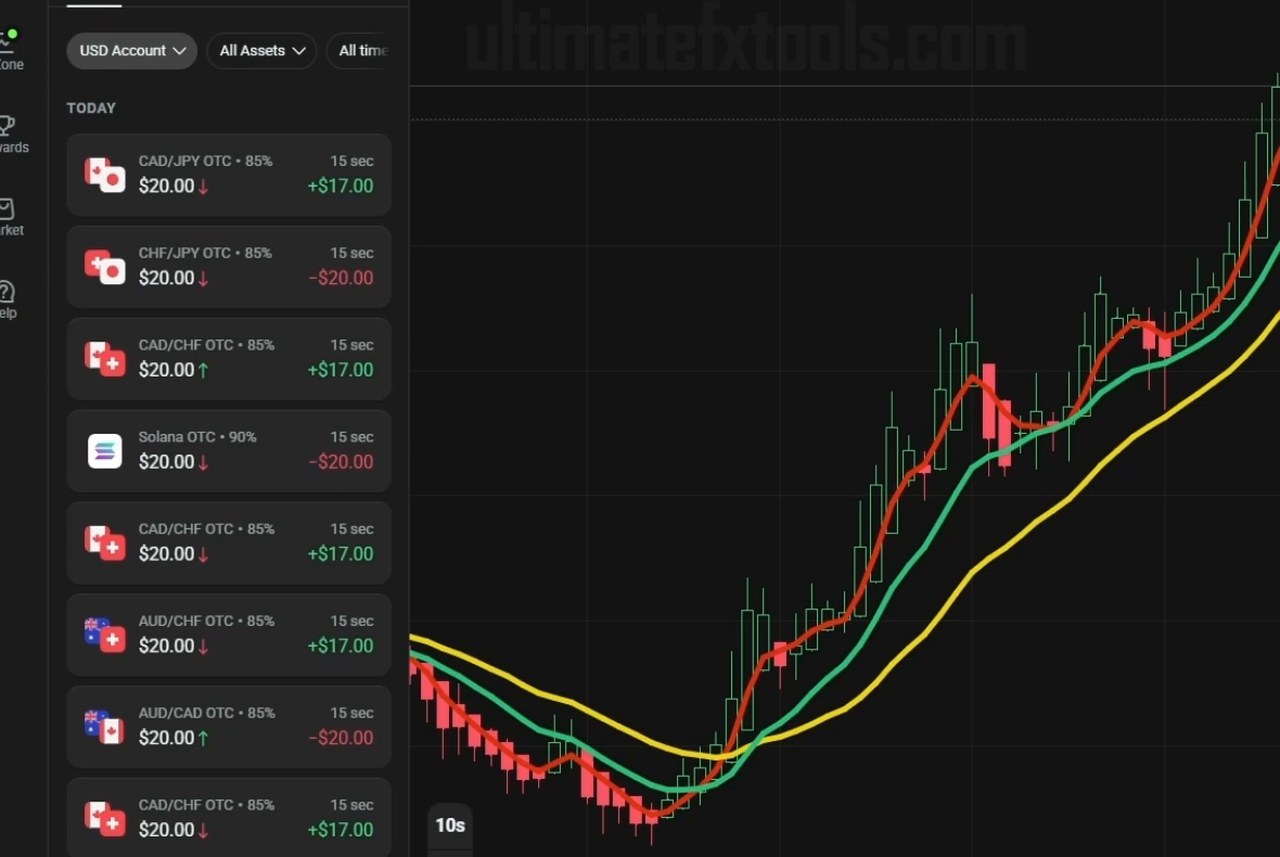
The visible history shows ten trades at a flat $20 stake: 7 wins and 3 losses. At the 85% payout that is seven returns of $17 against three full $20 losses — a net of about +$59 on the ten.
Two things belong next to that number, and neither is in the marketing version of this strategy:
- Ten trades is a story, not evidence. A 70% hit rate over ten entries is entirely consistent with a method that settles at 55% over a thousand. One session shows you the workflow; only a long log measures the edge.
- Break-even is higher than people assume. At an 85% payout you need 54.1% just to stand still — at 90%, 52.6%. Fixed-time trading gives you back less than you risk, so a strategy that wins "more than half the time" can still lose money. Three extra losses in this session would have wiped the profit out.
Watch the Full Session
Every entry, the crossovers as they form, the merged-line periods that get skipped, and the trades that lost:
Honest Weaknesses
- Moving average crossovers lag by definition. Every average is built from candles that have already closed. In a genuine turn the cross arrives after the first part of the move — that is not a flaw in the settings, it is what an average is.
- Heiken Ashi candles are not real prices. They are averaged, so the open and close you see are not the open and close your trade settles against. Useful for reading direction, misleading if you try to time an exact level from them.
- Sideways markets punish this setup hardest. The merged-lines state is common, and every false crossover inside it is a full $20 loss against a $17 win.
- The session is on OTC pairs. OTC prices are generated by the platform and exist only inside it — they are not the live market pair of the same name. Do not assume behaviour transfers between the two; if you learn the setup on OTC, re-test it on real pairs during market hours.
- 15 seconds is unforgiving. Hesitate a few seconds on a 15-second expiry and you have taken a materially different trade from the one the signal described.
Risk Rules for a 15-Second Strategy
- Flat stake, fixed in advance. The session's $20 never moves. Never raise the stake to recover a loss — doubling does not improve the odds of the next trade, it only makes a cold streak cost more.
- Cap the session with a fixed number of trades or a daily loss limit, and honour it. At 15 seconds a trade you can take fifty entries in a bad quarter of an hour.
- Skip the merged-lines periods. Not trading is the highest-value decision this chart offers.
- Demo first until acting on a crossover within a couple of seconds is routine. The mechanics of this method are simple; the execution speed is not.
- The full framework is in our risk and trade management guide — position sizing and loss limits will shape your results more than any WMA setting.
The Verdict
A solid 4 out of 5. What earns it: the rules are genuinely mechanical — a crossover either happened or it did not, so there is no interpretation to argue with; the three-line structure builds its own filter, because the merged state tells you when the method does not apply; it uses nothing but free built-in indicators on any platform; and the choice of weighted averages is the right one for a 10-second chart, where a slower average would confirm too late to trade.
The missing star is the lag that no crossover system escapes, plus the environment risk. In a trending stretch this reads beautifully. In a chopping market the same rules will hand you false cross after false cross, and at an 85% payout the losses are bigger than the wins. Treat the separated-lines requirement as mandatory rather than optional and this is a clean, disciplined short-term method; ignore it and the crossovers alone will not save you.
#OlympTrade #WMAStrategy #TripleWMA #HeikenAshi #MovingAverage #15SecondTrading #ShortTermTrading #TradingStrategy #Scalping
Frequently Asked Questions
What are the WMA settings for this Olymp Trade strategy?
Three weighted moving averages set to 5, 15 and 30 periods, plotted on Heiken Ashi candles with a 10-second timeframe, trading a 15-second expiry. The WMA 5 is the fast line that generates the crossover, the WMA 15 is the confirmation line it crosses, and the WMA 30 shows the slower underlying direction.
What does it mean when all three WMA lines merge together?
It means there is no directional agreement left - the fast, medium and slow averages are all reading the same value, which is what a flat or indecisive market looks like. Crossovers taken while the lines are bunched together are the least reliable ones, because the fast line can flip either side of the others on a single candle. The setups worth taking are the ones where the lines separate cleanly.
What win rate does a 15-second trade need to break even?
At the 85% payout shown in the session, break-even is about 54.1% - you need slightly more than half your trades to win before you make anything. At a 90% payout it is 52.6%. This is why a 60% strategy is a good one in fixed-time trading and why a handful of extra losses matters far more than it looks.
Do OTC pairs behave the same as real market pairs?
No. OTC prices are generated by the platform and only exist inside it, so they are not the same instrument as the live market pair of the same name. A setup that reads well on OTC will not necessarily read the same way on the real pair during market hours, and results from one should not be assumed to transfer to the other.
This content is for educational purposes only and is not financial advice. Trading involves substantial risk; you can lose some or all of your capital. No result is guaranteed and past performance does not indicate future results. Trade only what you can afford to lose.
More moving-average setups: the Rainbow EMA + WMA method uses the same idea with more lines, and the EMA + WMA Quickler strategy applies it to 5-second trades. For a non-crossover approach, see RSI divergence on Olymp Trade.