Two Built-In Indicators Most IQ Option Traders Never Open
IQ Option ships with dozens of indicators, and most traders stop at RSI, Bollinger Bands and a moving average. This session uses two that sit further down the list: Hi-Low Bands and the KDJ oscillator. Both are free, both are already on the platform, and neither needs a download or a script.
The markets are unusual too. Instead of a forex pair, the trades are on IQ Option’s JPY Currency Index and USD Currency Index, which track one currency against a basket of others. The video ends with four live trades at $50 each on an 85% payout, 1-minute expiries. Three close green and one closes red. We read every number off the screen and checked the four results against the account balance, and they match exactly.
One note before the details. The chart’s own date stamp reads 30 September 2024. This is the same session as our earlier Hi-Low Bands + KDJ 10-second chart guide, re-edited into a tighter cut. That page explains the theory. This one logs what each trade actually did.
The Settings, Exactly as Shown
Both settings panels are opened on screen, and the values are easy to read:
| Indicator | Setting |
|---|---|
| Hi-Low Bands (listed as “High Low Bands”) | Period 12, Percent Shift 0.11, Source close |
| KDJ | Period (dK) 10, Signal (dD) 4, Smoothing 4, Overbought 80, Oversold 20 |
| Candles | 10 seconds on the JPY index; the USD index and EUR/USD charts in the video are on 5-second candles |
| Trade | IQ Option Binary, 1-minute expiry, $50 flat stake, 85% payout (+$42.50 on a win) |
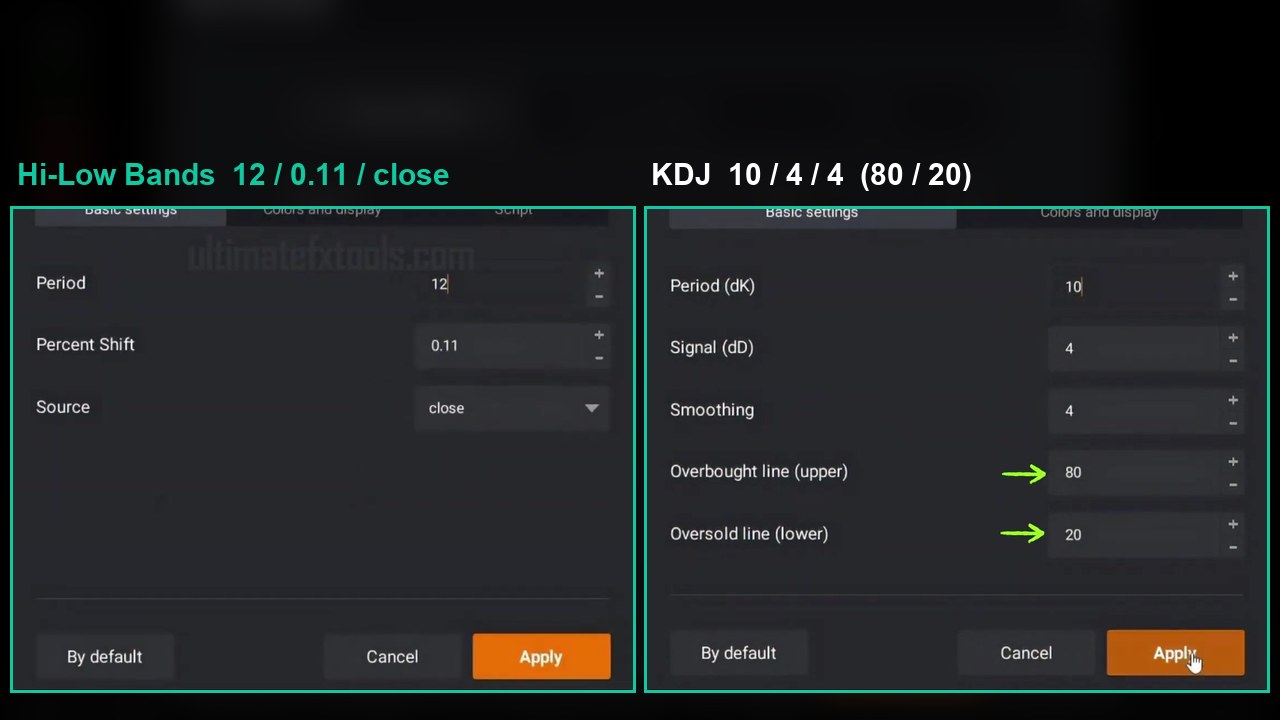
The one value worth double-checking is Percent Shift 0.11. Our older write-up of this session listed it as 1, but both cuts of the video show 0.11. The difference is large. At 1% the bands would sit far away from price on a 10-second chart. At 0.11% they are close enough to matter once you zoom out.
What Each Indicator Does
Hi-Low Bands: Where Price Sits in Its Range
Look at the settings panel and you can see how the indicator is built. It takes only a period, a percentage and a price source, so it is an envelope: a smoothed average of the close with one band drawn a fixed percentage above it and one the same distance below. When price presses the upper band it is stretched to the top of its recent range. At the lower band it is stretched to the bottom.
On a fast chart there is a practical catch. At 0.11% the bands sit a few tenths of a point from price, so on a zoomed-in 10-second chart they can disappear off the top and bottom of the screen. In the video the trader zooms out (the chart’s zoom selector reads 15m and 30m) to see the bands, then zooms back in to time the entry. Do the same. Use the bands to judge the stretch and the KDJ to time the trade.
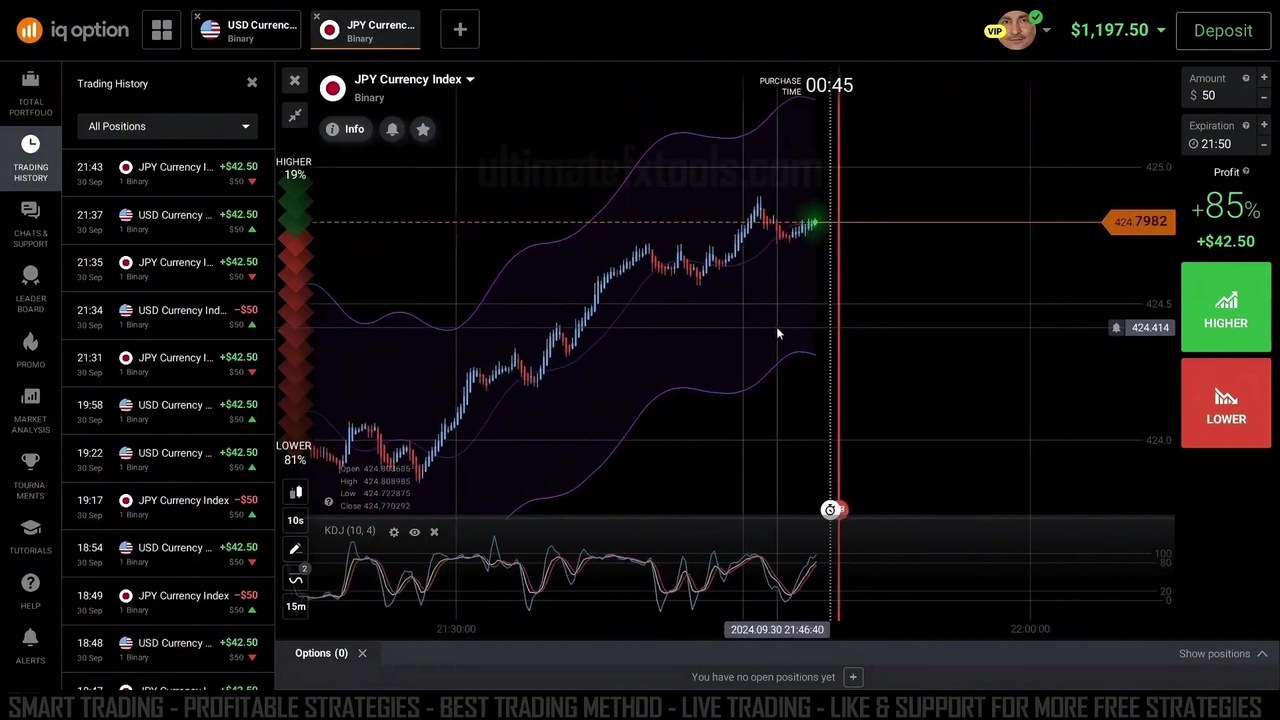
The zoomed-out JPY index above shows the picture you want for a DOWN trade: a long climb that has carried price right up to the upper band.
KDJ: A Stochastic With a Third Line
KDJ starts from the same calculation as the stochastic oscillator. K is the fast line and D is its smoothed signal line, both measuring where the close sits in the recent high-low range. The third line, J, is calculated as 3×K − 2×D. That makes it the most sensitive of the three, and it can run past 0 and 100. That is why the USD trade below shows a KDJ reading of −4.61, below the bottom of a normal stochastic.
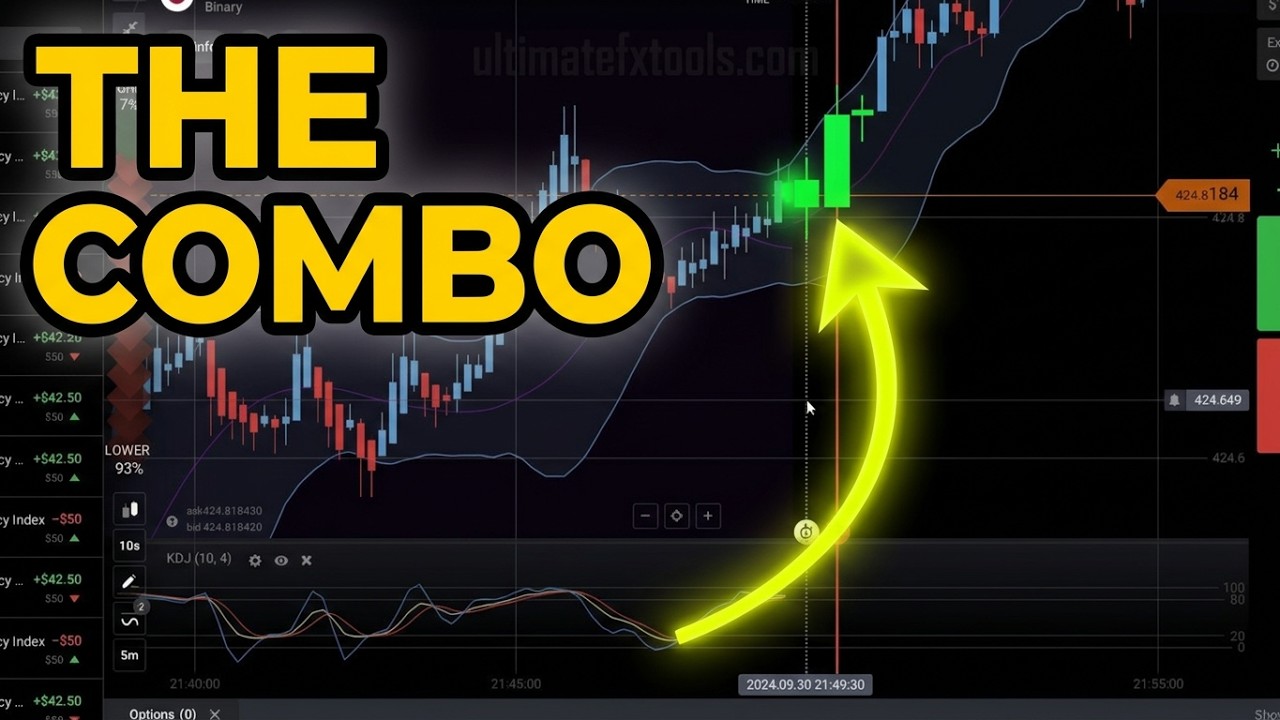
The video’s description calls the signal a line squeeze. When K, D and J pinch together into one tight bundle near the 80 line or the 20 line, momentum has stalled at an extreme. When the bundle then starts to turn, it is the cue to trade the reversal.
How to Add Them on IQ Option
- Open the asset picker, type “curren” in the search box, and pick JPY Currency Index or USD Currency Index under Binary. Both paid 85% for 1-minute-plus trades in the video, while the Digital versions showed 91%.
- Set the candle size to 10 seconds from the timeframe button at the bottom-left of the chart.
- Click the indicators button to open Chart Analysis → Indicators, search for High Low Bands, add it, then open its gear icon and set 12 / 0.11 / close.
- Search for KDJ, add it, and set 10 / 4 / 4 with levels 80 / 20. It opens in its own panel under the price chart.
- Save it as an indicator template (there is a “Save Indicator Template” button in the same menu) so you do not have to rebuild it on every asset.
The Entry Rules
The video has no voiceover and no written rule list. The rules below come from what the trader circles and points at on screen, and they match the “line squeeze before reversals” that the video’s description promises.
- DOWN: price has climbed into the upper Hi-Low Band, the three KDJ lines squeeze together near 80, and the bundle starts to roll over.
- UP: the mirror image. Price has fallen to the lower band, the KDJ lines bunch up near 20 or below, and they start to turn up.
- Expiry: 1 minute (the next minute boundary on IQ Option’s Binary option). Same stake every time.
- Skip: when the KDJ lines are spread apart and crossing in the middle of the panel, nothing has stalled yet. Wait.
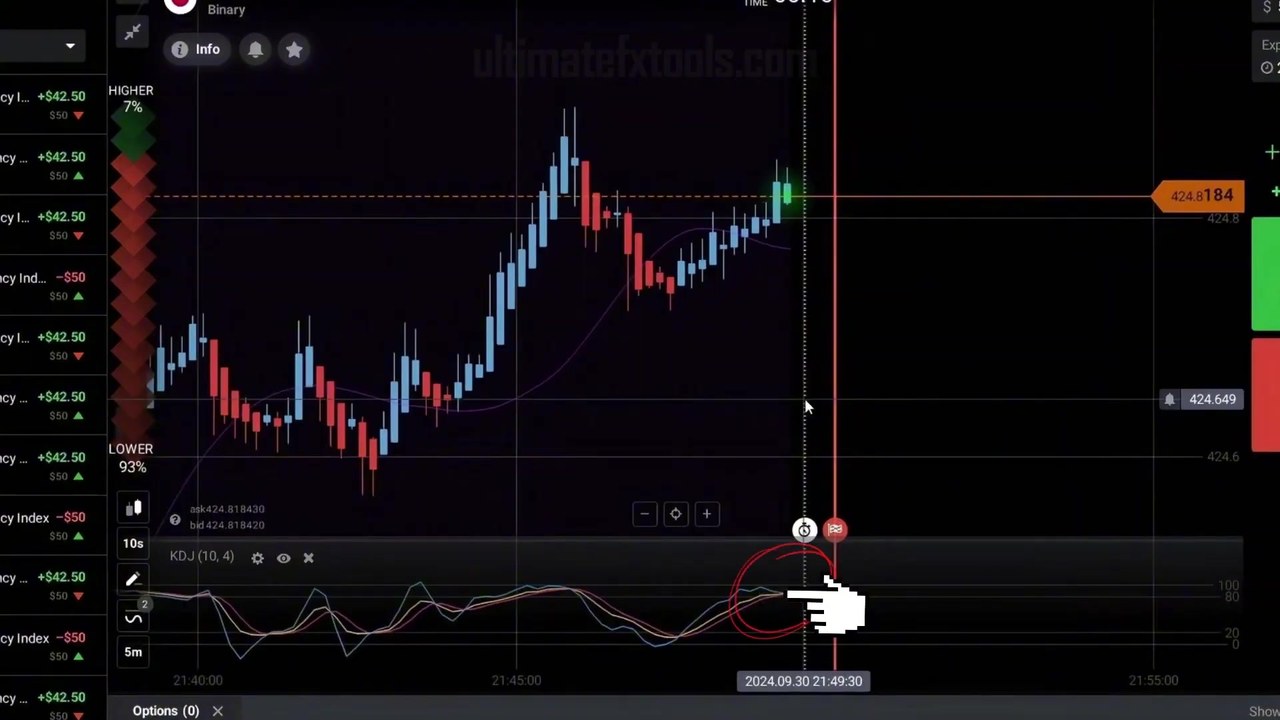
This is the frame where the trader circles the squeeze: the three KDJ lines meet just under 80 (the panel reads 77.48) after a rally on the JPY index. The next thing the video shows is the DOWN trade going in.
All Four Trades, Checked Against the Balance
The balance before the first trade is $1,197.50. Each trade risks $50 and returns $92.50 on a win ($50 back plus $42.50 profit).
| # | Asset | Direction | What the chart showed | Result | Balance after |
|---|---|---|---|---|---|
| 1 | JPY Currency Index | DOWN | Rally into the upper band, KDJ squeezed at 77.48 | +$42.50 | $1,240.00 |
| 2 | USD Currency Index | UP | Slide to the lows, KDJ at −4.61 | +$42.50 | $1,282.50 |
| 3 | EUR/USD | DOWN | Steep fall, KDJ flat at 15.66 (oversold) | +$42.50 | $1,325.00 |
| 4 | JPY Currency Index | DOWN | Sharp spike up, KDJ near the top | −$50.00 | $1,275.00 |
From $1,197.50 to $1,275.00 is +$77.50, which is exactly three wins at $42.50 minus one loss of $50. The trading-history panel on the left of the screen also lists earlier trades from that evening (back to 18:48). Those are not shown being taken, so they are not counted here.
Trade 1: The Textbook Entry
The JPY index has climbed for several minutes and is pressing the upper band. On the 10-second chart the KDJ lines have bunched together just under 80 and are tipping over. The trader places a DOWN trade expiring at 21:50 and it closes green. It is the cleanest example of the rule in the video.
Trade 2: Red Before It Went Green
On the USD index the setup is reversed. Price has slid to the lows and the KDJ has dropped to −4.61, so the trader takes an UP trade expiring at 21:51. It does not go smoothly. With nine seconds left the position shows −$50 expected, and the price is just under the entry. It ticks back above in the final seconds and closes +$42.50. The trade details confirm it: $50 invested, +$42.50 result, “position closed automatically” at 21:51. On a 1-minute expiry, a win and a loss can be one tick apart.
Trade 3: The One That Broke the Rule and Won
The third trade is not on a currency index at all. It is on EUR/USD, and it is not a reversal. Price is in a steep, steady fall and the KDJ is lying flat at 15.66, deep in oversold. The rule above would say wait for an UP setup, but the trader goes DOWN, with the trend. The trade swings from winning to a tie to −$50 before closing +$42.50. It worked, but it is a trend-following trade, not the squeeze reversal. Do not count it as evidence for the method.
Trade 4: The Loss, and What It Teaches
Back on the JPY index, price spikes sharply up and the KDJ climbs toward the top, so the trader takes a DOWN trade expiring at 21:58. This time the spike keeps going. The position sits at −100% for most of the minute and closes −$50. The video ends on that result.
This is the weak spot of any band-and-oscillator reversal. In a strong move, price can ride the upper band and the KDJ can stay pinned high for many candles. Selling the first touch is how these setups lose. Two habits help: wait for the KDJ bundle to actually turn down, not just reach 80, and be wary of a sudden vertical spike. Trade 1 came after a slow climb, while trade 4 came after a jump.
Video Chapters
- 0:00 Results preview and the two indicator names
- 0:12 Finding the JPY and USD currency indexes
- 0:20 Hi-Low Bands settings: 12 / 0.11 / close
- 0:30 KDJ settings: 10 / 4 / 4, levels 80 / 20
- 0:38 The KDJ squeeze circled on the JPY index
- 1:05 Trade 1: JPY index DOWN, won
- 1:30 Trade 2: USD index UP, won in the last seconds
- 3:20 Trade 3: EUR/USD DOWN with the trend, won
- 5:00 Trade 4: JPY index DOWN into a spike, lost
Watch the Video
Under six minutes, with both settings panels and all four trades:
Limits to Keep in Mind
- Four trades is a demonstration, not a record. At an 85% payout you need to win about 54% of trades just to break even. Four trades cannot tell you whether this method clears that.
- Only two of the four are the clean reversal setup. Trade 3 was a trend trade, and trade 4 is the rule failing in a spike.
- No narration. The rules are read from the trader’s circles and arrows, not stated in the video. Write your own version down before you test it.
- Currency indexes move differently from pairs. A basket index is smoother than a single pair. Do not assume the same settings behave the same way on EUR/USD or on OTC assets.
- An old session. The footage is from September 2024. Payouts and the asset list on IQ Option change, so check what your account shows today.
Risk Management
- Keep the stake flat. The video uses $50 on every trade, with no doubling after the loss.
- Set a daily loss limit and a maximum number of trades before you start, and stop when you hit either one.
- Practise on the IQ Option demo account until you can spot the squeeze without hesitating, then log at least 50 trades before you risk real money.
- Binary options are restricted in some countries, so check the rules where you live, and only trade money you can afford to lose.
Frequently Asked Questions
What are the Hi-Low Bands and KDJ settings in this IQ Option strategy?
Hi-Low Bands (listed as High Low Bands on IQ Option): period 12, percent shift 0.11, source close. KDJ: period (dK) 10, signal (dD) 4, smoothing 4, overbought 80 and oversold 20. The JPY index runs on 10-second candles, and trades are 1-minute Binary options.
What is a KDJ line squeeze?
It is when the K, D and J lines of the KDJ pinch together into one tight bundle near the 80 or 20 level. It shows momentum has stalled at an extreme. The entry comes when the bundle starts to turn: down from near 80 with price at the upper band, up from near 20 with price at the lower band.
Are Hi-Low Bands and KDJ free on IQ Option?
Yes. Both are built into the IQ Option platform. Search for High Low Bands and KDJ in the Chart Analysis indicators menu and add them at no cost. You can practise the whole setup on the demo account.
Why can't I see the Hi-Low Bands on a 10-second chart?
At a 0.11% shift the bands sit a few tenths of a point away from price, so a zoomed-in 10-second chart can push them off screen. Zoom out to see where price sits in the bands, then zoom back in to time the entry with the KDJ.
What was the result in the video?
Four $50 trades at an 85% payout: three wins at +$42.50 and one loss of $50, for a net of +$77.50. The balance went from $1,197.50 to $1,275.00, which matches the four trades exactly. Four trades is too few to judge the method, so test it on a demo account first.
The Verdict
4 out of 5. The two settings panels are shown clearly, the markets are a genuine change from the usual pairs, the loss stays in the cut, and every result reconciles with the balance. It loses a point because nothing is explained out loud. The rules have to be read from circles and arrows, and one of the three wins came from a trade that does not follow them.
As a starting point it is useful. Hi-Low Bands for the stretch, KDJ for the timing, and the line squeeze as the trigger give you a setup simple enough to test honestly. Build it on a demo account, write down your own skip rule for spikes, and let your own log decide.
#IQOption #KDJ #HiLowBands #CurrencyIndex #BinaryOptions #TradingStrategy #10SecondChart
This content is for educational purposes only and is not financial advice. Trading involves substantial risk; you can lose some or all of your capital. No result is guaranteed and past results do not indicate future outcomes. Always practise responsible money management, limit your daily trades, and trade only what you can afford to lose.
Related reading: the Hi-Low Bands + KDJ 10-second guide covers the theory behind this session, and the 6 best IQ Option indicators lists the more familiar tools with their settings. Hi-Low Bands also appears in IQ Option live trading with QStick. For more, browse the IQ Option hub or the full strategy library.