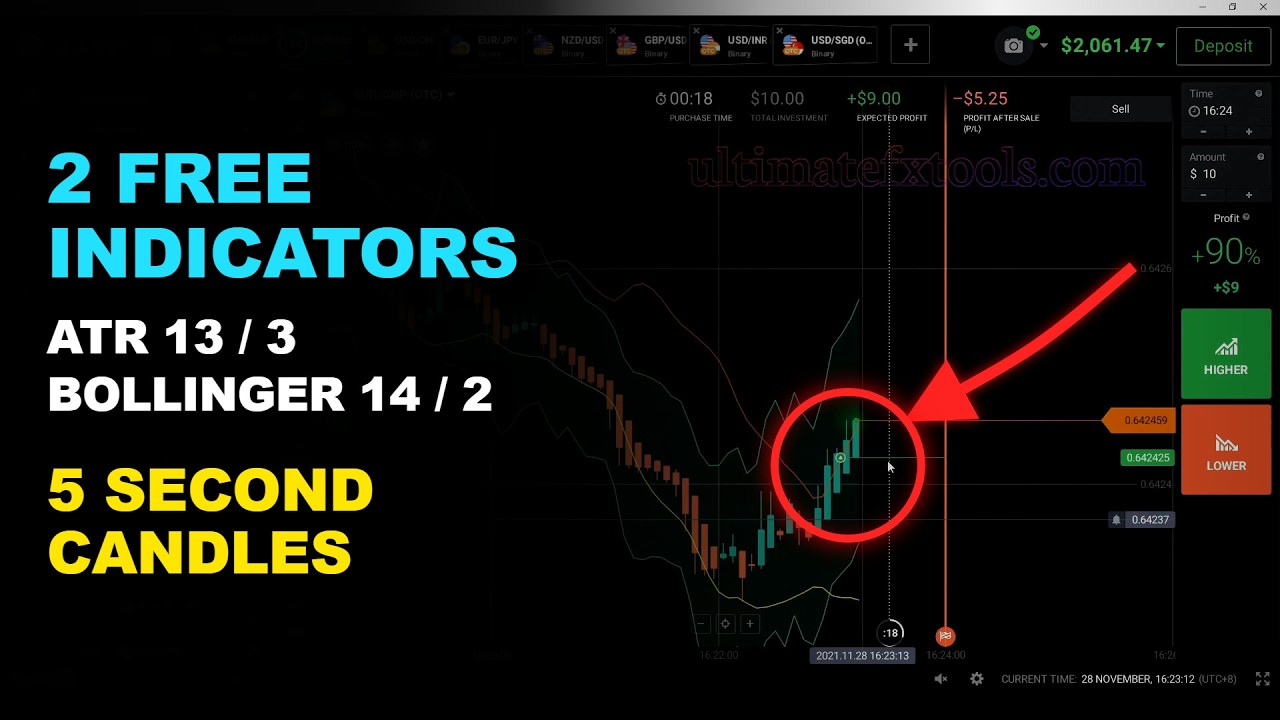
Most band strategies fall apart at the same place: the write-up says "add Bollinger Bands" and never tells you the period, so you end up guessing and wondering why your chart looks nothing like the video. This one has every number in it. Two free indicators that ship with IQ Option, one entry condition, and a session recorded trade by trade.
It is also an honest 3.5 rather than a 5, and the reasons are at the bottom: the session is on OTC pairs, and one of the three trades handed the stake straight back.
The settings, in full
Both indicators are already in the IQ Option indicator list — nothing to download, nothing to install. Add them from the Indicators tab and set them like this:
| Setting | Value | Why it matters |
|---|---|---|
| Chart | 5-second candles | The whole setup is built around this speed |
| ATR Bands — period | 13 | The volatility envelope |
| ATR Bands — offset | 3 | How far the bands sit from price |
| ATR Bands — source | Close | Not the default on every build — set it |
| Bollinger — period | 14 | Deliberately short, to keep up with 5s candles |
| Bollinger — deviation | 2 | Standard |
| Bollinger — middle line | No line | Removed on purpose — see below |
| Stake / expiry | $10 · 1–2 minutes | Flat stake, no increasing after a loss |
The one setting people get wrong is the last one. The Bollinger middle line is switched off, so only the outer bands are drawn. That is not a maths decision — the middle line is just a 14-period average — it is a readability one. It sits in exactly the region where the ATR bands are crossing, and on a 5-second chart three lines stacked in the same place hide the signal instead of confirming it.
The entry: one condition, two halves
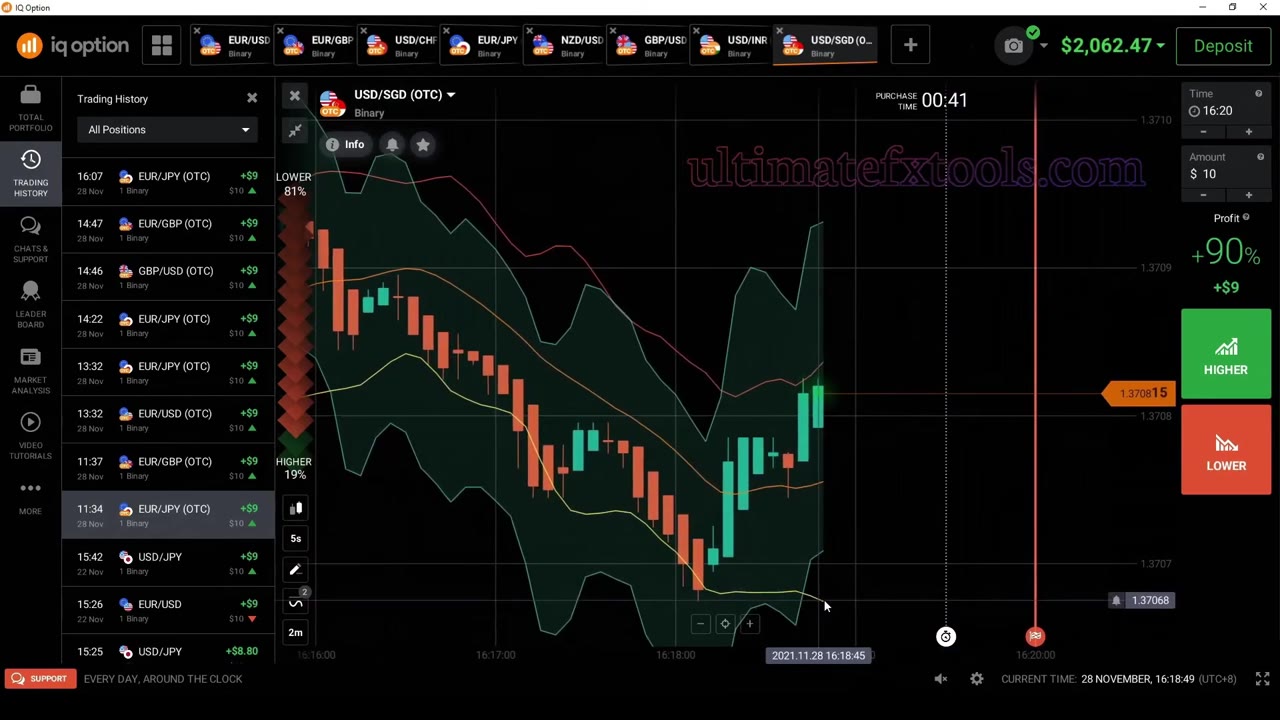
Watch the lower pair of bands only. The setup is the moment the lower ATR band and the lower Bollinger band cross each other — and, at the same time, the candles are already turning up. When both are true, the trade is HIGHER.
The second half is the part worth repeating, because it is the part that gets dropped. Bands can meet while price is still falling. That is not the setup; that is two lines touching. The candles have to have already turned before the cross counts.
Trade one: the flat one
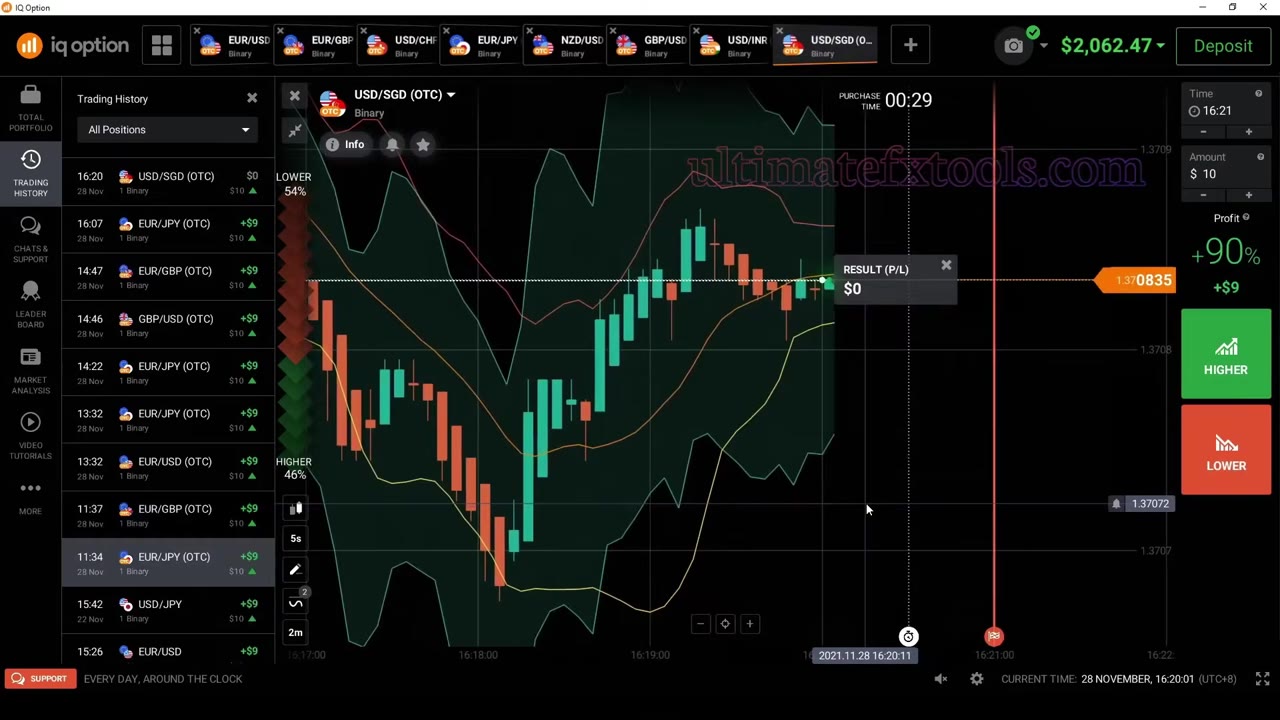
First entry was USD/SGD (OTC). The lower bands crossed, the candles were rising, the trade went higher at $10. It closed at $0.
Not a loss — a tie. Price finished where it started and the stake came back untouched. On a 5-second chart with a one-minute expiry that is a genuinely common outcome, and it is worth meeting it here rather than in your own account wondering what went wrong. Nothing went wrong. The market simply did not move.
The next two
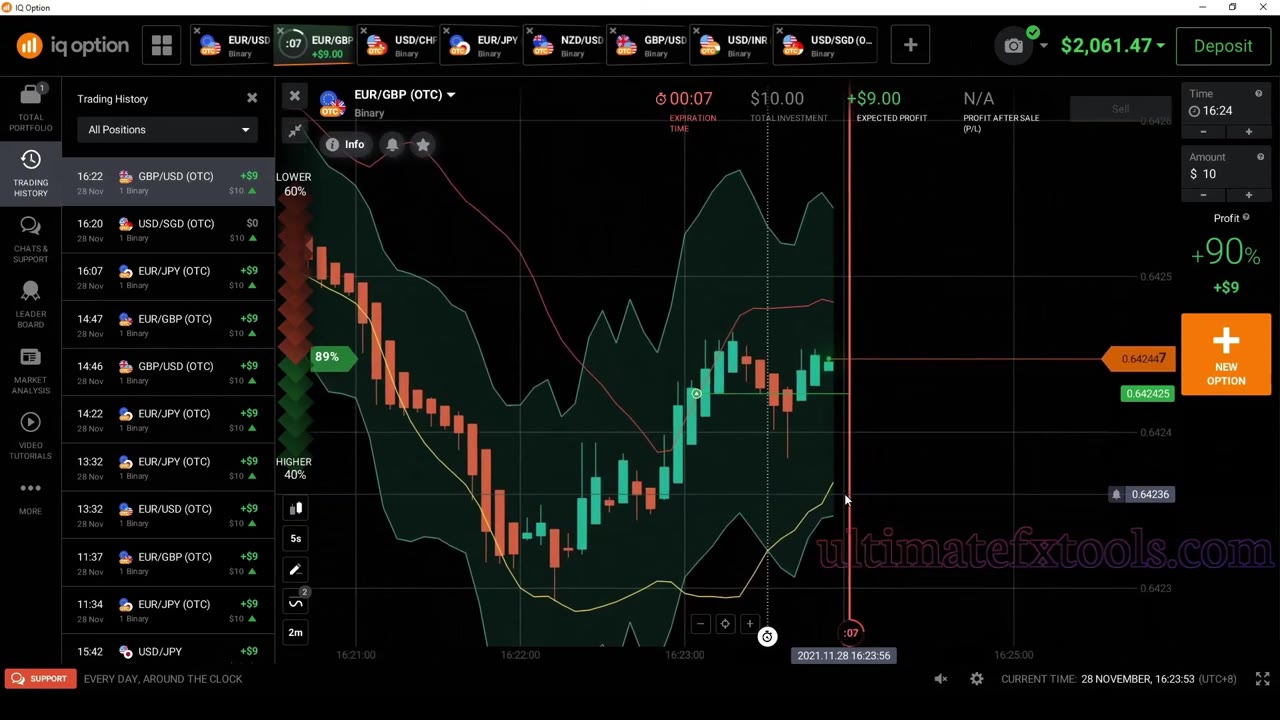
The second entry was the same picture — lower bands crossing, candles pushing up — and it closed green at +$9. The third, on EUR/GBP (OTC), did the same.
So the session is three entries: two green, one flat, none red. That is a small sample and it is presented as one. Three trades is a demonstration of a setup, not evidence that it works, and anyone counting it as a win rate is counting noise.
The payout decides more than the signal does
The IQ Option panel in this session reads +90%, which is near the friendliest end of what these pairs pay. That number is not decoration — it sets the win rate you need simply to stand still:
| Payout on the pair | Win rate just to break even |
|---|---|
| 90% (this session) | 52.6% |
| 85% | 54.1% |
| 80% | 55.6% |
| 70% | 58.8% |
| 50% | 66.7% |
Check the payout on your own pair before you arm this. The same crossing, taken at 50%, needs you to be right two times in three instead of roughly one in two. Nothing about the chart changed — only the price the broker is quoting for taking the trade. We work through the same maths in more depth in the ADX filter backtest, where seven strategies were run twice over 953 trades and the losing months were published alongside the winning ones.
Two things to know before you copy this
It is an OTC session
Every pair on screen carries the OTC tag — USD/SGD (OTC), EUR/GBP (OTC), and the rest of the open tabs. OTC prices are generated by the broker, not taken from the live interbank market, and they behave differently: smoother in places, and available at hours when the real market is shut.
Two consequences. Results on OTC do not automatically carry over to weekday market pairs, so test the setup on both before trusting it on either. And MetaTrader cannot see these charts at all — MT4 and MT5 have no access to a broker's OTC feed, so you cannot confirm an OTC signal with an MT4 indicator. That mismatch is the single most common reason someone concludes an indicator is broken when it is working exactly as designed.
The footage is from 2021
The platform clock in every frame reads 28 November 2021. The video says as much — "an old, but solid setup" — and it is worth stating plainly rather than letting you notice the date and wonder what else was not mentioned. The IQ Option interface has changed since; the indicator settings and the entry rule have not. What you should not carry over from a 2021 recording is the payout: check today's number on your own account.
What we would change
Two entries, both cheap to test on a demo account before risking anything:
- Add a direction filter. The setup takes every lower-band cross with rising candles, regardless of what the wider trend is doing. Our own testing on a different set of strategies found a trend filter was the entire edge — the same idea applies here, and a higher-timeframe check costs nothing.
- Skip the crossings that happen inside a flat range. When the bands are narrow and price is drifting sideways, the lower bands touch constantly and mean very little. The crossings worth taking are the ones after a real move down, where the turn actually has something to reverse.
Why 3.5 and not higher
The settings are complete and the entry rule is unambiguous, which is more than most band strategies offer — that is the half-point above average. What holds it back is that the evidence shown is three trades on OTC pairs from a 2021 session, with no filter for market conditions and no losing trade in the sample to show how it behaves when it is wrong. It is a clean setup worth testing on demo. It is not a proven system, and we are not going to describe it as one.
The session
Trading carries substantial risk and you can lose your capital. Nothing here is a guarantee of profit, past results do not predict future ones, and everything above is for education. Test on a demo account first and never stake money you cannot afford to lose.