"Top 5 Best Olymp Trade"
"Olymp Trade Techniques"
"Free and Premium Strategies"
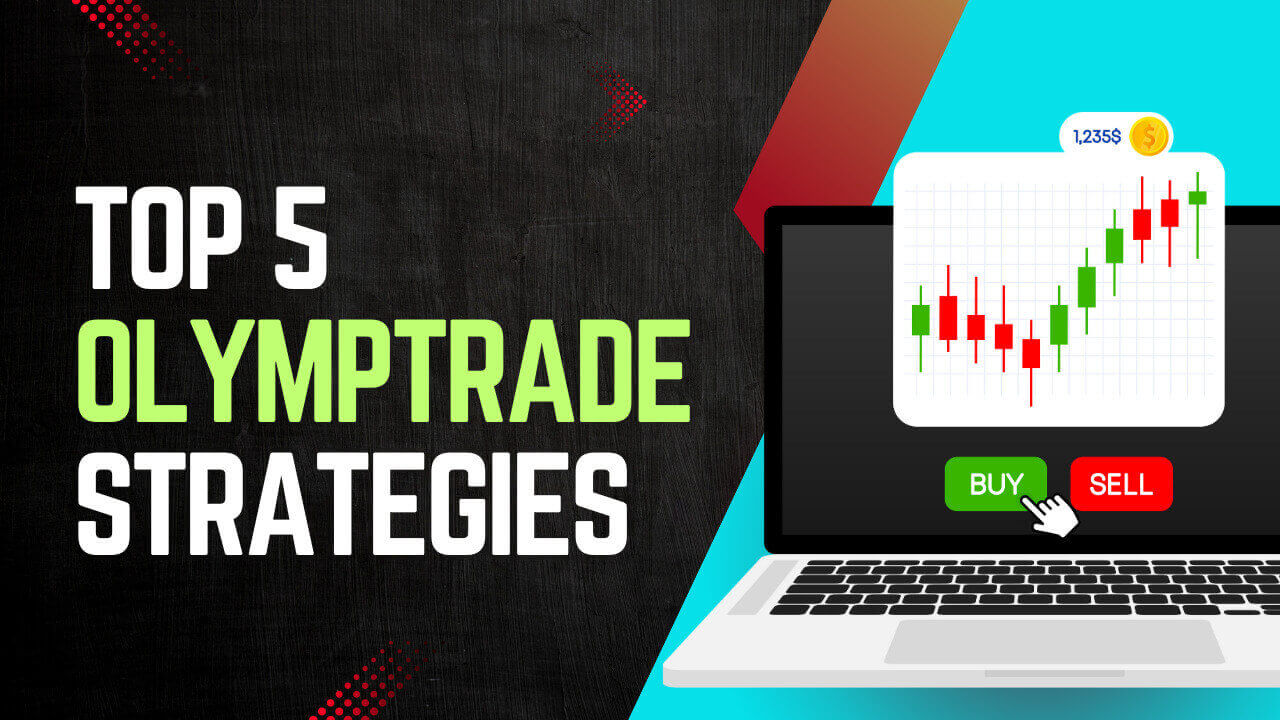
Top 5 Strategies for Success on Olymp Trade
The Olymp Trade Platform is one of the leading online trading platforms, offering an exciting and accessible way to get involved in the world of trading. Whether you’re an experienced trader or just starting out, understanding and applying effective strategies can significantly enhance your trading outcomes. Here are the top five strategies that can guide you towards success in Olymp Trade:
1. Trend Trading
Trend trading is a strategy based on the technical analysis of market trends. This involves identifying an asset’s momentum in a particular direction and then placing trades that align with its specific direction.
How to use it:
Look for patterns over time. If an asset’s price consistently increases, it’s in an upward trend. If it consistently decreases, it’s in a downward trend. To effectively use this strategy, you can use our advance Metatrader 4 Indicator to easily navigate trends based on its trend direction. By using our DreamX Indicator.
2. Support and Resistance
This strategy involves identifying key price levels that the market tends to respect, and these are known as support and resistance levels. Some experts relies on the use of Bollinger Bands or Keltner Channel.
How to use it:
A support level is usually a low point in price that the market has had trouble falling below, while a resistance level is a high point that the market has found hard to break through.
We also have advance tool for breaking up support and resistance of the current price market. We have the RSI Signal Indicator and the Binary Sniper Pro which gives relevant results for trading
3. The SMA (Simple Moving Average) Strategy
The SMA strategy utilizes moving averages to determine potential price trends.
How to use it:
Calculate the SMA by adding together a set number of price points, according to your desired market method and then dividing by the total number of issues. This gives an average price over a certain period, which can indicate a trend if the average is moving up or down.
4. The RSI (Relative Strength Index) Strategy
RSI measures the speed and change of price movements and can be particularly useful for identifying overbought or oversold conditions in a market.
How to use it:
An RSI reading over 70 indicates that an asset may be overbought (and therefore due for a price drop), while a reading under 30 suggests that it may be oversold (and could be due for a price rise). It is the same as having the RSI Alert Indicator.
5. The Stochastic Oscillator Strategy
This strategy uses a momentum indicator comparing a particular closing price of an asset to a range of its prices over a certain period of time.
How to use it:
The oscillator’s value fluctuates between 0 and 100. Traditionally, readings over 80 are considered in the overbought range, and readings under 20 are considered oversold. You can have our advance Stochastic Oscillator (Stoch Oscillator)
Remember, no strategy guarantees success every time, but by understanding these strategies and when to use them, you can improve your chances of making successful trades. Always practice risk management and never invest more than you’re willing to lose.