What the RSI Alert Indicator Actually Does
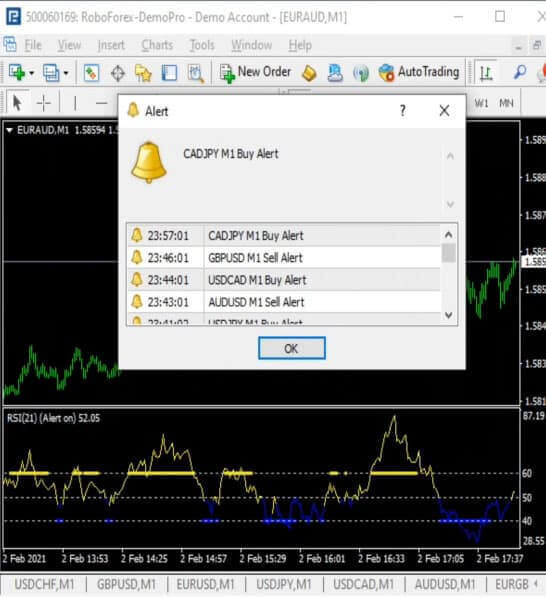
Most RSI tools make you watch the oscillator. This one watches it for you: when the setup appears on a closed candle, it fires a popup, a sound, and — if you switch it on — a push notification to your phone. You can be away from the screen and still know the moment a signal prints.
Your download actually contains two RSI alert tools, for MT4 and MT5 both. They solve the same problem in different ways, so it is worth knowing which one you have on the chart.
1. RSI + Bollinger Alert — the one most people should start with
This is the newer of the two, and it does not trade RSI levels on their own. It waits for price to stretch to a Bollinger band and then come back, using RSI only as a filter to throw out the signals that are fighting the trend. The exact rules it uses:
- Buy arrow — the candle closes back above the lower Bollinger band after the previous candle closed at or below it, and RSI is below 50.
- Sell arrow — the candle closes back below the upper band after the previous candle closed at or above it, and RSI is above 50.
That second half of each rule is the part that matters. A band touch on its own happens constantly in a trending market; requiring RSI to still be on the weak side of 50 removes the signals that fire against a strong move.
Default settings
- RSI Period: 14
- Bollinger Period / Deviation: 20 and 2.0
- Buy below / Sell above: 50 and 50 — the RSI filter
- Arrow offset: 1 pip from the candle
- Alerts: popup, sound and mobile push, all on by default
Leave these alone until you have watched a few hundred bars. Tightening the RSI filter (say, buy only below 40) gives you fewer and more selective arrows; loosening it gives you more noise.
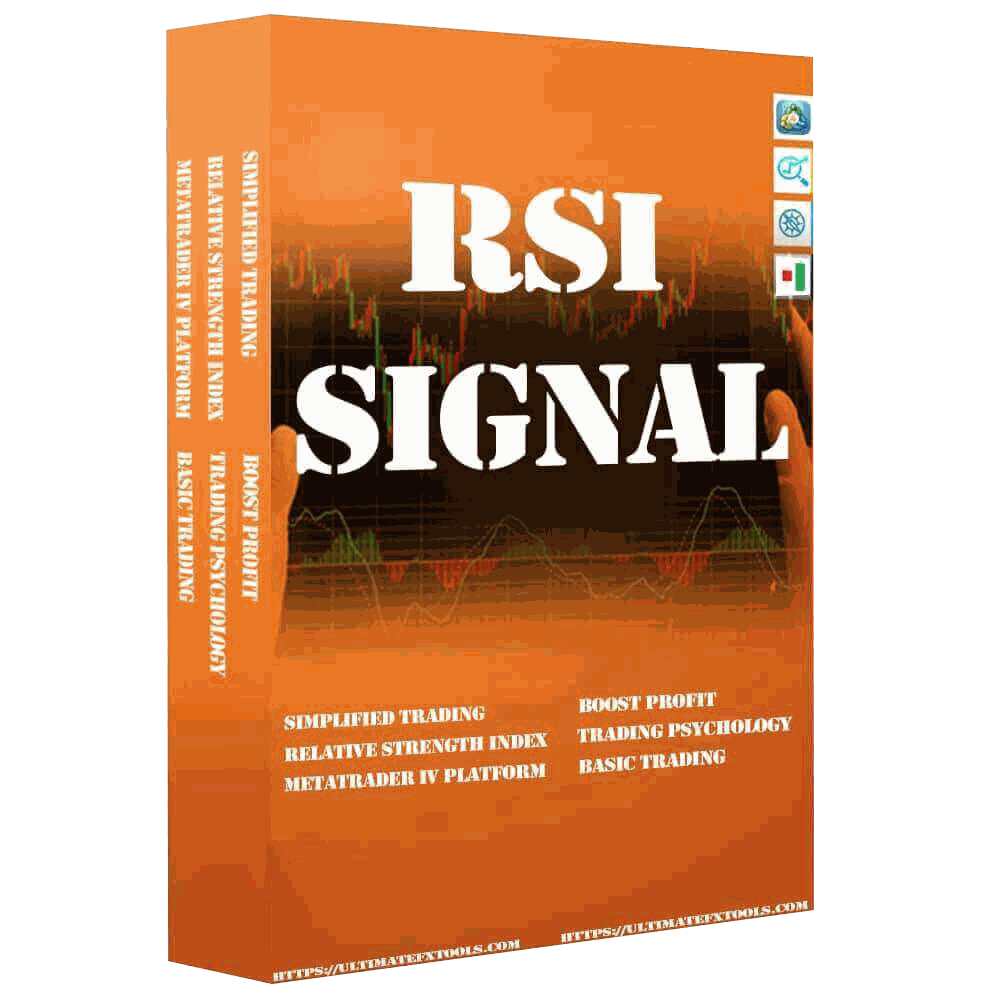
2. RSI Signal — the original
The older file plots RSI with a 21 period and alerts as price crosses its level line, with both the overbought and oversold inputs set to 50 by default — so out of the box it is a momentum-side indicator, telling you which half of the range RSI is sitting in, rather than a classic 80/20 extreme detector. Raise the levels yourself if you want the traditional stretched-market reading. It alerts on the desktop only, with no phone push.
It Does Not Repaint
Both tools calculate on closed bars only and fire their alert on the bar that has just finished. An arrow that appeared an hour ago is still in the same place tomorrow. That is worth checking in any signal indicator you use, because plenty of them quietly redraw their history and look far better than they were in real time.
How to Get the Alerts on Your Phone
This is the part most traders never set up, and it is the single most useful thing the indicator does. Alerts reach your phone through MetaQuotes' own notification service — no third-party app, nothing to pay for:
- Install MetaTrader 4 or 5 on your phone and open Settings → Messages. Copy the MetaQuotes ID shown there.
- On your PC terminal, go to Tools → Options → Notifications, tick Enable Push Notifications, paste the ID and click OK. Use Test to confirm the phone receives it.
- On the chart, open the indicator's settings and make sure the mobile alert input is set to true.
Your desktop must stay switched on with the chart open — the terminal is what sends the message. The phone only receives it.
How to Read a Signal Without Fooling Yourself
A band rejection is a mean-reversion idea: it assumes price has stretched too far and is snapping back. That assumption is right often enough to be useful and wrong often enough to hurt, and the difference is almost always context:
- It works best in a range. Sideways price that keeps rotating between the bands is exactly the environment this logic was built for.
- It struggles in a strong trend. During a hard sell-off price can ride the lower band for hours, firing buy arrow after buy arrow into falling price. This is the failure mode to know.
- Check the higher timeframe first. If the 15-minute chart is in a clean downtrend, take the sell arrows on the 1-minute and skip the buys.
- Avoid the minutes around high-impact news. A news spike will blow through both bands and every reversal assumption behind them.
If you want a fuller framework for filtering signals like these, our risk and trade management guide covers position sizing and daily loss limits, which matter more to your results than any indicator setting.
Honest Limitations
- It is a trigger, not a system. The arrow tells you when a condition occurred. Direction bias, position size and when to stay out are still your decisions.
- Custom indicators do not run in the MetaTrader phone apps. The .ex4/.ex5 files need MetaTrader on a Windows PC. Your phone can receive the alerts, but it cannot run the indicator.
- More arrows is not better. Loosening the RSI filter to get more signals mostly adds the ones the filter existed to remove.
- No indicator has a fixed win rate. The same rules behave very differently on a quiet range and a trending session, which is why we do not publish a percentage next to it.
Frequently Asked Questions
Which file should I put on the chart?
Start with RSI + Bollinger Alert. It has the trend filter, the arrows and the mobile push. Keep RSI Signal for a plain momentum read of which side of 50 RSI is on.
Why am I not getting phone alerts?
Three usual causes: the MetaQuotes ID was not pasted into Tools → Options → Notifications, the indicator's mobile alert input is set to false, or the PC terminal is closed. The desktop sends the notification, so it has to be running.
What timeframe works best?
The logic is timeframe-agnostic, but signals are cleaner where there is real liquidity. For short expiries the 1–5 minute charts during the London and New York sessions give the steadiest behaviour; the quiet hours produce the messiest arrows.
Is it included in the $39 library?
Yes. Both files ship for MT4 and MT5 inside the lifetime library, along with the rest of the indicator collection — one payment, no subscription.
This content is for educational purposes only and is not financial advice. Trading involves substantial risk; you can lose some or all of your capital. No result is guaranteed and past performance does not indicate future results. Trade only what you can afford to lose.